
Identification of Observations of Correct or Incorrect Actions using
Second Order Statistical Features of Event Related Potentials
P. Asvestas
1
, A. Korda
2
, S. Kostopoulos
1
, I. Karanasiou
3
, G. K. Matsopoulos
2
and E. M. Ventouras
1
1
Department of Biomedical Engineering, Technological Educational Institute of Athens, Athens, Greece
2
School of Electrical and Computer Engineering, National Technical University of Athens, Athens, Greece
3
Institute of Communications and Computer Systems, Athens, Greece
Keywords: Event Related Potentials, Error Related Negativity, Support Vector Machines, Classification.
Abstract: The identification of correct or incorrect actions is a very significant task in the field of the brain-computer
interface systems. In this paper, observations of correct or incorrect actions are identified by means of event
related potentials (ERPs) that represent the brain activity as a response to an external stimulus or event. ERP
signals from 47 electrodes, located on various positions on the scalp, were acquired from sixteen volunteers.
The volunteers observed correct or incorrect actions of other subjects, who performed a special designed
task. The recorded signals were analysed and five second order statistical features were calculated from
each one. The most prominent features were selected using a statistical ranking procedure forming a set of
32 feature vectors, which were fed to a Support Vector Machines (SVM) classifier. The performance of the
classifier was assessed by means of the leave-one-out cross validation procedure resulting in classification
accuracy 84.4%. The obtained results indicate that the analysis of ERP-signals that are collected during the
observation of the actions of other persons could be used to understand the specific cognitive processes that
are responsible for processing the observed actions.
1 INTRODUCTION
The participation in joint actions affects significantly
our behaviour, since decisions, perceptions and
beliefs are modulated by those of others with whom
we are together as family, friends, partners or
colleagues. Especially, the observation of actions
performed by other people contributes considerably
in the learning process and the skills we develop. A
person will try to reproduce actions that leave
positive impressions and avoid actions that are less
desirable or have negative impact. Furthermore, if an
observed action is recognized as important by
others, it is quite probable that the observer will
emulate this action.
Several studies suggest that learning by
observation and learning through self-action activate
similar mechanisms in the human brain. (Petrosini et
al., 2003). In particular, it has been observed that
when a subject performs an incorrect action, the
waveform of the event related potentials (brain
activity as a response to an external stimulus or
event - ERP) contains a negative peak known as
Error Related Negativity (ERN). ERN appears at
around 100ms after the start of the incorrect action
and is related with activity in the anterior cingulate
cortex (ACC) (van Schie et al., 2004). ERN is
consistently observed when a mismatch occurs
between representations of anticipated and actual
responses (Falkenstein et al., 2000). ERN with
smaller amplitude and longer latency has also been
found in experimental paradigms exploring aspects
of error monitoring that cover the observation of
actions of persons or artificial agents “exterior” to
the observer, termed “observed” ERN (oERN) (van
Schie et al., 2004). In correspondence with the ERN
measured when a person performs a wrong action,
ACC activity was implicated also in observation of
errors. It has been found that the medial prefrontal
cortex (MPFC) is activated not only when errors are
committed (Ridderinkhof et al., 2004), but also
when observing errors of other persons (Newman-
Norlund et al., 2009). Furthermore, it has been
shown that the MPFC is activated when observing
human errors and machine errors (Desmet et al.,
2014). Those findings strengthen the hypothesis that
158
Asvestas P., Korda A., Kostopoulos S., Karanasiou I., K. Matsopoulos G. and M. Ventouras E..
Identification of Observations of Correct or Incorrect Actions using Second Order Statistical Features of Event Related Potentials.
DOI: 10.5220/0005186501580164
In Proceedings of the International Conference on Bio-inspired Systems and Signal Processing (BIOSIGNALS-2015), pages 158-164
ISBN: 978-989-758-069-7
Copyright
c
2015 SCITEPRESS (Science and Technology Publications, Lda.)
the same mechanisms are activated both when
committing and when observing errors.
Nevertheless, because it has been found that
sometimes a negative ERN-like deflection is
produced even for correct actions (Scheffers and
Coles, 2000), something similar could happen when
observation of the action of other persons takes
place. Recently oERN investigations have been
expanded also to the context of cooperative and
competitive behavior, related to reward-dependency
of performance monitoring (de Bruijn and von
Rhein, 2012).
ERN presents special interest for implementing
Brain-Computer Interface (BCI) systems (Millán et
al., 2010). BCI systems decode brain signals into
actions controlling devices that will assist the users
of the system. In such systems an interface usually
has to recognize the user’s intent. When the user
perceives that the interface made an error in
recognizing his/her intent, it has been repeatedly
shown that an error-related potential, of a similar
kind to ERN is elicited (Ferrez and Millán,
2008).This potential has been termed “interaction
ErrP”, to reflect the fact that it is produced by the
interaction between the computer’s actions and the
user who recognizes them as incorrect. Interaction
ErrP exhibits a different morphology as compared to
the ERN elicited in classical forced-choice
experiments. In a recent study, it has been shown
that oERN can be detected in an observation
experiment using single trial signals (Vi et al.,
2014). Furthermore, in this study was shown that
ERN is also present during the anticipation of an
action.
Special efforts have been devoted in
implementing classification systems for identifying
the existence of oERN and ErrP, for improving the
performance of BCI systems (Ferrez and Millán,
2008). The existence of differences in the ERPs of
observers, when observing correct or incorrect
actions, might foster the development of
classification systems capable of detecting
performance errors of a human - or an artificial
agent – in need of being monitored in a joint-action
situation. The primary aim of the present study is to
propose a methodology for discriminating
observations of correct and incorrect actions, based
on scalp-recorded ERPs, using second order
statistical features.
2 MATERIAL AND METHODS
2.1 Subjects and ERPs’ Recording
Procedure
The ERP data used in the present study were
collected in previous research (van Schie et al.,
2004). The data were acquired from sixteen (16)
healthy volunteers (observers), who observed correct
or incorrect responses of subjects (actors)
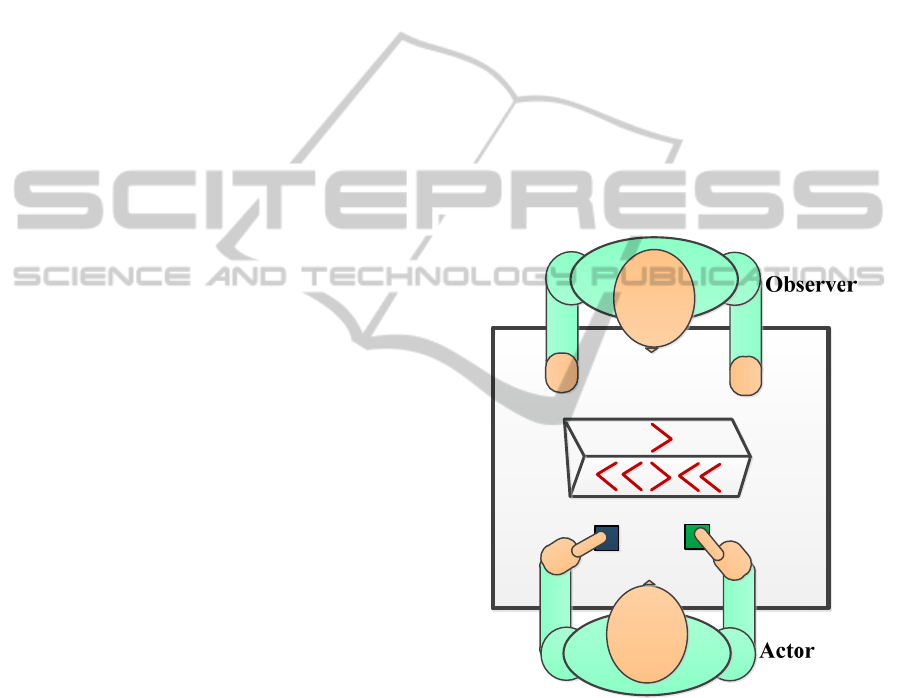
performing a special designed task. In particular, the
actors were seated in front of a table facing an
observer, having in front of them, on the table, two
joystick devices positioned to the left and right of a
LED stimulus device. The actors were asked to
respond to the direction of a center arrowhead
surrounded by distracting flankers pointing either in
the same direction as the center arrow, or in opposite
direction (Fig. 1).
Figure 1: Experimental setup.
The brain electrical activity of the observers was
recorded from 47 Ag/AgCl electrodes as well as
vertical and horizontal electro-oculograms and was
sampled with sampling rate 250 Hz. Electrodes were
mounted in an elastic cap (Easy cap, Montage 10)
configured for equal arrangement of the electrodes
over the scalp (Fig. 2) (van Schie et al., 2004). The
electrode common was placed on the sternum.
Ocular artifacts were corrected using the method
described in (Gratton et al., 1983).
IdentificationofObservationsofCorrectorIncorrectActionsusingSecondOrderStatisticalFeaturesofEventRelated
Potentials
159
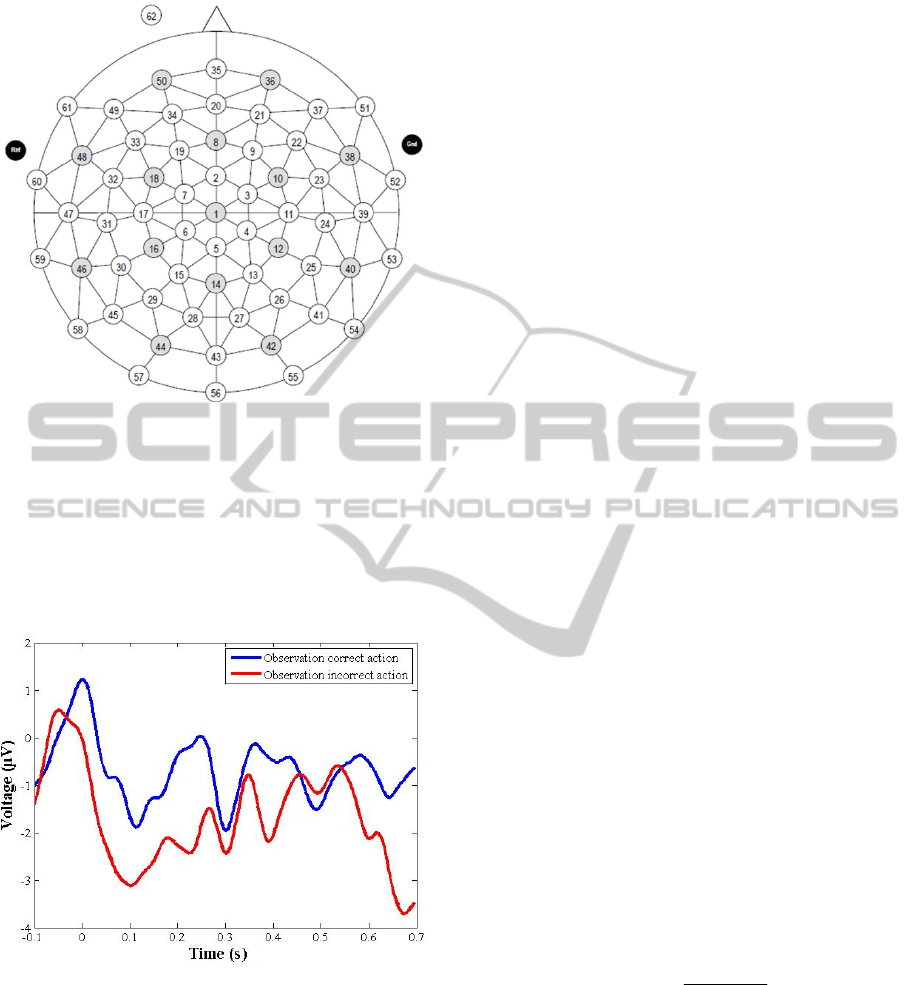
Figure 2: Placement of electrodes.
The experimental session involved 8 runs of 100
trials of the task and the observations of correct or
incorrect responses were averaged over a 800ms
epoch (baseline [-100 , 0] ms before response) (Fig.
3). This procedure is necessary in order to
discriminate the ERP signal from noise (brain
activity that is not relevant to the task).
Figure 3: Example of ERP signals from observation of
correct (blue line) and incorrect action (red line).
A time window, starting at -6 msec and ending at
700 msec (corresponding to 176 samples) after the
response, was selected for analysis. A total of 32×47
= 1504 ERP recordings were available for analysis.
From the available recordings, 16×47=752
recordings corresponded to observation of correct
actions and the rest 16×47=752 recordings
corresponded to observations of incorrect actions.
2.2 Proposed Methodology
The proposed methodology aims to classify feature
vectors that are extracted from the available raw data
into two classes of interest:
Observation of correct actions
Observation of incorrect actions
The methodology involves three tasks:
Feature calculation: in this task, a number of
quantitative features that provide a compact
description of the available raw data is
extracted. The features are organized in feature
vectors, also known as patterns.
Feature selection: this task aims to select a
subset of features from the original set of the
available features in order to achieve the best
classification performance.
Classification: in this task, the available
patterns, using the selected features, are
classified in the classes of interest.
Each task is described below.
2.2.1 Feature Calculation
Various features have be used to describe ERP
waveforms, such as first order statistical features
(Ventouras et al., 2011), features from frequency
domain (Liang et al., 2010), wavelet coefficients
(Aniyan et al., 2014). In this paper, it is proposed the
calculation of second order statistical features that
describe the morphology of an ERP waveform.
These features have been used widely in image
analysis in order to represent the texture of an image
(Haralick et al., 1973).
In particular, let
n
x
(
1, 2, ,176n
) denotes
a discrete time ERP recording,
min
min
n
n
x
x and
max
max
n
n
x
x . Then, the values of the ERP
recording can be quantized into
N levels by means
of the formula:
min
max min
0.5 1
n
n
xx
yN
xx
(1)
where
n
y is an integer between zero and 1N .
The co-occurrence matrix (Haralick et al., 1973),
d
C , with point distance d has dimensions
NN
and each element
,
d
ij
c
provides the probability of
co-occurring the values
i
y and
j
y
between two
sample points with distance
d. The co-occurrence
matrix can be used to provide 2
nd
order statistical
features related with the “texture” of a signal. From
BIOSIGNALS2015-InternationalConferenceonBio-inspiredSystemsandSignalProcessing
160

the co-occurrence matrix the following features can
be calculated (Haralick et al., 1973):
1.
Maximum probability entry:
1,
,
max
d
ij
ij
f
c
2.
Element difference moment of 2
nd
order:
2
2,
d
ij
ij
f
ijc
This feature has relatively low values when the
high values of C are near the main diagonal.
3.
Entropy:
3,,
log
dd
ij ij
ij
f
cc
This is a measure of randomness, having its
highest value when the elements of
d
C are all
equal.
4.
Energy:
2
4,
d
ij
ij
fc
This feature has relatively low values when all
entries of co-occurrence matrix are equal. It
measures the uniformity of a signal.
5.
Homogeneity:
,
5
1
d
ij
ij
c
f
ij
This feature has relatively high value when the
values of co-occurrence matrix are concentrated
on the main diagonal.
In total, from each participant’s ERPs, 47×5=235
features were calculated.
2.2.2 Feature Selection
One of the most important tasks in a classification
application is the selection of a subset of features
from a (usually) large set of available features. If
non-relevant features or features that characterized
by low discriminatory power are selected, then the
classification accuracy will be negatively affected.
Additionally, reducing the number of features results
in faster execution time of the classification task,
making it possible to develop real time applications.
The feature selection methods can be grouped
into two broad classes: filter methods and wrapper
methods (Chandrashekar and Sahin, 2014). The
filter methods perform feature selection using a
criterion that is not dependent on the classifier to be
used later. The most well-known criteria are the
Pearson correlation coefficient (Guyon and
Elisseeff, 2003) and the mutual information (Sotoca
and Pla, 2010). On the other hand, the wrapper
methods use the performance of the classifier as a
criterion.
Having selected the criterion, the next step is to
determine the optimization strategy to be applied in
order to achieve the best value of the criterion with
respect to the available features. Several methods
have been proposed in the literature, from simple
ones like the sequential forward selection, sequential
backward selection, sequential floating forward
selection (Chandrashekar and Sahin, 2014), to more
advanced ones, such as genetic algorithms (Tsai et
al., 2013) or artificial immune networks (Yue et al.,
2008).
In this paper, a simple feature selection method
(Liu and Motoda, 1998), using as criterion the
Wilcoxon test (Montgomery and Rumger, 2003) was
applied. In particular, let
D be a matrix with Q rows
and
P columns. Each row corresponds to a feature
vector that is formed by concatenating all the feature
values from the 47 recordings of an observer. Each
column corresponds to a feature. In our case,
Q=32
and
P=235. Furthermore, let C be a vector with Q
elements, whose values belong to the set
1, 2
. If
the element of
C with index i has value 1
(respectively 2), then the
ith row of D corresponds to
observation of correct (incorrect) action. Finally, let
j
Z
denote the Wilcoxon score using the jth column
of
D and the vector C. Then, the feature selection
produces a vector of binary values
12
,,,
P
x
xxx
, where 1
i
x (respectively
0
i
x
) indicates that the feature i has been selected
(not selected) (
1, 2, ,iP
). The algorithm evolves
as follows:
Initialization:
o
1,1, ,1
P
f
,
0, 0, , 0
P
x
, 0k
o Calculate the Wilcoxon score
j
Z
for
each feature.
o Find the most significant feature:
:1
arg max
j
j
jf
pZ
o
0
p
f
,
1
p
x
o
1kk
while
kK
(K is the desired number of
features):
o For each i with 1
i
f , calculate the
mean value of cross-correlation,
i
, of
the
i
column of D with all previously
selected columns of
D :
IdentificationofObservationsofCorrectorIncorrectActionsusingSecondOrderStatisticalFeaturesofEventRelated
Potentials
161

1
:1
22
1
11
1
j
Q
qi qj
q
i
P
QQ
jx
j
qi qj
j
qq
DD
x
DD
(2)
o Get a weighted Z score:
1
ii i
WZ Z a
(3)
o Select the feature with the highest
weighted Z score
:1
arg max
j
j
jf
pWZ
o
0
p
f
,
1
p
x
o
1kk
The parameter a (
01a
) sets a weighting.
When a = 0, potential features are not weighted. A
value of a close to 1 outweighs the significance
statistic; this means that features that are highly
correlated with the features already picked are less
likely to be included in the output list.
2.2.3 Classification
The classification task aims to assign a feature
vector to one of a predefined number of classes.
There are two major types of classification
algorithms: unsupervised and supervised. The
unsupervised algorithms, also known as clustering
algorithms, group the available feature vectors into
clusters without prior knowledge of the true class of
each feature vector. Representative algorithms are
the k-means (Hartigan, 1975), fuzzy c-means (FCM)
(Bezdek, 1981), self-organizing maps (SOMs)
(Kohonen, 1982).
The supervised algorithms incorporate a training
phase, using feature vectors with known class labels,
which adjusts the parameters of the algorithms to
(sub)optimal values. After the training phase, the
algorithm can be used to classify feature vectors
with unknown class labels. The most widely used
supervised classification algorithms are the k-nearest
neighbour algorithms, the artificial neural networks
and the support vector machines (SVM)
(Theodoridis and Koutroumbas, 2009).
The SVM algorithm (Steinwart and Christmann,
2008) was incorporated in the present work, due to
the fact that it has been successfully applied to
various classification tasks in multidisciplinary
scientific fields. It is primarily an algorithm for
binary (two classes) classification problems, but it
can be extended to multiclass problems. Given a set
feature vectors with known class labels, the
algorithm finds the hyperplane, among all possible
hyperplanes, that has the maximum distance from
the closest feature vectors of the two classes. The
closest to the hyperplane feature vectors are called
support vectors.
The hyperplane is a linear decision boundary.
The SVM algorithm can be extended to use non-
linear decision boundaries by means of the so-called
kernels (Boser et al., 1992). One of the most widely
used kernels is the radial basis function (RBF)
kernel, with parameter
0
which is defined by
the following equation:
2
,
ij
ij
ke
dd
dd
(4)
where
,
ij
dd
denote two feature vectors. Obviously,
the RBF kernel is a multidimensional Gaussian with
variance
1/ 2
.
The performance of a classifier is usually
evaluated by means of a cross validation scheme
(Seymour, 1993), which involves the random
separation the available feature vectors into training
and testing sets. The training set is used in order to
estimate the parameters of the classifier (support
vectors in the case of SVM) and the testing set
provides a benchmark for evaluating its
performance. This process is repeated several times
and the average performance is calculated. One of
the most widely used forms of cross validation is the
k-fold cross validation, where the available feature
vectors are divided randomly into k equal sets. One
set is used for testing the classifier and the remaining
k-1 form the training set. The procedure is repeated
k times, each time using a different set for testing
purposes. One special case of the k-fold cross
validation is the leave-one-out (LOO) cross-
validation procedure, where each sets contains only
one feature vector (i,e. k = number of feature
vectors). Thus, each time one feature vector is left
out for testing and the remaining ones are used for
training. The LOO procedure was adopted in order
to evaluate the performance of the SVM classifier in
a reliable manner, taking into account the limited
number of cases available in the classes, and in the
same time avoid overtraining and achieving an
acceptable generalization in the classification.
3 RESULTS
As was mentioned before, 235 features were
calculated from each participant’s ERPs. The feature
selection algorithm was applied using the 32
BIOSIGNALS2015-InternationalConferenceonBio-inspiredSystemsandSignalProcessing
162

available feature vectors (16 feature vectors from
observations of correct actions and 16 feature
vectors from observation of incorrect actions). In
order to determine the number of features to be
selected (K), as well as the value of the weighting
factor a, the value of the parameter γ of the radial
basis function, the distance d between samples and
the number of quantization levels N, all the
combinations
,,,,
K
adN
, for K = 1, 2,…,10,
a = 0, 0.1, 0.2,…,1, γ = 0.5, 1.0, 1.5,…, 5, d = 1,
2,…,5 and N = 25, 50, 75, 100 were investigated.
For each combination, feature selection method and
the SVM classifier with the LOO approach were
applied. The best classification results were 81.3%
for Class 1 (observation of correct actions) and
87.5% for Class 2 (observation of incorrect actions),
providing total classification accuracy 84.4%. Table
I lists the results in the form of a confusion matrix.
Table 1: Confusion matrix.
Actual Class Predicted Class
Class 1 Class 2
Class 1
13 3
Class 2
2 14
The aforementioned results were obtained for
(K, a, γ, d, N) = (2, 0.8, 1, 1, 50). The selected
features were the entropy and uniformity of
electrode 24. Table II presents the mean value and
the standard deviation of each selected feature for
the two classes.
Table 2: Mean values and standard deviations in
parentheses of selected Features for the two classes.
Feature
Class
Class 1 Class 2
Entropy of electrode
24
4.66 (0.098) 4.47 (0.16)
Energy of electrode
24
0.012 (0.002) 0.017 (0.005)
As can be observed, the entropy is in average
slightly higher in Class 1 than in Class 2, which
means that the co-occurrence matrices of the ERPs
from observations of correct actions are in general
more uniform than the ones from observations of
incorrect actions. On the other hand, the energy is in
average slightly lower in Class 1 than in Class 2,
which also means that the co-occurrence matrices of
the ERPs from observations of correct actions are in
general more uniform than the ones from
observations of incorrect actions.
4 CONCLUSIONS
In this paper, the identification of observations of
correct or incorrect actions was studied by means of
event related potentials. A methodology using
statistical feature selection and the SVM algorithm
was applied. The proposed methodology reduced
significantly the initial large number of features,
providing satisfactory classification results.
ACKNOWLEDGEMENTS
The authors would like to thank Hein van Schie and
Ellen de Bruijn from the Nijmegen Institute for
Cognition and Information (NICI), The Netherlands,
for kindly providing the data of their experiments
and for their contribution to initial stages of the
research.
This research has been co-funded by the
European Union (European Social Fund) and Greek
national resources under the framework of the
“Archimedes III: Funding of Research Groups in
TEI of Athens” project of the “Education & Lifelong
Learning” Operational Programme.
REFERENCES
Aniyan, A. K., Philip, N. S., Samar, V. J., Desjardins, J. A.
& Segalowitz, S. J. 2014. A Wavelet Based Algorithm
For The Identification Of Oscillatory Event-Related
Potential Components. J Neurosci Methods, 233, 63-
72.
Bezdek, J.-C. 1981. Pattern Recognition With Fuzzy
Objective Function Algorithms, Plenum Press.
Boser, B. E., Guyon, I. M. & Vapnik, V. N. A Training
Algorithm For Optimal Margin Classifiers. 5th
Annual Workshop On Computational Learning Theory
- Colt '92, 1992. 144.
Chandrashekar, G. & Sahin, F. 2014. A Survey On Feature
Selection Methods. Computers And Electrical
Engineering, 40, 16-28.
De Bruijn, E. R. A. & Von Rhein, D. T. 2012. Is Your
Error My Concern? An Event-Related Potential Study
On Own And Observed Error Detection In
Cooperation And Competition. Front Neurosci.
Desmet, C., Deschrijver, E. & Brass, M. 2014. How Social
Is Error Observation? The Neural Mechanisms
Underlying The Observation Of Human And Machine
IdentificationofObservationsofCorrectorIncorrectActionsusingSecondOrderStatisticalFeaturesofEventRelated
Potentials
163

Errors. Social Cognitive And Affective Neuroscience,
9, 427-435.
Falkenstein, M., Hoormann, J., Christ, S. & Hohnsbein, J.
2000. Erp Components On Reaction Errors And Their
Functional Significance: A Tutorial. Biol. Psychol.,
51, 87–107.
Ferrez, P. W. & Millán, J. D. R. 2008. Error-Related Eeg
Potentials Generated During Simulated Brain-
Computer Interaction. Ieee Trans. Biomed. Eng., 55,
923–929.
Gratton, G., Coles, M. G. H. & Donchin, E. 1983. A New
Method For Off-Line Removal Of Ocular Artifact.
Electroencephalogr. Clin. Neurophysiol., 55, 468-484.
Guyon, I. & Elisseeff, A. 2003. An Introduction To
Variable And Feature Selection. Journal Of Machine
Learning Research, 3, 1157-1182.
Haralick, R. M., Shanmugam, K. & Dinstein, I. 1973.
Textural Features For Image Classification. Ieee
Trans. On Systems, Man And Cybernetics, 3, 610–621.
Hartigan, J. A. 1975. Clustering Algorithms, John Wiley
& Sons Inc.
Kohonen, T. 1982. Self-Organized Formation Of
Topologically Correct Feature Maps. Biological
Cybernetics, 1, 59-69.
Liang, P., Zhong, N., Lu, S. & Liu, J. 2010. Erp
Characteristics Of Sentential Inductive Reasoning In
Time And Frequency Domains. Cognitive Systems
Research, 11, 67-73.
Liu, H. & Motoda, H. 1998. Feature Selection For
Knowledge Discovery And Data Mining, Kluwer
Academic Publishers.
Millán, J. D., Rupp, R., M¼Ller-Putz, G. R., Murray-
Smith, R., Giugliemma, C., Tangermann, M.,
Vidaurre, C., Cincotti, F., Kubler, A., Leeb, R.,
Neuper, C., Muller, K. R. & Mattia, D. 2010.
Combining Brain-Computer Interfaces And Assistive
Technologies: State-Of-The-Art And Challenges.
Front Neurosci.
Montgomery, D. C. & Rumger, G. C. 2003. Applied
Statistics And Probability For Engineers, New Jersey,
John Wiley & Sons, Inc.
Newman-Norlund, R. D., Ganesh, S., Van Schie, H. T., De
Bruijn, E. R. A. & Bekkering, H. 2009. Self-
Identification And Empathy Modulate Error-Related
Brain Activity During The Observation Of Penalty
Shots Between Friend And Foe. Social Cognitive And
Affective Neuroscience, 4, 10-22.
Petrosini, L., Graziano, A., Mandolesi, L., Neri, P.,
Molinari, M. & Leggio, M. G. 2003. Watch How To
Do It! New Advances In Learning By Observation.
Brain Res Rev., 42, 252-264.
Ridderinkhof, K. R., Ullsperger, M., Crone, E. A. &
Nieuwenhuis, S. 2004. The Role Of The Medial
Frontal Cortex In Cognitive Control. Science, 306,
443-447.
Scheffers, M. K. & Coles, M. G. H. 2000. Performance
Monitoring In A Confusing World: Error-Related
Brain Activity, Judgments Of Response Accuracy,
And Types Of Errors. J Exp Psychol Hum Percept
Perform., 26, 141-151.
Seymour, G. 1993. Predictive Inference, New York,
Chapman And Hall.
Sotoca, J. M. & Pla, F. 2010. Supervised Feature Selection
By Clustering Using Conditional Mutual Information-
Based Distances. Pattern Recognition, 43, 2068-2081.
Steinwart, I. & Christmann, A. 2008. Support Vector
Machines, New York, Springer.
Theodoridis, S. & Koutroumbas, K. 2009. Pattern
Recognition, Academic Press.
Tsai, C.-F., Eberle, W. & Chu, C.-Y. 2013. Genetic
Algorithms In Feature And Instance Selection.
Knowledge-Based Systems, 39, 240-247.
Van Schie, H. T., Mars, R. B., Coles, M. G. H. &
Bekkering, H. 2004. Modulation Of Activity In
Medial Frontal And Motor Cortices During Error
Observation. Nat Neurosci., 7, 549-554.
Ventouras, E. M., Asvestas, P., Karanasiou, I. &
Matsopoulos, G. K. 2011. Classification Of Error-
Related Negativity (Ern) And Positivity (Pe)
Potentials Using Knn And Support Vector Machines.
Comput Biol Med., 41, 98-109.
Vi, C. T., Jamil, I., Coyle, D. & Subramanian, S. 2014.
Error Related Negativity In Observing Interactive
Tasks. 32nd Annual Acm Conference On Human
Factors In Computing Systems. Toronto Canada.
Yue, X., Mo, H. & Chi, Z.-H. 2008. Immune-Inspired
Incremental Feature Selection Technology To Data
Streams. Applied Soft Computing, 8, 1041-1049.
BIOSIGNALS2015-InternationalConferenceonBio-inspiredSystemsandSignalProcessing
164
