
Calculation of Jump Flight Time using a Mobile Device
Ivan Miguel Pires
1,2
, Nuno M. Garcia
1,3
and Maria Cristina Canavarro Teixeira
4,5
1
Instituto de Telecomunicações, University of Beira Interior, Covilhã, Portugal
2
Altranportugal, Lisbon, Portugal
3
ECATI, Universidade Lusófona de Humanidades e Tecnologias, Lisbon, Portugal
4
UTC de Recursos Naturais e Desenvolvimento Sustentável, Polytechnique Institute of Castelo Branco,
Castelo Branco, Portugal
5
CERNAS - Research Centre for Natural Resources, Environment and Society, Polytechnique Institute of Castelo Branco,
Castelo Branco, Portugal
Keywords: Mobile Application, Algorithm, Jump Flight Time, Smartphone, Accelerometer, Physical Training, Vertical
Jump, Jumping, Mobile Devices, Pattern Recognition, Activity.
Abstract: This paper describes the research and implementation and validation method of a smartphone application
that calculates a vertical jump flight time, using the data collected from the accelerometry sensors in a
smartphone. To validate the algorithm results, a statistical number of experiments were performed. While
recording the experimental data with a commodity smartphone, a bioPlux Research device equipped with a
pressure sensor and with a tri-axial accelerometer was also used to estimate the time the user was airborne
while jumping, as a golden standard. The pressure sensor was placed in a jump platform built in the
laboratory, and a tri-axial accelerometer was placed on the user’s waist. The data collected by this device
were compared with data obtained by smartphone in order to validate the algorithm and make the necessary
corrections. The research data and the developed application are available for download and further research
in a free and public repository.
1 INTRODUCTION
Regular physical activity helps people avoid
sedentary lifestyles, one of the causes of several
physiological and health conditions that decreases
the quality of people’s lives (Griffiths, 2010). A
sedentary lifestyle is a class of activities such as
sitting, watching TV or driving, characterized by
little physical movement and low energy
expenditure (Tremblay et al., 2010).
While the pervasive use of technology may
contribute to facilitate a sedentary lifestyle, because
technology is increasingly used on the move and
everywhere, by the use of devices such as
smartphones, notebooks and other portable devices,
technology may also be viewed as an ally to help
monitor and train healthy lifestyles, supporting
applications that stimulate the user to perform
physical activities.
This paper describes the research on the design,
implementation and validation of an application
whose purpose is to measure the time of flight of a
person during a vertical jump.
For the estimation of physical activities and
physical exercises such as vertical jumping some
people use specific devices equipped with
accelerometry sensors or others, such as cardio
activity sensors (Electro, 2014). Jumping is one of
the exercises that can be performed at home, with no
additional equipment that helps to break the
sedentary lifestyle vicious cycle.
A commodity smartphone was selected to host
this application because these devices already
include the necessary sensors for this task, and also
because smartphones are the largest growing
segment for handheld devices (Alexander, 2012).
The two platforms responsible for the largest
market share are Android operating system (owned
by Google) and iOS operating system (owned by
Apple) (Alexander, 2012). Smartphones usually
integrate various sensors to perform tasks that are
related to the use of the phone in a
telecommunications or multimedia-browsing
context. Yet some of the sensors can be used to
293
Pires I., Garcia N. and Canavarro Teixeira M..
Calculation of Jump Flight Time using a Mobile Device.
DOI: 10.5220/0005187502930303
In Proceedings of the International Conference on Health Informatics (HEALTHINF-2015), pages 293-303
ISBN: 978-989-758-068-0
Copyright
c
2015 SCITEPRESS (Science and Technology Publications, Lda.)

measure aspects of the human user activity. The
embedded accelerometer allows us to identify the
person’s various activities, such as running,
jumping, among others (Lau and David, 2010).
Some signal patterns for physical activities have
been already published (Lau and David, 2010, Das
et al., 2010).
Jumping is a common recreational or athletic
activity. Children, in their outdoor playing activities,
have many games that include jumps such as
jumping rope, jumping barriers or other activities.
For example, the jump flight time can be used to
infer the muscular strength of the athlete/user.
Regarding a user’s the muscular strength, jumping is
an easy task to perform as it does not require any
additional equipment such as a dynamometer, or
weights, because it relies on the weight of a person
and his/her leg muscles (and partially the torso
muscles) to carry out the activity (Jun et al., 2012).
The research regarding the jump time flight is
integrated on a larger research regarding the
measurement of energy expenditure of a smartphone
user. In this larger research, the jump flight time will
be used as a mean to assess the user’s fitness in
physical exercise, and will be recorded in its
personal log, allowing him/her to keep track of their
improvement and to set a new jump flight time goal
(Pires, 2012).
A jump consists of three stages, there are: take-
off, flight and landing (Linthorne, 2001, Quagliarella
et al., 2010). These stages can be identified by the
smartphone accelerometer, but due to the possibility
of movement of the smartphone in relation to the
user’s body, during the exercise, the gravity sensor
to reduce the value of the real gravity and
compensate the movements, improving the detection
of these stages. Thus, the jump acceleration data for
a valid jump should show three maxima points.
Several authors have reported different methods
to detect the peaks of accelerometry signals of the
movement (Palshikar, 2009, Zhang et al., 2010) and
thus to calculate the jump flight time, agreeing all on
the different flight stages and on the start and finish
phases of the jump flight time. The calculation of
jump flight time and peak detection is performed in
several phases. First, the algorithm is fed with data
received from the accelerometer. Second, the
magnitude vector is calculated every time data is
collected, and iteratively isolates the peaks to a
minimum of peaks (local maxima). Finally, if the
jump is valid, the time between the first minimum
point, which is between the first and second
maximum peaks, and the second minimum point
which is between the second and third maximum
peaks, will be calculated and this time will be
considered as the jump flight time (Quagliarella et
al., 2010).
When the sensed acceleration is 0 or
approximately 0, i.e., it is equal or approximately
equal to the acceleration of gravity of Earth, this
means that the person is either standing on the
ground, or is reaching the highest point in the air, or
is falling back on the floor (Quagliarella et al., 2010,
Enoka, 2008).
For validation and adjustment of the smartphone
algorithm, a secondary device named bioPlux
Research (Plux, 2010) was fitted with a tri-axial
accelerometer and a pressure sensor. The bioPlux
Research is a device that collects and digitalizes
signals from the sensors, with a sampling frequency
of 1kHz, and transmits them via Bluetooth to a
computer where the signals are shown, processed
and/or stored in real-time. The bioPlux Research
device was used as a golden standard device to
collect the secondary data with more accuracy to
validate the jump flight time calculated by the
algorithm. The pressure sensor was used to validate
the jump flight time, calculated by the algorithm in
the smartphone application, as it senses when the
user is placing its weight on the sensor, or otherwise,
the user is flying and not in contact with the ground.
The tri-axial accelerometer from the bioPlux
Research device was used to further allow
comparison and validation with the smartphone
accelerometer data.
This research aimed to estimate the correct jump
flight time with a confidence level of 95%, so a
statistical relevant number of experiments was
calculated and performed to allow the correct
calibration of the jump flight time algorithm
implemented in the smartphone application.
Thus, this research aims to describe the creation
of an application for mobile platforms (Android and
iOS) to carry out the calculation of the jump flight
time, and also the corrections made to the algorithm
as result of the validation when the results are
compared to those of a golden standard. The
application makes a comparison between the jump
flight time of the current jump and the jump flight
time of the last jump done, and keeps a history of all
jumps performed and its corresponding date and
time.
This introductory section presented the research
scope and goals, and its research framework. It also
presented briefly the means and methods used. The
next section will present the related work researched
by other authors. Section 3 will present the problem
and the materials and methods used for the research
HEALTHINF2015-InternationalConferenceonHealthInformatics
294

solution. In section 4, the application and
implemented algorithm are presented. Section 5
further discusses the research and presents its
results. Conclusions follow in section 6, thus ending
this paper.
2 RELATED WORK
Besides the application presented in this paper, there
are not many smartphone applications in this field.
There is some research that shows some
accelerometry patterns that can be used for different
types of activities by the user, such as running,
jumping and walking (Das et al., 2010). Although
few studies have been conducted to detect the types
of physical activity of the user, there are some
studies in progress, that refer to activities such as
running or jumping, aiming to establish standards
for accelerometry signals (Das et al., 2010).
Despite the few studies on this topic, several
studies were carried out in order to identify the
characteristics of a jump. These studies were used to
try to identify the time when people are not with
their feet on the ground during the jump (Palma et
al., 2008, Szmuchrowski et al., 2007). These
experiments use jumping platforms (Favre et al.,
2005, Júnior et al., 2011, Linthorne, 2001) with
people of different ages, while also use
accelerometry sensors to create the pattern of
acceleration signals for the jump.
According to (Quagliarella et al., 2010), a jump
is made up of three stages in which each user
performs different activities. These are:
• Stage 1: Preparatory stage for the jump, which
includes bending the legs and impetus to make
the leap;
• Stage 2: Stage related to the flight, which is the
time at which the user is suspended in air;
• Stage 3: Stage related to landing on the floor,
which encompasses all activities of returning to
the starting position (with their feet).
The aforementioned stages are detected by using
the accelerometry sensors’ data taking into account
the acceleration highest points of the same jump
after removing the value of the actual gravity using
for this a peak detection algorithm (Palshikar, 2009,
Zhang et al., 2010, Quagliarella et al., 2010).
If the original data of the accelerometer is used,
including noise and the effect of the Earth’s gravity,
the result is:
• During stage 1, the values of the magnitude
vectors for the collected data are above the value
for the Earth's gravity (9.81 m/s
2
);
• During stage 2, the values of the magnitude
vectors for the collected data are below the
Earth's gravity;
• And during stage 3, the values of the magnitude
vectors for the collected data are again above the
Earth's gravity.
Throughout this paper several experiments were
carried out in order to more clearly identify the
starting and ending points in the different stages of
the jump, as some authors do not share the same
ideas.
3 PROBLEM
Currently, in order to calculate the jump flight time
of a person, a force platform is used to estimate how
long the user is suspended in the air (Bonde-
Petersen, 1975),
The calculation of jump flight time using a
smartphone arose from the need to create a training
application that could be used in a simple manner as
a means to stimulate the user’s physical activity. The
larger research framework that integrates the jump
flight time application includes the use of the
accelerometer to measure the caloric expenditure of
the user, and the recording of such values in a web
platform. This framework also comprehends the
jump flight time application, which can be used to
monitor the user’s fitness while jumping. Although
jumping is an activity that only uses a subset of the
person’s muscular abilities, namely those of the legs
and partially of the torso, it is also one of the
simplest exercises that can be performed in a short
period of time and does not require additional
equipment. Furthermore, the accelerometers in the
smartphone are able to measure the time of the flight
with a reasonable precision.
While keeping a record of the user’s jump flight
time, the application allows the user to try to
improve the time of the jump. The jump should be
made vertically, and the user is instructed to hold the
smartphone immobile and close to the chest while
jumping (Favre et al., 2005, Linthorne, 2001, Palma
et al., 2008, Jun et al., 2012). The duration of the
jump flight stage is evaluated by analysing the
accelerometer data (Palma et al., 2008, Quagliarella
et al., 2010, Susana et al., 2007).
The identification of the airborne period is
somehow complex especially when using a mobile
CalculationofJumpFlightTimeusingaMobileDevice
295

device held in the user’s hand. The identification of
the several stages of the jump has additional
complexity, for example if the smartphone is
inadvertedly rotated during the jump (Mizell, 2003).
In order to minimize the movement of the
smartphone during the jump, the application screen
displays a warning with some rules that must be
followed by the user in order to create a valid jump.
If the stages of the flight are not clearly identifiable,
this means that maybe the jump rules weren’t
followed, and the jump is considered invalid.
The data obtained by the smartphone application
also varies with the age, weight, height, gender,
lifestyle or fatigue of the person who is performing
the jump. Therefore, it is not possible to compare the
data across users, and there is the need to implement
signal filtering to minimize the noise that can be
generated by the users particular conditions.
The jump flight time must be presented as simple
as possible by the application and it must be possible
for the user to make a comparison of all jumps
performed in the training sessions. The application
should be able to save all jump data so that the user
is able to check the evolution of his/her jump flight
times.
An algorithm was created from previous research
literature (Quagliarella et al., 2010). Yet the results
returned by the algorithm need to be validated by
comparing the obtained data to the data obtained by
a golden standard. The algorithm implemented in
this application was validated as described in the
following sections and a model was created to
minimize the error in the calculation of the jump
flight time. For this validation several experiments
were carried out. The user sample was formed by 10
healthy individuals, 3 female and 7 male, aged
between 20 and 35 years old, with weights between
45kg and 80kg and heights between 150cm and
170cm. The users performed vertical jumps in the
jump platform containing the pressure sensor while
keeping both the smartphone and an additional
accelerometer on the waist. The smartphone was
running the developed application and the pressure
and accelerometer sensors were connected to the
bioPlux Research device serving as golden standard
measurement device.
The algorithm results were compared with the
results obtained by the bioPlux Research device and
the algorithm was modified so its results can be as
close as possible the results from the golden
standard.
The final result of the algorithm is the jump
flight time statistically and scientifically valid for
helping to the detection of jumping activity.
4 APPLICATION
4.1 Application Construction and
Development
Two applications were developed for iOS and
Android smartphones, using its respective embedded
sensors to collect motion data.
Initially, a prototype was developed and tested
by different users comprehending different ages,
lifestyles, weights and heights. The prototype
allowed the development of the features that did not
require validation, such as user input interfaces,
application output, application communication with
the web servers and so on.
Finally, the application was designed as to have a
user-friendly design, with little user interaction. A 5
second delay was defined as the time between the
user click on the start button and the beep indicating
the user should jump. The user should use this delay
time to place the smartphone device on a static part
of the body to measure the jump flight time. The
measurement of the jump ends when the user presses
the stop button or 10 seconds after the initial beep.
All jumps are stored in a local database on the
device in order to check the progress of their jump
flight times.
The developed application has a start screen with
a start/stop button. The screen also shows the value
of previous jump (if there is a jump in local
database) and the state of the application (standby,
waiting or jumping). Several screenshots of the
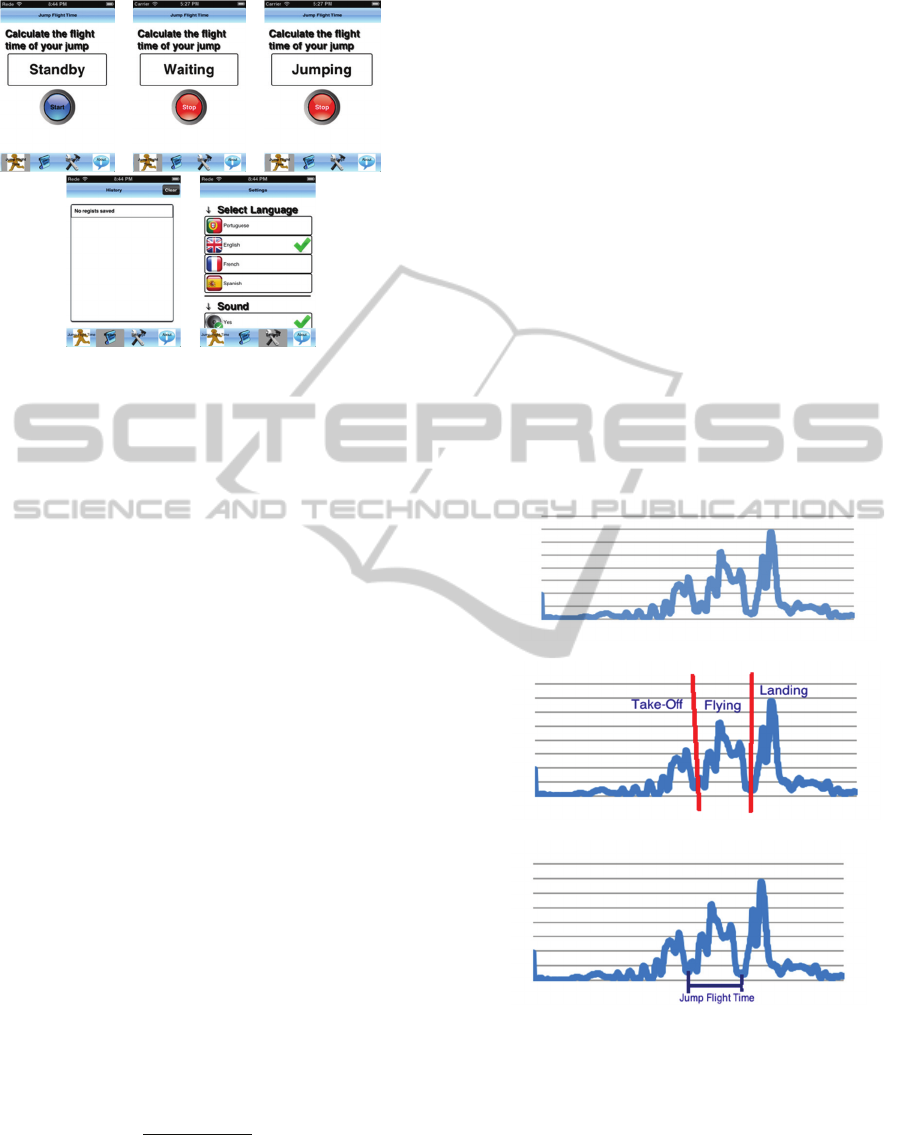
application are shown if figure 1 (a) through (e).
Figure 1 (a) shows the screen when the application is
idle and ready for a new jump recording. After
selecting the button to start to collect data to
calculate of jump flight time, the state of application
changes from standby to waiting (figure 1 (b)). After
the 5 second waiting time, the state of the
application changes to jumping (figure 1(c)).
The goal of the developed application is that the
user may be able to compare his/her jumps in order
to improve them. Thus, it is expected that this
application motivate the user to try to improve
his/her jump times. The application implements a
screen that shows the user’s jumps over time. This
screen is shown in figure 1 (d).
This application has a multi-language
implementation, implementing Portuguese, English,
Spanish and French languages. This is customized in
the screen containing the configurable settings of the
application, visible in figure 1 (e). In this screen, the
user will also be able to activate or deactivate the
sound in the application.
HEALTHINF2015-InternationalConferenceonHealthInformatics
296
(a) (b) (c)
(d) (e)
Figure 1: Application sample screens. Screenshot (a)
shows the application start screen. Screenshot (b) shows
the application screen while waiting for the beep sound to
start collecting data of the jump. Screenshot (c) shows the
application screen while application is collecting the data
of the jump. Screenshot (d) shows the application history
screen. Screenshot (e) shows the application settings
screen used for changing the language and sound settings
in the mobile application.
In general, the main screen layout of the
application has very simple usage, consisting at a
large start/stop button to activate the sensors capture.
In the next section, the experimental tests done
for the construction of the mobile application are
presented.
4.2 Experimental Setup
In order to create the application presented in the
previous section, several experiments were
conducted to optimize the algorithm previously
created and based on what was described in the
literature. Initially, the algorithm detected the
maximum acceleration peaks in the all data collected
during the jump. If there are three highest peaks, the
jump flight time corresponds to the time between
two acceleration minimum points between these
three maximum acceleration higher peaks.
During the data collection, the application
calculates the value of acceleration/magnitude vector
of the movement (Felizardo, 2010), not considering
the effect of gravity, i.e., the movement resulting
value is calculated as shown in equation (1),
(1)
in which x, y, and z are the values returned by each
of the axes of the accelerometer. The values of the
magnitude vector/acceleration calculated are then
stored in a data structure for further computation
after the user has pressed the stop button or the
timeout period has occurred.
Authors such as (Favre et al., 2005, Linthorne,
2001, Quagliarella et al., 2010, Susana et al., 2007),
define the jump as composed of up to three
variations of the acceleration: a more pronounced
stage (the smallest) is the take-off stage,
corresponding to the stage in which the person bends
his/her legs and is still with his/her feet on the
ground; the following two changes correspond to the
time when the person performs the jump, giving the
lift of impulse, and finally, when the person gets
back with his/her feet on the ground. Thus, the
acceleration value increases when the user jumps
and when the user is falling to the ground, as it is
shown in the figure 2. Figure 2 (a) shows the raw
data plot with data collected during one jump, figure
2 (b) shows the three stages of the flight, and figure
2 (c) shows the interval that will be considered as
the flight itself.
(a)
(b)
(c)
Figure 2: Sample jump graph, showing the raw data plot
(a), the three stages of the jump (b), and the flight interval
(c). The Y-axis is linear and represents an arbitrary unit
returned by equation (1), related to the values returned by
the accelerometer sensor in the smartphone. The X-axis
represents sampling time, in a linear manner.
The data is processed to allow the location
(timestamp) of the highest peaks (local maxima),
and this is done recursively to obtain the three
CalculationofJumpFlightTimeusingaMobileDevice
297
maximum higher peaks of a jump and calculation of
the jump flight time, as follows:
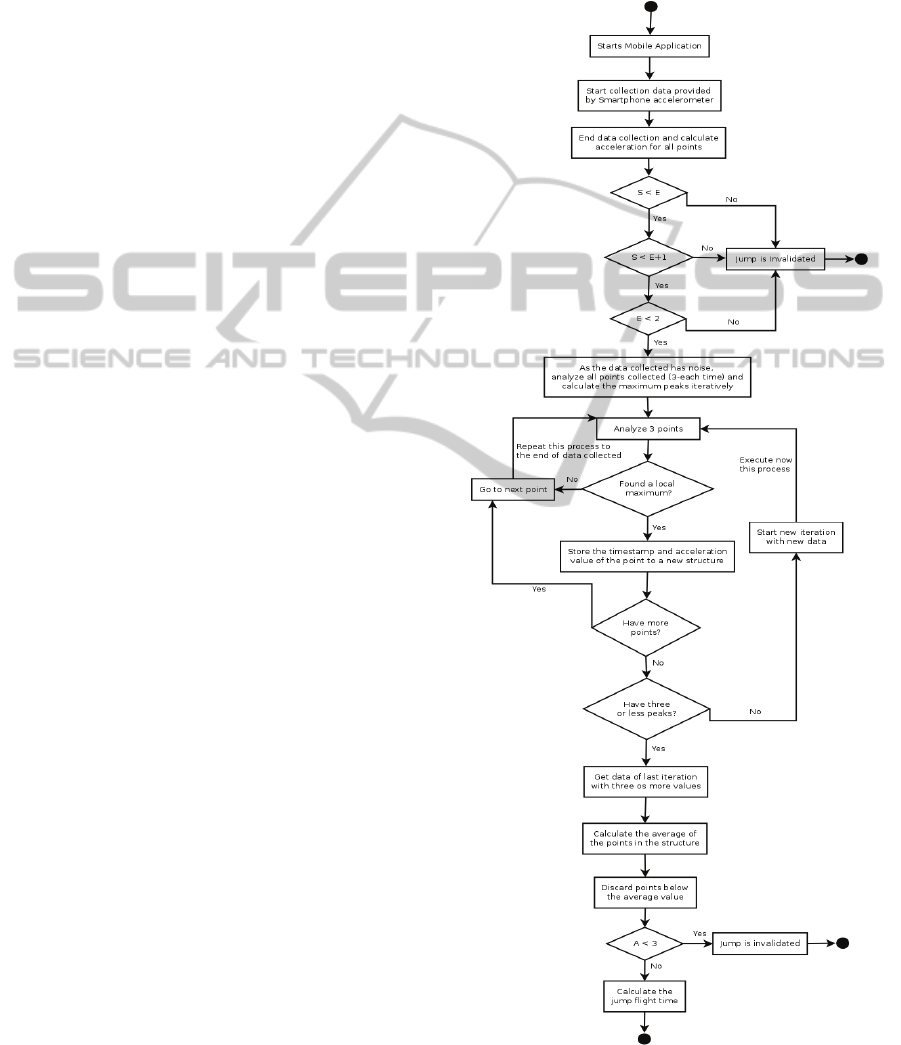
1. After the process of collecting data, the data is
validated according to some conditions in order
to validate or invalidate the jump, checking
whether the user jumped correctly or not. So in
order to validate the jump, the data collected is
checked to see if it passes the next following
conditions (one or more):
• The acceleration value of the initial time of
collection data (first value of acceleration
calculated from the accelerometer outputs) is
lower than the acceleration value of the final
time of collection data (last value of acceleration
calculated from the accelerometer outputs);
• The acceleration value of the initial time of
collection data is lower than the acceleration
value of final time of collection data plus one
(used to introduce an error margin of 1m/s
2
);
• The last condition tested is if the acceleration
value of the final time of collection data is lower
than 2m/s
2
.
If any of the above conditions is considered as
being false, the algorithm stops and the jump
activity is considered invalid;
2. When a local maximum is found in the series, its
location (timestamp) and acceleration value are
stored to a new data structure;
3. This process is repeated for the values in the new
data structure until there are three or less peaks
and leaving three or more peaks of the previous
execution;
4. If at the end of this process (if the average value
is between zero and one) the jump is invalidated,
it means that the user didn’t jump and the
algorithm stops;
5. If at the end of this process, more than three
peaks are found, the average value of these peaks
is calculated. The peaks whose value is below
average are discarded;
6. If after discarding the values, the number of
peaks is below three, the algorithm stops and the
jump is invalidated;
7. When the previous steps of the algorithm are
concluded, the three maxima discovered peaks
will coincide with the three highest values of the
series;
8. Finally, the algorithm searches the minimum
value between the first and second maximum
peaks and the minimum value between the
second and third maxima. The difference of the
locations (timestamps) of these two minima
shows the jump flight time.
Figure 3 describes the algorithm implemented in
the smartphone application, with an activity
diagram. The execution of the actions is iterative, as
referenced in the description of the algorithm and in
the end the jump flight time is calculated and
displayed, adjusted with a correction factor obtained
Figure 3: Activity diagram representing the algorithm
implemented in the smartphone application.
HEALTHINF2015-InternationalConferenceonHealthInformatics
298

by the validation phase and explained in the next
sections of this paper. In the activity diagram is used
some abbreviations, these are:
• A Î all points currently in the structure;
• E Î acceleration value of the end time of
collection data;
• S Î acceleration value of the initial time of
collection data.
The process of the calculation of jump flight time
done, when the jump is invalidated of jump flight
time is returned.
Yet, the values returned by the algorithm need to
be validated. Furthermore, we need to calibrate the
measurement of the sensors, and for this, an
additional set of parallel measurements was taken.
4.3 Experimental Results
After the initial activities performed to create the
initial draft of the algorithm, other experiments are
performed with a pressure sensor and an
accelerometer connected to the bioPlux Research
device that returns the data in millivolts, and the
mobile device sensors (accelerometer and gravity
sensors) that return the data in m/s
2
. The calculation
and conversion of the units for the comparison
between different data was performed, obtained a
values of the 1G of the bioPlux Research device
equals to 1528.01734mV.
Thus, after creating the initial draft of the
application, a batch of sixty additional jumps was
made, recording both the data from the smartphone
accelerometer and the data from a pressure sensor,
placed in a platform over which the jumps were
performed. The number of jumps was defined
according to the task at hand, the calibration of the
pressure sensors and accelerometer of the bioPlux
Research device. The pressure sensor was connected
to the bioPlux Research device, returning a value of
zero or close to zero when the user was in flight, i.e.,
when the recorded values were very close to 0 in the
data obtained by the pressure sensor, the foot of the
user isn’t on the ground and, therefore, this time the
user is in the flying stage of the jump.
After completion of the sixty jump experiments,
the comparison between the graphs of the data
achieved by the various sensors was carried out.
Thus, it was found that there are some differences in
the jump flight time provided by the graphs of the
data of sensors connected to the bioPlux Research
device (accelerometer and pressure sensors) and the
graphs of the data of sensors of the smartphone
sensors (accelerometer without gravity, using
gravity sensor to remove real gravity from
Figure 4: Graph comparing jump flight time calculated by
the application in the smartphone and the time measured
by a pressure sensor connected to a bioPlux Research
device.
accelerometer values). In the figure 4 is showed a
graph with a comparison between the jump flight
time measured by the smartphone application and
the jump flight time measured by the data collected
with a pressure sensor connected to a bioPlux
Research device. In the most number of
experiments, the jump flight time measured by the
smartphone application is highest than a real jump
flight time measured by the pressure sensor.
The jump flight time presented in figure 2 (c)
shows that unless you're evading the real gravity to
the accelerometer data from the smartphone, the
acceleration values will be negative when
subtracting the value of terrestrial gravity (9.81
m/s
2
). If the values of acceleration, when subtracting
a real gravity from the acceleration calculated by
data collected in the smartphone accelerometer were
negative, the data would be recorded as the absolute
value of these values. Thus, the acceleration is 0
when it is equals to the Earth’s gravity. As a result,
the jump flight time is the time between instants in
which the acceleration is equal to zero, when
acceleration increases and decreases, between two
maximum peaks.
Figure 5 shows the data collected for a particular
jump. Figure 5 (a) shows a graph generated by the
data collected by the smartphone sensors and the
algorithm presents a jump flight time of 380
milliseconds. Figure 5 (b) is a graph generated by
the data collected by bioPlux research sensors
(pressure and accelerometer sensors) and the real
jump flight time has been calculated as having
duration of 336 milliseconds. Considering that the
measurement taken by the pressure sensor at the
bioPlux Research device is the golden standard, the
estimated error of the algorithm presented in
smartphone application is presented in equation 2.
(2)
200
300
400
500
600
0 102030405060
Jump Flight Time (Android)
Jump Flight Time (bioPlux)
CalculationofJumpFlightTimeusingaMobileDevice
299
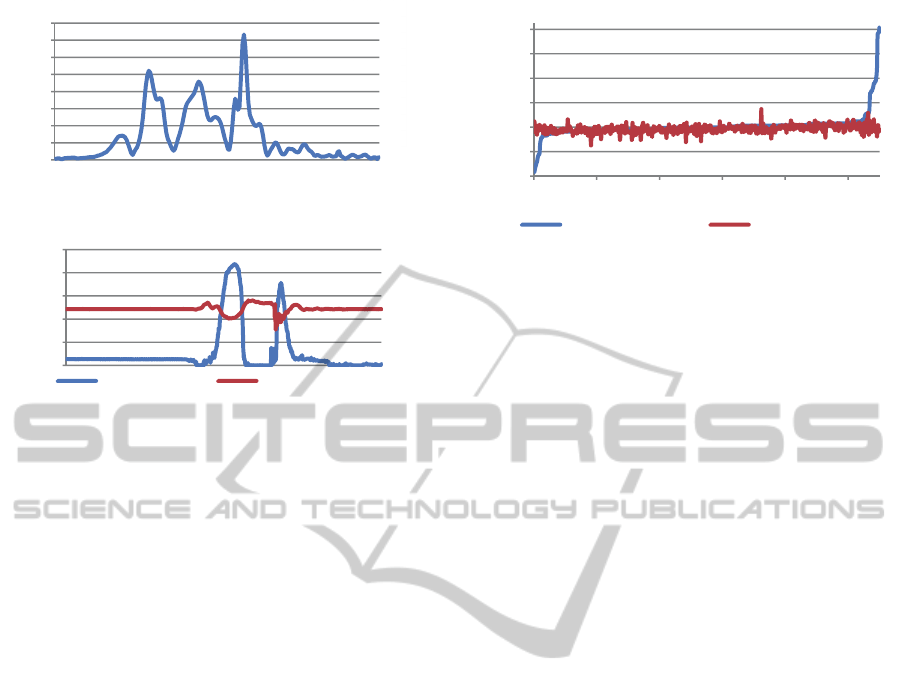
(a)
(b)
Figure 5: Jump Graph for data collected by smartphone
sensors (a), and data collected by bioPlux research sensors
(b). The Y-axis is linear and represents an arbitrary unit
returned by equation (1), related to the values returned by
the accelerometer sensor in the smartphone (figure a) or
the values returned by the accelerometer (red plot in figure
b). The X-axis represents sampling time, in a linear
manner.
In the sixty jump experiments which were carried
out, the errors were different in all jumps and the
dispersion of the errors, when comparing data
between value of jump flight time in smartphone
algorithm and bioPlux research sensors, is very high.
In a second step towards the validation of the
smartphone algorithm, and using the data from the
sixty jump experiments, it was necessary to define
the minimum number of experiments required to
have a confidence level of 95%.
Thus, to have a confidence level of 95% in order
to later be able to reduce experimental error, the
Student T-test was used to determine the minimum
number of experiments needed (Draper and Smith,
1998, He et al., 2007). It was found that the
minimum number of experiments required was 542
jump experiments, approximately.
Due to errors obtained during the sixty
experiments previously carried out and the highest
dispersion found, another set of 550 jump
experiments was conducted to attempt to determine
the experimental error with a confidence level of
95%. In figure 6 is showed a comparison graph
related to the jump flight time of various
experiments measured by the smartphone
application and by a pressure sensor connected to a
bioPlux Research device.
Figure 6: Graph related to the final validation, comparing
the jump flight times calculated by the smartphone
application and the jump flight times measured by the
pressure sensor.
All jump experiments were done by healthy
people, female and male, aged between 20 and 35
years, weights between 45kg and 80kg and heights
between 150cm and 170cm. These people performed
vertical jumps in the jump platform (with the
pressure sensor placed in it) and with the
smartphone placed on the waist, running the
developed application, and also wearing the bioPlux
Reseach accelerometer on the waist, attached to the
golden standard device. The data from the bioPlux
Reseach device, used as golden standard, was
collected at a sampling rate of 1kHz, and transmitted
wirelessly using Bluetooth to a computer nearby.
After carrying out the new experiments, a higher
dispersion of error data was equally found. The most
probable answer to this high dispersion is the highly
variable parameters for each person during the jump,
e.g. holding the smartphone in different ways. Yet,
within the same person, the variability is minimum.
According to (Carrillo, 1989, Margulies, 1968,
Selvakumar, 1982), the method of least squares
adapted to the collected sets of data was used to
reduce the experimental errors, returning an equation
applicable to the value previously calculated in the
algorithm that was already implemented in the
smartphone application.
As showed in figure 7, comparing the jump flight
time measured by the pressure sensor and a jump
flight time measured by the smartphone application,
the jump flight times calculated have a large
dispersion of data errors. So, this algorithm needs an
adaptation for show results with more accuracy. This
number of experiments, as referred above is the
minimum number of experiments needed for have
results with a confidence level equals to 95%. The
equation showed in the figure 7 allows reducing the
errors, if applied to the errors obtained by the
algorithm.
0
200
400
600
800
1000
1200
0 100 200 300 400 500
Jump Flight Time (Android) Jump Flight Time (bioPlux)
HEALTHINF2015-InternationalConferenceonHealthInformatics
300

Figure 7: Graph comparing the values obtained from the
bioPlux device and the values obtained from the
application using the smartphone sensors. The Y-axis
refers to the values measured by the bioPlux Research
device and the X-axis refers to the values measured by the
application in the smartphone. The solid line shows the
linear regression obtained for this data set.
So, the algorithm presented earlier for the
smartphone application was optimized by applying
the equation obtained by the method of least squares
of the value obtained by the algorithm, showed in
Figure 7, and the value presented to the user is the
value after applying equation 3,
(3)
in which y is the final value showed to the user in
the smartphone application and x is the value
obtained by the smartphone application with the
algorithm implemented before applying the equation
3.
As a result, in a jump with the smartphone
placed on the user’s waist, the implemented
algorithm obtained an example value equals to 421
milliseconds, which corresponds to the value of the
jump flight time. On the other hand, at same time,
the value measured with the data collected by the
sensors connected to the golden standard device is
386 milliseconds. This means that the error between
measurements is equal to 9.0674%, as showed in
equation 4.
.
(4)
So, the model represented by equation 3 is applied
and the value of jump flight time obtained is equals
to 386.7982ms, as showed in equation 5.
(5)
Thus, the error obtained is equal to 0.2069%,
proximately zero, as showed in equation 6,
.
(6)
As shown in the equations 4-6, after the adjustment
of the algorithm based on the method of least
squares created with the last experiments, a
verification of a low correlation between the results
of various sensors is difficult to explore the statistic
and scientific validation of the mobile application
developed. However, the method of least squares
adapted to the dataset of the values obtained
minimizes the errors. After the implementation of
the equation obtained in the algorithm, the
experiments were repeated and the errors obtained
by the algorithm are very small and the values of the
jump flight time obtained are very approximated to
the real values. Thus, the mobile application
developed can be considered valid for the major part
of the experiments, helping to improve the people’s
lifestyle, depending the results on the environmental
features.
5 DISCUSSION AND RESULTS
As discussed in previous sections, the jump flight
time will follow a certain pattern. If the jump does
not follow the expected pattern, it will be
invalidated. The jump can also be invalidated for
other reasons such as the resulting from changes of
the position of the smartphone during the jump.
Some errors may also be obtained due to the
differences in the sampling rates in the smartphone
and the sampling rate of the bioPlux Research
device. The bioPlux Research device has a 1kHz
sampling rate, i.e., the samples are recorded each
millisecond, and in the case of smartphone, due to its
multitasking capabilities, it is estimated that each
sample is collected at approximately every 10
milliseconds. Of course, when dealing with jump
flight times in the order of hundreds of milliseconds,
the lack of precision of the smartphone clock may
introduce an additional level of uncertainly and error
in the calculations.
The experiments were performed in the
laboratory, and an effort was made to control all the
variables as much as possible, particularly those
related to the jumping conditions of the human
subjects, namely, temperature, relative humidity
number of consecutive jumps, and time of the day
the experiments took place.
The ideal use application scenario would be to
place the smartphone so as not to move in a precise
position of the body (e.g., the user's waist) but this is
not always possible because of the movement the
user needs to do in order to jump.
The errors are very dispersed, because the
environmental conditions are difficult to control, and
as a result of this, the collected data has noise and
imprecisions. The major source of noise is the
CalculationofJumpFlightTimeusingaMobileDevice
301

accidental mobility of the smartphone during the
jump when placed on the waist of the user. The
major source of imprecisions is the uncontrollable
sampling ratio of the sensors in the smartphone
(approximately, 10kHz). The tests were done with a
set of volunteers, whose range of morph-
physiological characteristics are not ergodic when
representing the whole range of humans, and
therefore, it can only be claimed that the algorithm is
validated to the extent where the user shares some of
these characteristics.
So, despite the dispersion of the errors obtained,
the method of least squares was used to obtain an
equation that reduces the error of the calculated
value so that in 95% of cases, the mean percentage
error (MPE) is equal to 5.99%.
The application source code, the application
itself, and the data that was used in this research are
available at the ALLab (Assisted Living Computing
and Telecommunications Laboratory) MediaWiki
website (Signals, 2012).
6 CONCLUSIONS
In conclusion, it is possible to say that a smartphone
accelerometer can be used to develop methods to
control the user's physical activity, particularly to
calculate the jump flight time.
For this study, an algorithm that uses as input the
data from the triaxial accelerometer embedded in a
commodity smartphone was used. The algorithm
was further validated with a golden standard, in this
case, the bioPlux Research device equipped with a
triaxial accelerometer and a pressure sensor. A
relevant number of experiments was carried out and
a new adapted equation for the estimation of the
jump flight time was integrated in the algorithm
implemented in the smartphone application.
The developed application is available in the
Google Play and the iTunes online stores (links are:
https://play.google.com/store/apps/details?id=com.i
mspdev.jumptimecalc;
https://itunes.apple.com/us/app/jumptimecalc/id6548
11255?mt=8).
As future work, the researchers propose to
estimate also the jumping height using the data from
the built-in accelerometer of the smartphone. The
users will be able to visualize the relationship
between height and length of a jump, and relate this
to the user’s height, weight and physical fitness.
Moreover, because of the inherent differences in the
morphological and physiological muscle-skeleton
systems for different genders, a new algorithm will
be researched.
ACKNOWLEDGMENT
This work was supported by FCT projectPEst-
OE/EEI/L A0008/2013 (Este trabalho foi suportado
pelo projecto FCT PEst-OE/EEI/LA0008/2013).
The authors would also like to acknowledge the
contribution of the COST Action IC1303 –
AAPELE – Architectures, Algorithms and Protocols
for Enhanced Living Environments.
REFERENCES
Alexander, A. 2012. Smartphone Usage Statistics 2012
(Online). Infographics. Available: http://ansonalex.
com/infographics/smartphone-usage-statistics-2012-
infographic/ (Accessed 23rd May 2012 2012).
Bonde-Petersen, F. 1975. A simple force platform.
European Journal of Applied Physiology and
Occupational Physiology, 34, 51-54.
Carrillo, H. R. V. 1989. Least squares for different
experimental cases. Revista Mexicana de Física, 53,
597-602.
Das, S., Green, L., Perez, B. & Murphy, M. 2010.
Detecting User Activities using the Accelerometer on
Android Smartphones.
Draper, N. R. & Smith, H. 1998. Applied regression
analysis, United States of America, Wiley Series in
Probabily and Statistics.
Electro, P. 2014. Polar WearLink®+ transmitter Nike+ |
Polar USA (Online). Available: http://www.
polar.com/us-en/products/accessories/Polar_WearLink
_transmitter_Nike (Accessed 6th January 2014 2014).
Enoka, R. M. 2008. Neuromechanics of Human
Movement, United States of America, Human
Kinetics.
Favre, S., Najafi, B. & Aminian, K. 2005. A System For
Vertical Jump Evaluation Using Accelerometers and
Gyroscope. DiSS: Symposium du Département Inter-
facultaire de Sport et de Santé. Lausanne-Switzeralnd.
Felizardo, V. D. S. 2010. Validação do acelerómetro
xyzPlux para estimação do Gasto Energético com
aquisição de diversos parâmetros fisiológicos. Mestre
em Engenharia Electrotécnica e de Computadores,
Universidade da Beira Interior.
Griffiths, M. D. 2010. Trends in technological advance:
Implications for sedentary behaviour and obesity in
screenagers. Education and Health, 28, 35-38.
He, J., Zhao, H. & Fu, Q. Sample Size Analysis for
Confidence Interval Estimation of Performance
Metrics in ATR Evaluation. In: IEEE, ed. Radar
Conference, 2007 IEEE, 17-20 April 2007 2007
Boston, MA. IEEE, 585 - 589.
HEALTHINF2015-InternationalConferenceonHealthInformatics
302

Jun, Z., Jizhuang, F., JIE, Z. & WEI, Z. Kinematic
analysis of jumping leg driven by artificial muscles.
Mechatronics and Automation (ICMA), 2012
International Conference on, 5-8 Aug. 2012 2012.
1004-1008.
Júnior, N. G. B., Borges, L., Dias, J. A., Wentz, M. D.,
Mattos, D. J. D. S., Petry, R. & Domenech, S. C. 2011.
Validity of a new contact mat system for evaluating
vertical jump. Motriz, Rio Claro, 17, 26-32.
Lau, S. L. & David, K. Movement recognition using the
accelerometer in smartphones. In: IEEE, ed. Future
Network and Mobile Summit, 2010, 16-18 June 2010
2010 Florence. IEEE, 1 - 9.
Linthorne, N. P. 2001. Analysis of standing vertical jumps
using a force platform. American Journal of Physics,
69, 1198-1204.
Margulies, S. 1968. Fitting Experimental Data Using the
Method of Least Squares. Review of Scientific
Instruments, 39, 478.
Mizell, D. 2003. Using gravity to estimate accelerometer
orientation. Seventh Ieee International Symposium on
Wearable Computers, Proceedings, 252-253.
Palma, S., Silva, H., Gamboa, H. & Mil-Homens, P. 2008.
Standing jump loft time measurement - An
acceleration based method. Biosignals 2008:
Proceedings of the First International Conference on
Bio-Inspired Systems and Signal Processing, Vol Ii,
393-396.
Palshikar, G. K. 2009. Simple Algorithms for Peak
Detection in Time-Series. Proc. 1st Int. Conf.
Advanced Data Analysis, Business Analytics and
Intelligence (ICADABAI2009). Ahmedabad.
Pires, I. M. S. 2012. Aplicação móvel e plataforma Web
para suporte à estimação do gasto energético em
atividade física. Master's Thesis, University of Beira
Interior.
Plux 2010. bioPlux research user manual, Lisboa, PLUX.
Quagliarella, L., Sasanelli, N., Belgiovine, G., Moretti, L.
& Moretti, B. 2010. Evaluation of standing vertical
jump by ankles acceleration measurement. J Strength
Cond Res, 24, 1229-36.
Selvakumar, C. R. 1982. Approximations to
Complementary Error Functions by Method of Leat
Squares. Proceedings of the IEEE (Online), 70.
Signals, A. 2012. Main Page - ALLab Signals (Online).
Available: http://allab.it.ubi.pt/mediawiki/.
Susana, P., Hugo, G., Hugo, S. & Pedro, M.-H. 2007.
Vertical Jump Flight Time Measurement: A New
Method Based on Acceleration Signals. 12th Annual
Congress of the ECSS. Jyväskylä, Finland.
Szmuchrowski, L. A., Ferreira, J. C., Carvalho, R. G. D.
S., Barroso, T. M. & Ferreira, R. M. Reliability of a
Flight Time Measurement Instrument During Vertical
Jump. XXV ISBS Symposium 2007, 2007 Ouro Preto
– Brazil.
Tremblay, M. S., Colley, R. C., Saunders, T. J., Healy, G.
N. & Owen, N. 2010. Physiological and health
implications of a sedentary lifestyle. Appl. Physiol.
Nutr. Metab., 35, 725-740.
Zhang, J., Zhou, X., Wang, H., Suffredini, A., Zhang, L.,
Huang, Y. & Wong, S. 2010. Bayesian Peptide Peak
Detection for High Resolution TOF Mass
Spectrometry. IEEE Trans Signal Process, 58, 5883-
5894.
CalculationofJumpFlightTimeusingaMobileDevice
303
