
Comparison of Power Consumption Reduce Effect of Intelligent Lighting
System and Lighting Control System Using Motion Sensors
Katsunori Onobayashi
1
, Yuki Sakakibara
1
, Hiromitsu Nakabayashi
1
, Mitsunori Miki
2
and Hiroto Aida
2
1
Graduate School of Engineering, Doshisha University , Kyoto, Japan
2
Department of Science and Engineering, Doshisha University, Kyoto, Japan
Keywords:
Motion Sensor, Power Consumption, Simulation.
Abstract:
Designed in accordance with conventional uniform lighting systems, lighting control systems that use motion
sensors allow lighting control per area because they only switch on the lights linked to the motion sensors.
However, further power consumption reductions can be possible using a dimmer control for individual lights
to supply the level of brightness desired by each worker (hereafter referred to as target illuminance) instead
of the per-area method. In the present study, we therefore conducted a comparative experiment with regard
to the power consumption of a lighting control system that uses motion sensors and a system that controls
the lighting for each worker (hereafter referred to as intelligent lighting system). The validity of the power
consumption reduction in offices where intelligent lighting system was introduced was determined using a
comparative simulation. A simulation was performed for various worker patterns in a mock-up of an actual
office environment to verify the validity of the proposed system. The simulation results showed the effective-
ness of the proposed method under all work patterns and thus indicated that the intelligent lighting system
saves more energy than the lighting control system that uses motion sensors.
1 INTRODUCTION
On March 11, 2011, Japan experienced the Great
East Japan Earthquake. As direct aftermath of the
said earthquake, many power plants shut down, and
power transmission facilities were damaged. Tak-
ing the Great East Japan Earthquake as an opportu-
nity, the insufficiency of electricity supply has been
highlighted in recent years. Japanese enterprises have
therefore been requested to implement wide-ranging
power-saving measures, and saving energy in office
buildings has become an important issue.
Energy consumed by lighting accounts for ap-
proximately 40% of the total power consumed in of-
fices in Japan(The Enegry Conservation Center, ).
Switching off lights that workers do not need or im-
plementation of energy savings by reducing illumi-
nation levels are believed to lead to reduction in the
overall power consumption in offices. For this reason,
an annually increasing number of offices have intro-
duced lighting control systems that use motion sen-
sors to control the switching off of lights not needed
by workers. In the same manner, we are currently
researching and developing a lighting control system
that provides the desired luminance of a worker at
any desired location and switches off or dims un-
necessary lights (hereafter, intelligent lighting sys-
tem)(Miki, 2007). By setting the luminous intensity
required by workers (hereafter, target illuminance)
in the illuminance sensors depending on the type of
work or their preference, obtaining the information
from the control PC, and performing dimming con-
trol, the target illuminance can be achieved with min-
imum power consumption. Moreover, by providing
a lighting environment that matches the respective
worker environments, comfort and intellectual pro-
ductivity are expected to improve(F. Obayashi, 2006).
Data from a field test that introduced the intelligent
lighting system in an actual office showed that many
workers require a target illuminance that is lower than
the illuminance specified in the Japan Industrial Stan-
dard(M. Miki, 2012). Results were obtained that
indicated that high levels of energy savings can be
achieved by introducing an intelligent system that can
provide the necessary illuminance at the desired loca-
tions(K. Ono, 2012),(Doshisha University, 2011).
The present study considers the energy savings of
a conventional uniform lighting as a benchmark and
334
Onobayashi K., Sakakibara Y., Nakabayashi H., Miki M. and Aida H..
Comparison of Power Consumption Reduce Effect of Intelligent Lighting System and Lighting Control System Using Motion Sensors.
DOI: 10.5220/0005191403340340
In Proceedings of the International Conference on Agents and Artificial Intelligence (ICAART-2015), pages 334-340
ISBN: 978-989-758-074-1
Copyright
c
2015 SCITEPRESS (Science and Technology Publications, Lda.)
examines the power consumption reduction achieved
from a widely used lighting control system that uses
motion sensors. It then examines the power consump-
tion reduction achieved from our researched and de-
veloped intelligent lighting system using the same
benchmark. In these two studies, we compare the
effectiveness in reducing power consumption by the
lighting control system that uses motion sensors and
by the intelligent lighting system. The validity of the
intelligent lighting system is verified by simulation.
We performed a test in a simulation environment by
employing various usage patterns because we assume
a variety of work patterns in an office.
2 LIGHTING CONTROL
SYSTEMS USING MOTION
SENSORS
2.1 Motion Sensor Overview
Motion sensors are devices that detect movement of
people and send signals when movement of people or
objects in the sensing area is detected.Using technolo-
gies such as infrared light, ultrasonic waves, or visi-
ble light, these sensors detect motions. When some-
one or something with a temperature different from
the temperature of the surroundings enters the detec-
tion range, the detection method uses the temperature
difference for the detection. Generally, most systems
use infrared light to detect people; thus, we performed
our simulation based on infrared light motion sensors.
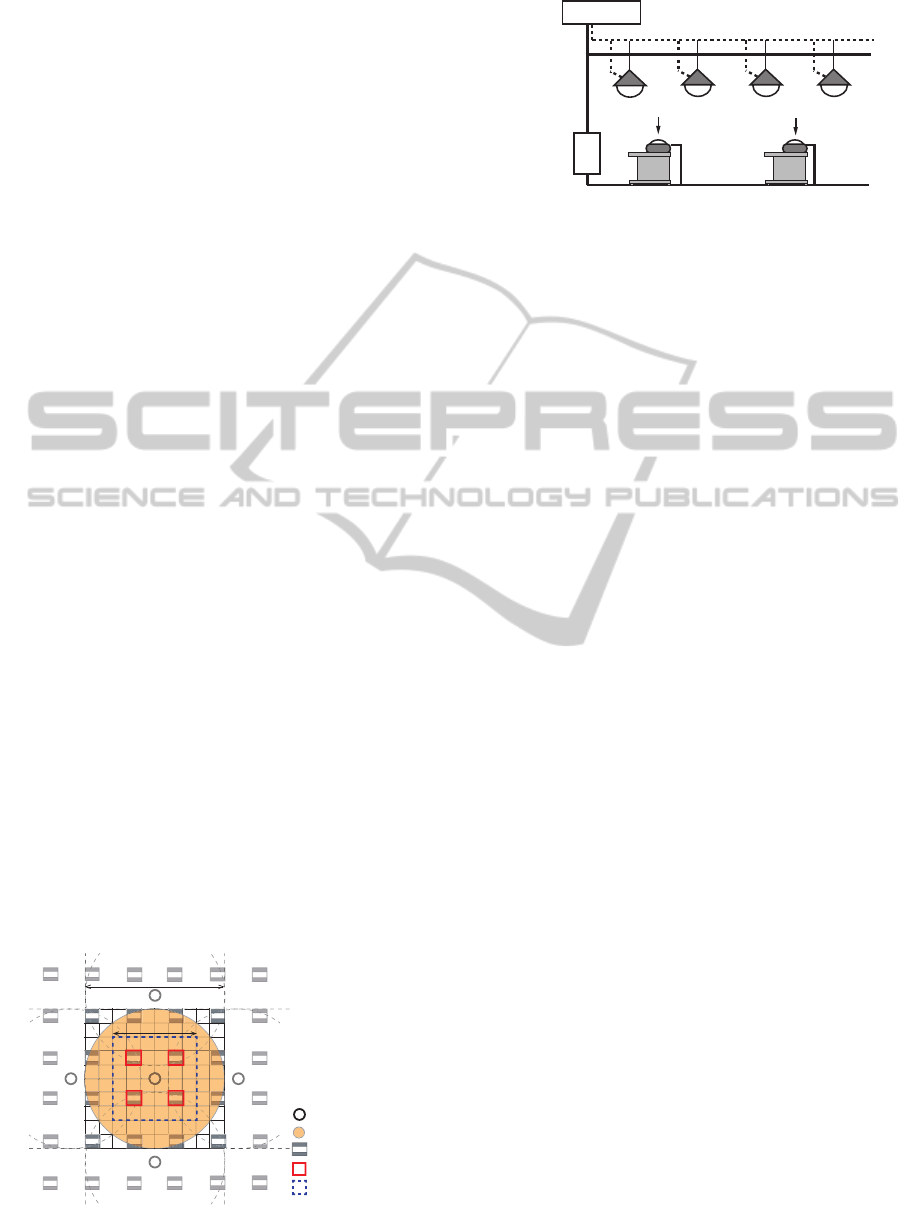
Motion sensors used in the Sumitomo Corporation
buildings or by Toshiba were arranged at a ratio of
one sensor for every 3.6 m2 with a detection range of
0.9-m high from the floor and 3.0-m radius, as shown
in Fig. 1. When workers sit, the desk surface is lit
with luminance (750 cd) that provides the minimum
illuminance (750 lx).
㻹㼛㼠㼕㼛㼚㻌㼟㼑㼚㼟㼛㼞㻌㼟㼑㼚㼟㼕㼚㼓㻌㼞㼍㼚㼓㼑
㻸㼕㼓㼔㼠
㻹㼛㼠㼕㼛㼚㻌㼟㼑㼚㼟㼛㼞㻌㼏㼛㼚㼠㼞㼛㼘㼘㼑㼐㻌㼘㼕㼓㼔㼠
㻹㼛㼠㼕㼛㼚㻌㼟㼑㼚㼟㼛㼞㻌㻌㼜㼘㼍㼏㼑㼙㼑㼚㼠㻌㼟㼑㼏㼠㼕㼛㼚㼟
㻹㼛㼠㼕㼛㼚㻌㼟㼑㼚㼟㼛㼞
Figure 1: Motion sensor diagram.
Electric meter
Network
Illuminance sensor
Lighting Fixture
Control computer
target point target point
Figure 2: Configuration of Intelligent Lighting System.
3 INTELLIGENT LIGHTING
SYSTEM
3.1 Configuration of Intelligent
Lighting System
The intelligent lighting system, as indicated in Fig.2,
is composed of lights equipped with microprocessors,
portable illuminance sensors, and electrical power
meters, with each element connected via a network.
Individual users set the illuminance constraint on
the illuminance sensors. At this time, each light re-
peats autonomous changes in luminance to converge
to an optimum lighting pattern. Also, with the intel-
ligent lighting system, positional information for the
lights and illuminance sensors is unnecessary. This is
because the lights learn the factor of influence to the
illuminance sensors, based on illuminance data sent
from illuminance sensors. In this fashion, each user’s
target illuminance can be provided rapidly.
The most significant feature of the intelligent
lighting system is that no component exists for inte-
grated control of the whole system; each light is con-
trolled autonomously. For this reason, the system has
a high degree of fault tolerance, making it highly reli-
able even for large-scale offices.
3.2 Adaptive Neighborhood Algorithm
using Regression Coefficient
(ANA/RC)
The control algorithm is a critical element for the con-
trol of an intelligent lighting system. The speed of
convergence to the target illuminance as well as its
accuracy depends largely on the lighting control al-
gorithm. As the best algorithm presently available
for lighting control, we have proposed an Adaptive
Neighborhood Algorithm using Regression Coeffi-
cient (ANA/RC)(S. Tanaka and M.Yoshikata, 2009),
which was developed by adapting the Stochastic Hill
ComparisonofPowerConsumptionReduceEffectofIntelligentLightingSystemandLightingControlSystemUsing
MotionSensors
335
Climbing method (SHC) specifically for lighting con-
trol purposes.
In ANA/RC, the design variable is the luminous
intensity of each lighting: the algorithm aims to min-
imize the power consumption while keeping the illu-
minance at the target level or above. It further enables
the control system to learn the effect of each light-
ing on each illuminance sensor by regression analysis
and, by changing the luminous intensity in response,
enables a quick transition to the optimum intensity.
The following is the flow of control by ANA/RC:
1. Each lighting lights up by initial luminance.
2. Each illuminance sensor transmits illuminance
information (current illuminance, target illumi-
nance) to the network. The electrical power meter
transmits power consumption information to the
network.
3. Each lighting acquires the information from step
2, and conducts evaluation of objective function
for current luminance.
4. Neighborhood is determined, which is the range
of change in luminance based on factor of influ-
ence and illuminance information.
5. The next luminance within the neighborhood is
randomly generated, and the lighting lights up by
that luminance.
6. Each illuminance sensor transmits illuminance in-
formation to the network. The electrical power
meter transmits power consumption information
to the network.
7. Each light acquires the information from step 6,
and conducts evaluation of objective function for
next luminance.
8. A regression analysis is conducted and the level
of influence is estimated.
9. If the objective function value is improved, the
next luminance is accepted. If this is not the case,
the lighting returns to the original luminance.
10. Steps 2‘9 are one search operation of the lumi-
nance value, which is repeated.
A search operation process (requiring about 2 sec-
onds) consists of steps 2) through 9) above: by iter-
ating this process, the system continues to learn how
the lighting affects the illuminance sensor measure-
ment until it realizes the target illuminance with min-
imum power consumption. Furthermore, by using the
influence level found in step 8) as a basis for the eval-
uation and generation of the next illuminance value,
the system can quickly optimize illuminance.
Next, we will see the objective function used in
this algorithm. The purpose of the intelligent lighting
system is to achieve each user’s desired illuminance,
and to minimize energy consumption. Thus, it can be
understood as an optimization problem in which each
light optimizes its own luminance. Following from
this, the luminance of each light is considered a de-
sign variable, under the constraint of the user’s target
illuminance, in resolving the problem of optimization
to minimize energy consumption. For this reason, the
objective function is set as in Eq. (1).
f = P+ w
n
∑
i=1
g
i
(1)
g
i
=
(It
i
− Ic
i
)
2
I
∗
≤ |It
i
− Ic
i
|
0 otherwise
(2)
P: Power consumption, w: Weight, Ic: Current
illuminance It: Target illuminance, n: Number of
target points
I
∗
: Threshold on illuminance difference
The objective function was derived from amount
of electric power P and illuminance constraint g
j
.
Also, changing weighting factor w enables changes
in the order of priority for electrical energy and illu-
minance constraint. The illuminance constraint is de-
cided so that a differencebetween current illuminance
and target illuminance within a threshold, as indicated
by Eq. (2)(N. Miyazaki, 2012).
4 POWER CONSUMPTION
CALCULATION METHOD
To calculate the objective function shown in Eq. (1),
power consumption is used. To calculate the objec-
tive function shown in Eq. (1), power consumption is
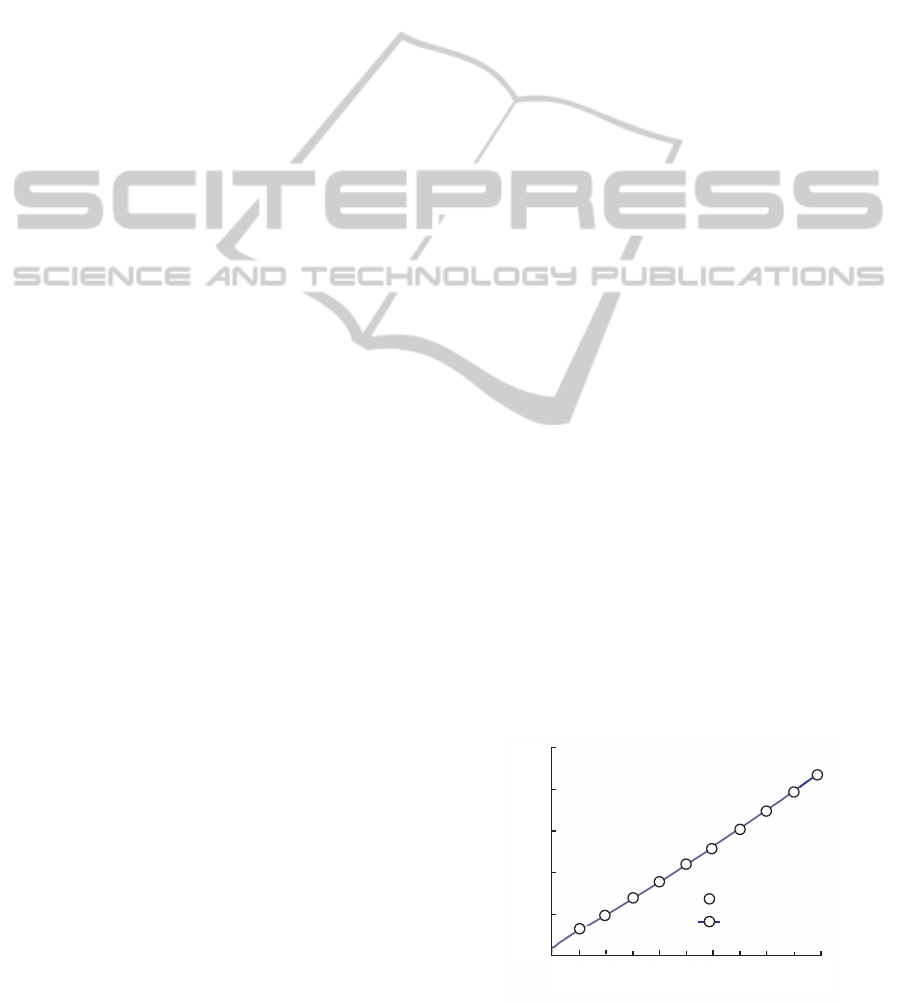
used. For this purpose, we used a Sharp Corporation
LED light in performing a preliminary experiment. In
the preliminary experiment, we confirmed that a rela-
tional expression between the power consumptionand
luminance exists, as shown in Fig. 3.
Figure 3: Relationship between luminance and electricity.
ICAART2015-InternationalConferenceonAgentsandArtificialIntelligence
336
This relational expression is linear, and we used it to
calculate the power consumption.
The desk surfaces were illuminated at a uniform light-
ing luminance of 750 lx or higher, and we consid-
ered the power consumption for this condition as the
benchmark.
5 EXPERIMENT THAT
COMPARES THE POWER
CONSUMPTION OF A
LIGHTING SYSTEM USING
MOTION SENSORS WITH
THAT OF THE INTELLIGENT
LIGHTING SYSTEM
5.1 Simulation Overview
We verified the effectiveness of power consumption
reduction for a lighting system using motion sensors
and the intelligent lighting system through a simula-
tion. To model the fluctuation in the number of work-
ers for a certain day, we created time periods when
people arrive at the office (arrival period), when peo-
ple are at work (working period), and when people
leave the office (departure period). We then assumed
a variety of work patterns for these periods. Three
work patterns were envisaged for the respective pe-
riods, and we performed verification experiments for
27 work patterns. If no one is present in the sensing
area of a particular sensor, the dimmer control is set
at 25% for that area so as not to cause visual stress for
any people present in the neighboring area. When this
situation continues for 5 min, the lights are switched
off.
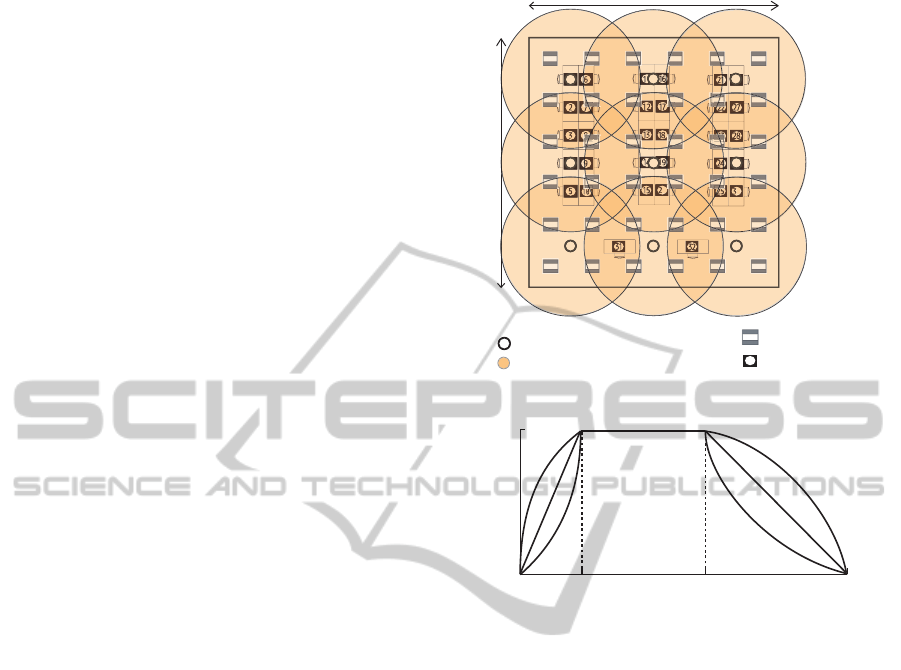
5.2 Simulation Environment
Verification that compares the power consumption of
a lighting system using motion sensors with that of
the intelligent lighting system by simulation. We cre-
ated a simulation environment representing an actual
office with 32 workers, as shown in Fig. 4. The
present simulation was based on an actual office with
a space of 10.8 m 10.8 m and used 36 white fluo-
rescent lights, which can be dimmed. For the system
that uses motion sensors, nine sensors were installed,
and for the intelligent lighting system, the work envi-
ronment was modeled using 32 illuminance sensors.
Furthermore, a variety of work patterns were con-
sidered because fluctuations in the number of work-
ers throughout the day affect the lighting control, and
㻹㼛㼠㼕㼛㼚㻌㼟㼑㼚㼟㼛㼞㻌㼐㼑㼠㼑㼏㼠㼕㼛㼚㻌㼞㼍㼚㼓㼑㻌
㻸㼕㼓㼔㼠
㻵㼘㼘㼡㼙㼕㼚㼍㼚㼏㼑㻌㼟㼑㼚㼟㼛㼞
㻹㼛㼠㼕㼛㼚㻌㼟㼑㼚㼟㼛㼞
㻝㻜㻚㻤㻌㼙
㻝㻜㻚㻤㻌㼙
Figure 4: Experimental environment.
Figure 5: Work patterns.
the power consumption will likely vary. Fig. refpeo-
ple shows a schematic diagram of the work patterns
throughout the day. The period from T
M
to T
A
indi-
cates the period when workers arrive at the office, that
from T
A
to T
L
represents the working hours, and that
from T
L
to T
N
is the period when workers leave the
office. Fig. 5 shows that three patterns were consid-
ered for the arrival and departure rates in the periods
when workers arrive and leave the office, respectively,
namely, inverted-U-shaped, linear, and U-shaped pat-
terns.
With regard to the varying presence rates during
the working period, we considered the three patterns
listed in Table. 1 The hour from 12:00 noon to 1:00
PM was considered to be lunch hour, and the lights
were assumed to be turned off.
A verification experiment was performed for 27
work patterns based on the above conditions.
5.3 Simulation Results
According to the working patterns shown in Fig. 5,
which was conducted continuously for a month ex-
cluding weekends, we performed a 20-day simula-
tion.For the working pattern throughout the day, we
ComparisonofPowerConsumptionReduceEffectofIntelligentLightingSystemandLightingControlSystemUsing
MotionSensors
337
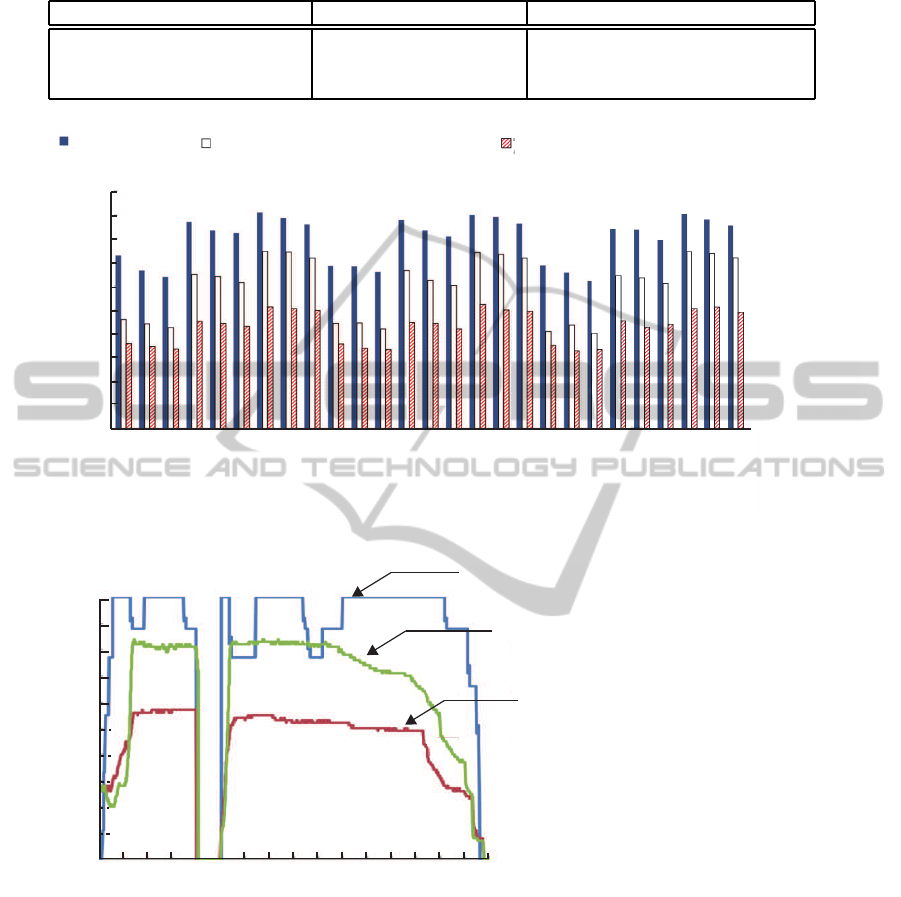
Table 1: Work patterns per period.
Arrival period(T
M
-T
A
) Working period(T
A
-T
L
) Departure period(T
L
-T
N
)
Inverted-U-shaped arrival rate Presence rate: 30% Inverted-U-shaped departure rate
Linear arrival rate Presence rate: 60% Linear departure rate
U-shaped arrival rate Presence rate: 90% U-shaped departure rate
㻼㼛㼣㼑㼞㻌㼏㼛㼚㼟㼡㼙㼜㼠㼕㼛㼚㻌㼞㼍㼠㼕㼛㼚㼇㻑㼉
㻹㼛㼠㼕㼛㼚㻌㼟㼑㼚㼟㼛㼞
㻔㼠㼍㼞㼓㼑㼠㻌㼕㼘㼘㼡㼙㼕㼚㼍㼚㼏㼑㻌㼎㼍㼟㼑㼐㻌㼛㼚㻌㼍㼏㼠㼡㼍㼘㻌㼘㼛㼓㻌㼐㼍㼠㼍㻕
㻵㼚㼠㼑㼘㼘㼕㼓㼑㼚㼠㻌㼘㼕㼓㼔㼠㼕㼚㼓㻌㼟㼥㼟㼠㼑㼙
㻵㼚㼠㼑㼘㼘㼕㼓㼑㼚㼠㻌㼘㼕㼓㼔㼠㼕㼚㼓㻌㼟㼥㼟㼠㼑㼙
㻔㼠㼍㼞㼓㼑㼠㻌㼕㼘㼘㼡㼙㼕㼚㼍㼚㼏㼑㻌㼛㼒㻌㻣㻡㻜㻌㼘㼤㻌㼒㼛㼞㻌㼍㼘㼘㻕
㻝 㻝 㻝 㻞 㻞 㻞 㻟 㻟 㻟 㻝 㻝 㻝 㻞 㻞 㻞 㻟 㻟 㻟 㻝 㻝 㻝 㻞 㻞 㻞 㻟 㻟 㻟
㼃㼛㼞㼗㻌㼜㼍㼠㼠㼑㼞㼚㼟
㻦
㻦㻻㼢㼑㼞㼠㼕㼙㼑㻌㼜㼑㼞㼕㼛㼐
㻝 㻝 㻝 㻝 㻝 㻝 㻝 㻝 㻝 㻞 㻞 㻞 㻞 㻞 㻞 㻞 㻞 㻞 㻟 㻟 㻟 㻟 㻟 㻟 㻟 㻟 㻟
㻝 㻝 㻞 㻟 㻝 㻞 㻟 㻝 㻞 㻟 㻝 㻞 㻟 㻝 㻞 㻟 㻝 㻞 㻟 㻝 㻞 㻟 㻝 㻞 㻟㻞 㻟
㻦㻭㼞㼞㼕㼢㼍㼘㻌㼜㼑㼞㼕㼛㼐
㻦㼃㼛㼞㼗㼕㼚㼓㻌㼜㼑㼞㼕㼛㼐
Figure 6: Average power consumption ration over 20 days.
㼀㼕㼙㼑㼇㼔㼉
㻼㼛㼣㼑㼞㻌㼏㼛㼚㼟㼡㼙㼜㼠㼕㼛㼚㻌㼞㼍㼠㼕㼛㼚㼇㻑㼉
㻌㻸㼕㼓㼔㼠㼕㼚㼓㻌㼏㼛㼚㼠㼞㼛㼘㻌㼟㼥㼟㼠㼑㼙㻌㼡㼟㼕㼚㼓㻌㼙㼛㼠㼕㼛㼚㻌㼟㼑㼚㼟㼛㼞㼟
㻵㼚㼠㼑㼘㼘㼕㼓㼑㼚㼠㻌㼘㼕㼓㼔㼠㼕㼚㼓㻌㼟㼥㼟㼠㼑㼙
㻔㼠㼍㼞㼓㼑㼠㻌㼕㼘㼘㼡㼙㼕㼚㼍㼚㼏㼑㻌㼎㼍㼟㼑㼐㻌㼛㼚㻌㼍㼏㼠㼡㼍㼘㻌㼘㼛㼓㻌㼐㼍㼠㼍㻕
㻵㼚㼠㼑㼘㼘㼕㼓㼑㼚㼠㻌㼘㼕㼓㼔㼠㼕㼚㼓㻌㼟㼥㼟㼠㼑㼙
㻔㼠㼍㼞㼓㼑㼠㻌㼕㼘㼘㼡㼙㼕㼚㼍㼚㼏㼑㻌㼛㼒㻌㻣㻡㻜㼘㼤㻌㼒㼛㼞㻌㼍㼘㼘䠅
Figure 7: Example of varying power consumption ration for one day.
considered the following: T
M
as 8:00 AM, T
A
as 9:00
AM, T
L
as 6:00 PM, and T
N
as12:00 midnight. Fig. 6
shows the average power consumption over 20 days
for this one-day work pattern both for the lighting
control system that uses motion sensors and for the
intelligent lighting system. On the other hand, Fig.
7 shows the power consumption under the same con-
dition for both control systems. Fig. 7 shows that
the work patterns in the arrival and departure periods
were linear, and the presence rate was 60It shows the
changes in the power consumption ratio for a particu-
lar day for this work pattern.
Furthermore, the overall average power consump-
tion in the experimental results for both control sys-
tems shown in Fig. 5 and the power consumption for
the uniform lighting are shown in Fig. 8.
Fig. 6 shows that the intelligent lighting system
was more effective in reducing power consumption
than the lighting control system that uses motion sen-
sors under all work patterns. Moreover, compari-
son of each individual work pattern showed the high-
est power consumption reduction of approximately
ICAART2015-InternationalConferenceonAgentsandArtificialIntelligence
338

!"
#!"
$!"
%!"
&!"
'!!"
()*
㼀㼥㼜㼑㻌㼛㼒㻌㼘㼕㼓㼔㼠㼕㼚㼓㻌㼏㼛㼚㼠㼞㼛㼘㻌
㻸㼕㼓㼔㼠㼕㼚㼓㻌㼏㼛㼚㼠㼞㼛㼘㻌㼡㼟㼕㼚㼓㻌㼙㼛㼠㼕㼛㼚㻌㼟㼑㼚㼟㼛㼞㼟
㻔㼠㼍㼞㼓㼑㼠㻌㼕㼘㼘㼡㼙㼕㼚㼍㼚㼏㼑㻌㼎㼍㼟㼑㼐㻌㼛㼚㻌㼍㼏㼠㼡㼍㼘㻌㼘㼛㼓㻌㼐㼍㼠㼍㻕
㻵㼚㼠㼑㼘㼘㼕㼓㼑㼚㼠㻌㼘㼕㼓㼔㼠㼕㼚㼓㻌㼟㼥㼟㼠㼑㼙
㻵㼚㼠㼑㼘㼘㼕㼓㼑㼚㼠㻌㼘㼕㼓㼔㼠㼕㼚㼓㻌㼟㼥㼟㼠㼑㼙
㼁㼚㼕㼒㼛㼞㼙㻌㼘㼕㼓㼔㼠㼕㼚㼓
㻔㼠㼍㼞㼓㼑㼠㻌㼕㼘㼘㼡㼙㼕㼚㼍㼚㼏㼑㻌㼛㼒㻌㻣㻡㻜㻌㼘㼤㻌㼒㼛㼞㻌㼍㼘㼘㻕
㻌㻼㼛㼣㼑㼞㻌㼏㼛㼚㼟㼡㼙㼜㼠㼕㼛㼚㻌㼞㼍㼠㼕㼛㼚
㼇㻑㼉
Figure 8: Average power consumption ration of the data in
Fig. 6.
42.3%, which was higher than that of the lighting con-
trol system that uses motion sensors.It was still 29.0%
higher at its lowest power consumption reduction. At
its highest, the work pattern was linear in the arrival
period, the presence rate during the working period
was 60%, and the pattern during the overtime period
had an inverted-U shape. At its lowest, the work pat-
tern had an inverted-U shape in the arrival period, the
presence rate during the working period was 90%, and
the pattern in the overtime period had an inverted-U
shape.
Fig.8 shows that the lighting control system that
uses motion sensors achieved a 21% power consump-
tion reduction compared with the 100% power con-
sumption in the conventional lighting. The reduction
by the intelligent lighting system was 41%, which de-
livered similar target illuminance as the system that
uses motion sensors. A 58% reduction in power con-
sumption was realized in the actual log data by the
intelligent lighting system that delivered the target il-
luminance.
6 DISCUSSION
Fig. 7 shows that even after the departure period, the
lighting control system that uses motion sensors did
not reduce the power consumption until all workers
have left because it controls the lighting on a per-area
basis. On the other hand, the intelligent lighting sys-
tem gradually decreased the power consumption after
the departure period. We can therefore conclude that
the intelligent lighting system, which controls the in-
dividual lights, is effective in reducing the power con-
sumption. With regard to the power consumption ra-
tio for a certain day, the intelligent lighting system,
which provides the same illuminance as the lighting
control system that uses motion sensors, consumes
less power than the lighting control system that uses
motion sensors.
Fig.6 also shows that the intelligent lighting sys-
tem saves more electricity under all work patterns
than the lighting control system that uses motion sen-
sors. Specifically, with a minimum number of work-
ers, its effectiveness in reducing power consumption
was markedly high compared with that of the light-
ing control system that uses motion sensors where all
office lights were lit.
The main cause for such difference in the power
consumption ratios depending on the lighting control
can be considered the difference in the average illu-
minance, as shown in Fig. 8 The main cause for such
difference in the power consumption ratios depend-
ing on the lighting control can be considered the dif-
ference in the average illuminance, as shown in We
can therefore state that in uniform lighting, many sen-
sors obtain an illuminance of 750 lx or higher. On the
other hand, we can state that to realize the target il-
luminance required by each worker in the intelligent
lighting system using the actual log data, the target il-
luminance is realized by the minimum required num-
ber of lights and the minimum required luminance
from these corresponding lights. On the other hand,
we can state that to realize the target illuminance re-
quired by each worker in the intelligent lighting sys-
tem using the actual log data, the target illuminance
is realized by the minimum required number of lights
and the minimum required luminance from these cor-
responding lights. The power consumption rate of the
intelligent lighting system has been shown to be less
than half that of the conventional uniform lighting.
7 CONCLUSION
The intelligent lighting system is more effective in re-
ducing power consumption under all work patterns
than the lighting control system that uses motion
sensors. The intelligent lighting system is therefore
shown to operate at reduced power consumption lev-
els compared with the lighting control system that
uses motion sensors.
ComparisonofPowerConsumptionReduceEffectofIntelligentLightingSystemandLightingControlSystemUsing
MotionSensors
339

REFERENCES
Doshisha University, M. G. S. S. I. (2011). Research
and development of energy efficient lighting sys-
tem by using autonomous distributed optimization
algorithms (fy2008-fy2010) final report. Number
20110000000875. New Energy and Industrial Tech-
nology Development Organizeation.
F. Obayashi, K. tomita, Y. H. M. K. H. S. H. I. M. T. H. Y.
(2006). A study on environmental control method to
improve productivity of office workers - development
of productivity evaluation method, cptop -. volume 53,
pages 447–450. Human Interface Symposium.
K. Ono, M. Miki, S. T. A. N. K. S. M. F. (2012). Con-
struction of intelligent lighting system using in-office
frames. volume 95, pages 549–588. The Institute of
Electronics, Information and Communication Engi-
neers.
M. Miki, H. K. H. Y. T. T. N. (2012). Construction of intel-
ligent lighting system providing desired illuminance
distributions in actual office environment. volume 94,
pages 637–645. The Institute of Electronics, Informa-
tion and Communication Engineers.
Miki, M. (2007). The consortium for smart office environ-
ment. volume 22, pages 399–410. The Japanese Soci-
ety for Artificial Intelligence.
N. Miyazaki, M. Miki, M. Y. Y. Z. (2012). Estimation using
mathematical programming of the illuminance sensor
position in the intelligent distributed control system.
volume 5, pages 481–482. Proceedings of the 74th
National Convention of Information Processing Soci-
ety of Japan.
S. Tanaka, M. Miki, T. and M.Yoshikata (2009). An
evolutional optimization algorithm to provide indi-
vidual illuminance in workplaces. pages 941–947.
2009. SMC 2009. IEEE International Conference on,
Proc:Systems Man and Cybernetics.
The Enegry Conservation Center, J. Characteristics of en-
ergy consumption of office.
ICAART2015-InternationalConferenceonAgentsandArtificialIntelligence
340
