
Epileptic Seizure Detection using Bipolar Singular Value
Decomposition
Mojtaba Bandarabadi
1
, Jalil Rasekhi
2
, César A. Teixeira
1
and António Dourado
1
1
CISUC, Center for Informatics and Systems of the University of Coimbra, Coimbra, Portugal
2
Department of Biomedical Engineering, Babol Noshirvani University of Technology, Babol, Iran
Keywords: Epilepsy, Seizure Detection, Singular Value Decomposition, Coherency, Synchronization, Bipolar
Electroencephalogram.
Abstract: We propose a robust method for automated detection of epileptic seizures using intracranial
electroencephalogram (iEEG) recordings with two electrodes. The state-of-the-art seizure detection methods
suffer from high number of false detections, even when designed to be patient-specific. The solution
reported here aims to achieve very low false detection rate, while providing a high sensitivity. Two adjacent
iEEG recordings are subtracted from each other to make the bipolar iEEG signal. The values achieved from
singular value decomposition (SVD) of the bipolar iEEG signal are used as measure. A threshold is
subsequently applied on the measure. Results indicate robustness of the proposed measure for seizure
detection. The method is applied on 5 invasive recordings containing 54 seizures in 780 hours of
multichannel iEEG recordings. On average, the results revealed 85.2% sensitivity and a very low false
detection rate of 0.02 per hour in long-term continuous iEEG recordings.
1 INTRODUCTION
Epilepsy, the second common brain disorder is
mainly characterized by recurrent and abrupt
seizures. The highly coherent neural activities play
the central role in the development of epileptic
seizures, which usually last from seconds to minutes.
Electroencephalogram (EEG) recordings are
commonly used in the study of brain, its functions
and related disease (Rho et al., 2010). Long-term
continuous multichannel recordings produce huge
amounts of data, sometimes up to several hundred
megabytes for a single recording channel. Real-time
monitoring of the long-term continuous EEG
recordings by EEG experts (visual inspection) can
be impossible, whereas offline analysis can also be
very costly, tedious and tiresome. By automatically
labeling the seizure onsets, long term monitoring,
diagnosis and treatment can be highly facilitated.
Researchers and neurologists will just be required to
refer to the labeled EEG recordings. On the other
hand early seizure detection could improve the
living conditions of epileptic patients. Automatic
drug injection or brain stimulation method can be
triggered by adequately fast onset detection
algorithm to suppress oncoming seizure
(Bandarabadi et al., 2014c).
There are many existing seizure detection
algorithms. They usually seek to optimize one of
two competing goals; (1) fast seizure onset
detection; the real-time detection of epileptic
seizures without or with a negligible delay from
onset initiation (Shoeb et al., 2004; Meier et al.,
2008; Kharbouch et al., 2011; Bandarabadi et al.,
2014b), and (2) accurate seizure event detection: the
accurate labeling of the occurrence of seizures with
high sensitivity and specificity (Varghese et al.,
2009; Sharma et al., 2014; Adeli et al., 2007;
Acharya et al., 2011; Hassanpour et al., 2004). The
first approach is best suitable for closed-loop
therapeutic as well as for patient care systems, where
only onset detection delay times of few seconds can
be tolerated. The second approach is much
appropriate for offline labeling of recorded EEGs for
future studies, and can tolerate longer detection lags.
High number of false detections is the main
drawback of most current approaches, which makes
them unacceptable for clinical applications.
Furthermore they have been applied mainly on short
recordings, and have not been validated
satisfactorily for long-term continuous recordings
with several weeks length, including extensive
interictal periods.
In the framework of the EPILEPSIAE project
178
Bandarabadi M., Rasekhi J., A. Teixeira C. and Dourado A..
Epileptic Seizure Detection using Bipolar Singular Value Decomposition.
DOI: 10.5220/0005193401780183
In Proceedings of the International Conference on Bio-inspired Systems and Signal Processing (BIOSIGNALS-2015), pages 178-183
ISBN: 978-989-758-069-7
Copyright
c
2015 SCITEPRESS (Science and Technology Publications, Lda.)

(Klatt et al., 2012), the consortium has collected
long-term continuous intracranial/scalp EEG
(iEEG/sEEG) recordings of more than 275 patients.
The current database includes detailed information
about the epileptic seizures of all patients, such as
type, onset/offset time, propagation, and seizure
onset age. The recorded data of the patients was
visually inspected by epileptologist experts, a both
tedious and faulty process, requiring double checks.
Such a demand for robust automated method with
high sensitivity and very low false detection rate,
which would require the neurologist just to refer to
the detected epileptic seizures to extract extra
information, motivated our team to study and
develop new detection algorithms. We have recently
developed a new seizure detection method using
sub-band mean phase coherence (sub-band MPC)
(Bandarabadi et al., 2014a). The raw iEEG data of
two adjacent electrodes was first band-pass filtered
using forward-backward method to obtain desired
frequency bands. Subsequently, the mean phase
coherence (MPC) measure of each sub-band was
calculated. The proposed method could provide a
sensitivity of 79% with a low false detection rate of
0.05 h
-1
.
This paper makes two contributions. First, it
proposes a robust seizure detection method using
singular values extracted from space-differential
(bipolar) recordings to improve the parameters of
sensitivity and specificity. Second, it evaluates the
efficiency of proposed measure on long-term
continuous iEEG recordings that are longer than one
month.
2 METHODOLOGY
The methodology is based on singular values (SVs)
extracted from windowed bipolar iEEG signal, and
the phenomena of unique bipolar signal
manifestations during a seizure event. Figure 1
presents the block diagram of the proposed method
for automated seizure detection, including a manual
channel selection, a segmentation stage, building
bipolar iEEG, a singular value decomposition
(SVD), and a threshold box for decision-making.
Database
Two adjacent
electrodes
Segment into
2 seconds
Bipolar
signal
SVD
Threshhold
Figure 1: The block diagram of the detection algorithm.
2.1 Dataset Description
In order to evaluate the proposed method, we use
real iEEG data recorded using two adjacent
electrodes placed over the focal area, from European
database on epilepsy (Klatt et al., 2012). The five
candidate patients with refractory focal epilepsy
were monitored continuously for several days,
during their pre-surgical studies. Focal seizures are
localized to specific brain regions, while generalized
epileptic events may initiate and spread across the
whole brain tissue. The two electrodes are nearly
satisfactory when working with partial seizures,
however more electrodes should be considered for
the study of other seizure types.
Recordings were obtained with sampling rate of
1024 Hz at the epilepsy unit of the University
Hospital of Freiburg, Germany. Onset times, and
their initialization and spatial propagation on the
electrodes were marked by epileptologists by visual
inspection of iEEG recordings and using video
recordings of patients during their stay in hospital.
Information of both electrographic and clinical
onset/offset times is available in the database, and
electrographic onsets were considered here. Patient
characteristics are summarized in Table 1.
Table 1: Information for the 5 studied patients.
Patient ID
Gender
Patient age (y)
Onset age (y)
Localization of
seizures
a
Recording time
(h)
No. of seizures
Mean seizure
duration (s)
A F
29 10
RMT,RLT
183 9 82.3
B F
32 1
LMT
162.6 9 121.9
C F
11 3
RMT
155 14 122.7
D F
32 8
RBF,LMT,RMT
151.6 9 122.5
E F
18 6
L-T,L-F
127.8 13 86.5
Mean
24.4 5.6
780 54 107.1
a.
RMT/LMT (right/left mesial temporal lobe), RLT (right lateral temporal
lobe), RBF (right basal frontal lobe), L-T (left temporal lobe), L-F (left
frontal lobe).
2.1 Bipolar iEEG Signal
The iEEG recordings are technically bipolar by
nature, since they are recorded with reference to a
fixed electrode. Positioning of electrodes and
reference channels can both affect the nature of the
recorded signal (Nunez et al., 1997). By tradition
however, these channels are called monopolar, and
the difference of two monopolar channels, selected
physically in close proximity (in the range of few
EpilepticSeizureDetectionusingBipolarSingularValueDecomposition
179

millimeters), is known as bipolar. For sufficiently
close-by configurations, the bipolar signal may be
considered as an approximation of the tangential
component of brain’s electric field. In contrast to the
monopolar EEG, the bipolar approach is less
susceptible to artifacts (Aarabi et al., 2007). Bipolar
processing can remove common mode interferences
mounted evenly on two adjacent electrodes. These
common mode interferences may include power line
noise (50 or 60Hz and their harmonics) and
movement artifacts (EMG). Furthermore it provides
better spatial resolution in contrast to the monopolar
iEEG recordings (Srinivasan et al., 1996; Nunez et
al., 1997; Tang et al., 2007). Bipolar recordings
better reduce the volume conduction effects
compared to the monopolar recordings, by acting as
a high-pass spatial filter (Nunez et al., 1997).
Moreover, topographical variations invisible to
monopolar recordings can be identified using bipolar
schemes (Baranov-Krylov and Shuvaev, 2005).
Bipolar channels were derived by differencing two
immediately adjacent electrodes, selected from
candidate probe array on focal area. Arrays can be in
the form of grid, strip, or depth probes.
2.2 Singular Value Decomposition
SVD as a common computational tool employed in
signal processing and pattern recognition, acts as a
mathematical factorization of data matrices obtained
from the patients, to highlight the dominant
properties of their underlying patterns. The core idea
of SVD is to take a collection of data, find the
patterns having the highest correlation with that
data, and then sort these patterns in a descending
order based on their importance. In fact, SVD
decomposes data to its correlated parts, with the
larger singular values (SVs) corresponding to those
parts with more energy (Bandarabadi et al., 2010).
The process decomposes the original matrix M into
the product of three sparse matrices (1),
*
....mn mm mn nn
M
UV
(1)
where
is singular value matrix, U and V are left
and right singular vector matrices respectively. U
and V are orthogonal matrices, and
is a
rectangular diagonal matrix with its nonnegative real
elements sorted in a descending way (2).
1
0
, if
0
m
mn
0
12 m
(2)
The singular values (
i
) indicate the significance of
the corresponding left/right singular vectors. The
pair of singular vectors related to the highest SV,
contain more information about the dominant
patterns than other singular vector pairs (Hassanpour
et al., 2004). By highlighting the dominant epileptic
activities within a bipolar iEEG data, SVD can be
used as a tool for detecting epileptic events. In order
to apply SVD, the raw EEG data should be first
expressed in the form of a square matrix. Hankel
operator is a square matrix with constant skew
diagonals, and is employed here to build such a
matrix. Suppose
12
[, ,..., ]
n
x
xxX as a segment of
EEG signal, and n being a positive even integer.
Then the Hankel matrix of X can be written as (3).
1
2
2/2
3/21
/2 /2 1 1
...
...
...
n
n
X
nn n
H
xx x
xx x
xx x
(3)
Since the computational cost of SVD is high, the
iEEG signal is downsampled from 1024 to 512 Hz to
boost the computation time. The iEEG signal is
segmented into 2-sec windows with 50% overlap, to
provide feature samples every second. The length of
window is selected by a tradeoff between two
extremes: it should be long enough to cover the
trends related to brain’s current state, and short
enough to be considered as quasi-stationary. The
Hankel matrix of the bipolar iEEG is first built, after
which SVD is calculated to obtain the SVs.
Considering 2-sec windows having 1024 samples,
the Hankel matrix would have the size of 512*512
elements. The SVD operator will thus produce 512
SVs (
i
, i=1,…, 512), ordered in a descending way.
The main characteristic of an epileptic seizure is
the highly coherent activity of the neurons,
generating nearly the same electrical voltages by two
very close bunches of neurons. This highly coherent
and synchronous state during seizure events,
specifically prior to seizure termination (Schindler et
al., 2007a; Schindler et al., 2007b), leads to a
significant increase in the level of common mode
signal of the adjacent channels, taking more similar
waveforms. SVs represent the level and importance
of the energies contained within the correlated parts
of signal. As a result of excessive coherency during
seizure, the energy of the resulting bipolar signals
and their correlated parts will decrease. Figure 2
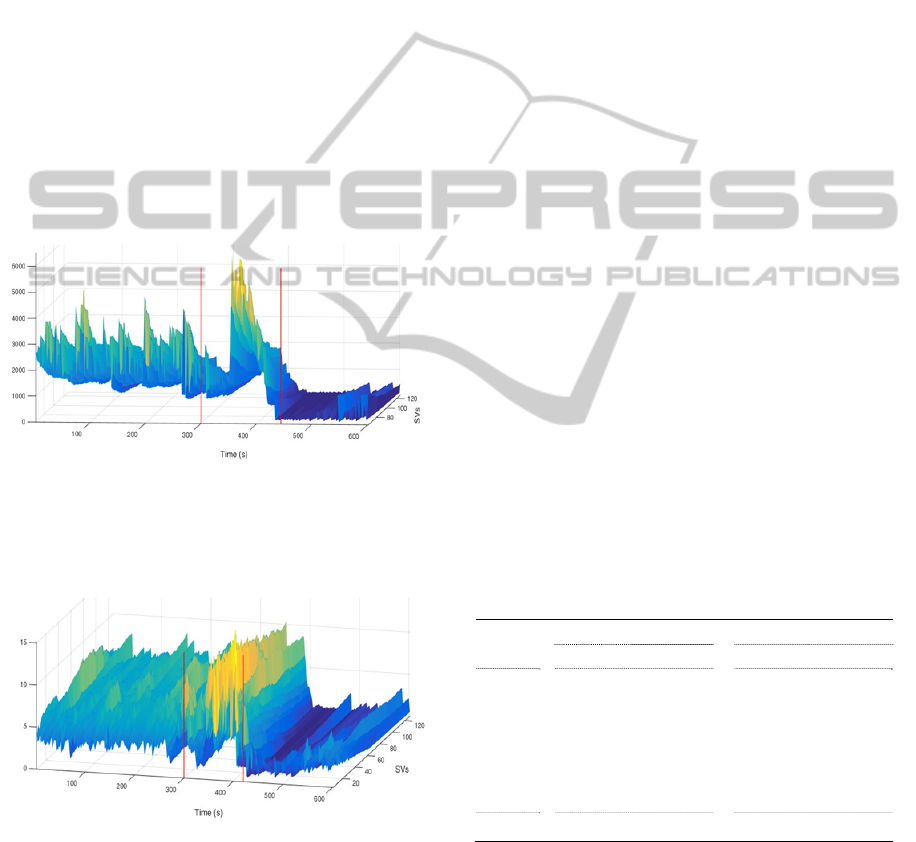
shows the extracted SVs of sample seizure.
BIOSIGNALS2015-InternationalConferenceonBio-inspiredSystemsandSignalProcessing
180
2.3 Preprocessing of Features
The average of each singular value for the first 60
minutes of recordings and for each patient was
calculated, and the SVs were normalized by dividing
to that average. The range of SVs (
i
, i=1,…, 512)
were equalized by this normalization (Figure 3).
Afterward, the 32 best performing SVs were
selected and average of their normalized values was
used as a single measure. Specifically the SVs from
9 to 40 performed better in our study for seizure
detection, and were considered to make a unique
measure.
Furthermore the coherent epileptic neuronal
activities last for several seconds, thus smoothing
the feature vector by a rectangular moving average
window of 4 consecutive samples, decreases the
likelihood of short coherent events that are not ictal
from reaching threshold. The smoothing would
greatly reduce the number of false alarms.
Figure 2: SVs (65-128) extracted from 10 minutes of
bipolar iEEG signal contains one seizure. Vertical red
lines indicate onset and offset times. The SVs first start to
increase by seizure development, and then suddenly
decrease approaching the seizure termination.
Figure 3: Normalized SVs of a sample seizure from
patient B. The range of SVs is equalized after
normalization. Vertical red lines indicate onset and offset
times.
The singular values mostly start to increase with
seizure initiation, while suddenly decrease once
seizures are well developed and approach their
termination. Although looking for increase in
singular values provide less detection delays, they
generate higher numbers of false alarms and lower
sensitivity values than looking for decrease in
singular values, when used for detecting seizure
events. Therefore the inverse of the measure,
obtained from average of normalized SVs from 9 to
40, was considered as a candidate measure to
highlight this decrease.
2.4 Alarm Generation
A threshold based classifier is used for the detection
of epileptic seizures. Threshold value is selected for
each patient separately, ranging from 1.5 to 2.5, and
are applied on the candidate feature. Upon the
measure passing of the threshold, an alarm will be
raised, after which further alarm generation will be
blocked for 4 minutes. This limitation guarantees the
raising of just a single true alarm per seizure.
3 RESULTS
Sensitivity (SS) and false detection rate (FDR) of the
raised alarms were used to evaluate the methods.
Sensitivity is the fraction of correctly detected
seizures within the total seizures, and the FDR value
is the number of false detections per time unit
(hour). Table 2 presents the results of seizure event
detection using two methods, first from bipolar SVs,
and the other using sub-band MPC method
(Bandarabadi et al., 2014a), obtained from same
patients and same channels.
Table 2: Results obtained for 5 studied patients.
ID
Bipolar SVD Sub-band MPC
SS
a
FDR
b
SS
a
FDR
b
A 100 0.02 78 0.06
B 100 0.01 78 0.05
C 71.4 0.08 71 0.09
D 66.7 0.01 66 0.02
E 100 0 100 0.04
Mean 85.2 0.02 79 0.05
a.
SS: Sensitivity of raised alarms in percent.
b.
FDR: False detection rate of raised alarms per hour
The results of bipolar singular values provide on
average, a sensitivity of 85.2% and a FDR of 0.02
per hour (16 false alarms in 780 h of recordings),
while the previously proposed method (sub-band
MPC) could averagely provide a sensitivity of 79%
EpilepticSeizureDetectionusingBipolarSingularValueDecomposition
181
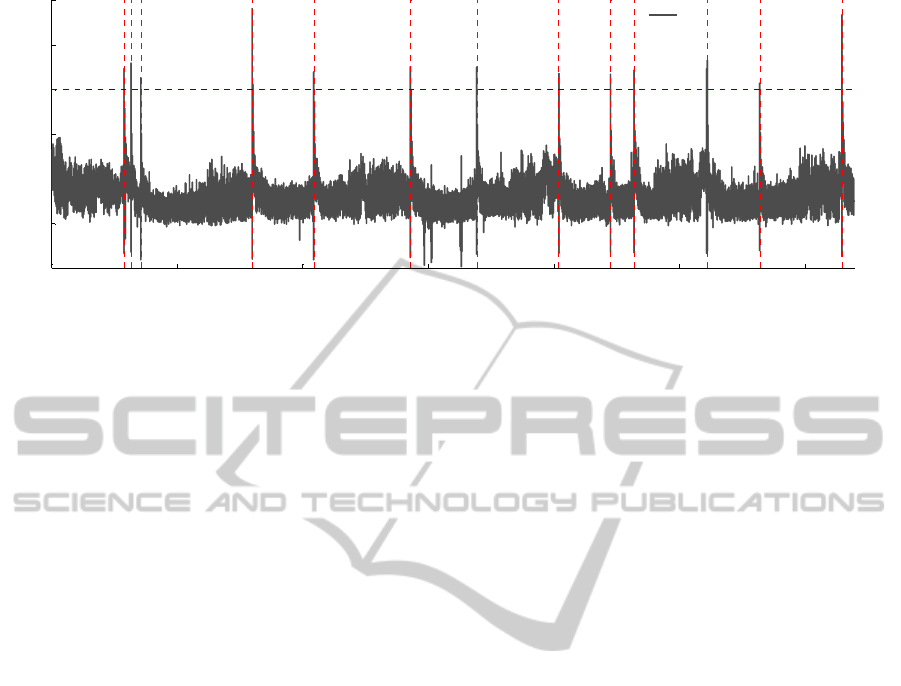
Figure 4: Proposed measure for entire recording of patient E. Black line is the measure, and the vertical dotted red lines are
seizure onsets. The optimum threshold value is 2 for this patient, which is indicated by horizontal dotted blue line.
and a FDR of 0.05 h
-1
. The results were achieved by
a tradeoff between SS and FDR. However, slightly
higher sensitivity could be reached by setting lower
threshold values, which lead to higher FDRs. Figure
4 illustrates the proposed measure extracted from
whole recording of patient E.
4 CONCLUSIONS
When two adjacent iEEG signals become
increasingly correlated, difference of those signals
(bipolar iEEG) will contain less energy, causing the
SVs of bipolar signal to decrease. Therefore the
observation of sudden decreases in the SVs would
coincide with seizure termination. Moreover,
according to the results, the SVs extracted from
bipolar iEEG signals were apparently robust to the
changes in the state of the iEEG data throughout the
patient’s daily life, producing just 18 false alarms in
780 hours of iEEG recordings. Furthermore, we
observed that patterns of coherency are recurring
evenly for all of the seizures for each particular
patient. This indicates that the build-up, propagation,
and termination of the seizures for a specific patient
follow a common neuronal mechanism.
Furthermore, channel selection affects
significantly the sensitivity parameter of proposed
algorithm. If the recording channels are not placed
close enough to the focus, the seizure spread may
not reach that channel, thus decreasing average
sensitivity. Overall, both placement and number of
selected iEEG channels can substantially affect
detection sensitivity and delays and had be taken
into consideration. In this work, the seizure focuses
were known. Additionally all patients were suffering
from partial epilepsy. Therefore the selection of two
channels on the focus was suggested to satisfactorily
detect seizure events.
ACKNOWLEDGEMENTS
This work was partially supported by EU FP7
211713 EPILEPSIAE Project and iCIS project
(CENTRO-07-0224-FEDER-002003). MB would
particularly like to acknowledge the Portuguese
Foundation for Science and Technology (FCT -
SFRH/BD/71497/2010).
REFERENCES
Aarabi, A., Grebe, R. & Wallois, F. 2007. A multistage
knowledge-based system for EEG seizure detection in
newborn infants. Clinical Neurophysiology, 118(12),
pp 2781-2797.
Acharya, U. R., Sree, S. V. & Suri, J. S. 2011. Automatic
detection of epileptic EEG signals using higher order
cumulant features. Int J Neural Syst, 21(5), pp 403-14.
Adeli, H., Ghosh-Dastidar, S. & Dadmehr, N. 2007. A
wavelet-chaos methodology for analysis of EEGs and
EEG subbands to detect seizure and epilepsy.
IEEE
Trans Biomed Eng,
54(2), pp 205-11.
Bandarabadi, M., Karami-Mollaei, M., Afzalian, A. &
Ghasemi, J. 2010. ECG Denoising Using Singular
Value Decomposition.
Australian Journal of Basic
and Applied Sciences,
4(7), pp 2109-2113.
Bandarabadi, M., Rasekhi, J., Teixeira, C. A. & Dourado,
A. 2014a. Sub-band Mean Phase Coherence for
Automated Epileptic Seizure Detection.
In: Zhang, Y.-
T. (ed.)
The International Conference on Health
Informatics.
Springer International Publishing.
Bandarabadi, M., Teixeira, C. A., Netoff, T. I., Parhi, K.
K. & Dourado, A. Robust and low complexity
algorithms for seizure detection. Engineering in
0 20 40 60 80 100 120
0
0.5
1
1.5
2
2.5
3
Time (hour)
Amplitude of feature
Preprocessed singular value
BIOSIGNALS2015-InternationalConferenceonBio-inspiredSystemsandSignalProcessing
182

Medicine and Biology Society (EMBC), 2014 36th
Annual International Conference of the IEEE, 26-30
Aug. 2014 2014b. 4447-4450.
Bandarabadi, M., Teixeira, C. A., Rasekhi, J. & Dourado,
A. 2014c. Epileptic Seizure Prediction Using Relative
Spectral Power Features.
Clinical Neurophysiology,
0), pp.
Baranov-Krylov, I. N. & Shuvaev, V. T. 2005. Effects of
selective visual attention in the parietal and temporal
areas of the human cortex using evoked potential data.
Neuroscience and Behavioral Physiology, 35(2), pp
159-164.
Hassanpour, H., Mesbah, M. & Boashash, B. 2004. Time-
frequency feature extraction of newborn EEG seizure
using SVD-based techniques. Eurasip Journal on
Applied Signal Processing,
2004(16), pp 2544-2554.
Kharbouch, A., Shoeb, A., Guttag, J. & Cash, S. S. 2011.
An algorithm for seizure onset detection using
intracranial EEG.
Epilepsy & Behavior, 22,
Supplement 1(0), pp S29-S35.
Klatt, J., Feldwisch-Drentrup, H., Ihle, M., Navarro, V.,
Neufang, M., Teixeira, C., Adam, C., Valderrama, M.,
Alvarado-Rojas, C., Witon, A., Le Van Quyen, M.,
Sales, F., Dourado, A., Timmer, J., Schulze-Bonhage,
A. & Schelter, B. 2012. The EPILEPSIAE database:
An extensive electroencephalography database of
epilepsy patients. Epilepsia, 53(9), pp 1669-1676.
Meier, R., Dittrich, H., Schulze-Bonhage, A. & Aertsen,
A. 2008. Detecting epileptic seizures in long-term
human EEG: a new approach to automatic online and
real-time detection and classification of polymorphic
seizure patterns.
Journal of Clinical Neurophysiology,
25(3), pp 119-31.
Nunez, P. L., Srinivasan, R., Westdorp, A. F., Wijesinghe,
R. S., Tucker, D. M., Silberstein, R. B. & Cadusch, P.
J. 1997. EEG coherency: I: statistics, reference
electrode, volume conduction, Laplacians, cortical
imaging, and interpretation at multiple scales.
Electroencephalography and Clinical Neurophysio-
logy,
103(5), pp 499-515.
Rho, J. M., Sankar, R. & Stafstrom, C. E. 2010.
Epilepsy:
Mechanisms, Models, and Translational Perspectives
:
CRC Press/Taylor & Francis Group.
Schindler, K., Elger, C. E. & Lehnertz, K. 2007a.
Increasing synchronization may promote seizure
termination: Evidence from status epilepticus.
Clinical
Neurophysiology,
118(9), pp 1955-1968.
Schindler, K., Leung, H., Elger, C. E. & Lehnertz, K.
2007b. Assessing seizure dynamics by analysing the
correlation structure of multichannel intracranial EEG.
Brain, 130(1), pp 65-77.
Sharma, P., Khan, Y. U., Farooq, O., Tripathi, M. &
Adeli, H. 2014. A Wavelet-Statistical Features
Approach for Nonconvulsive Seizure Detection.
Clinical EEG and Neuroscience, 45(4), pp 274-284.
Shoeb, A., Edwards, H., Connolly, J., Bourgeois, B., Ted
Treves, S. & Guttag, J. 2004. Patient-specific seizure
onset detection.
Epilepsy & Behavior, 5(4), pp 483-
498.
Srinivasan, R., Nunez, P., Tucker, D., Silberstein, R. &
Cadusch, P. 1996. Spatial sampling and filtering of
EEG with spline Laplacians to estimate cortical
potentials.
Brain Topography, 8(4), pp 355-366.
Tang, Y., Chorlian, D. B., Rangaswamy, M., Porjesz, B.,
Bauer, L., Kuperman, S., O'Connor, S., Rohrbaugh, J.,
Schuckit, M., Stimus, A. & Begleiter, H. 2007.
Genetic influences on bipolar EEG power spectra.
International Journal of Psychophysiology, 65(1), pp
2-9.
Varghese, G. I., Purcaro, M. J., Motelow, J. E., Enev, M.,
McNally, K. A., Levin, A. R., Hirsch, L. J., Tikofsky,
R., Paige, A. L., Zubal, I. G., Spencer, S. S. &
Blumenfeld, H. 2009. Clinical use of ictal SPECT in
secondarily generalized tonic–clonic seizures. Brain,
132(8), pp 2102-2113.
EpilepticSeizureDetectionusingBipolarSingularValueDecomposition
183
