
Implementation of a Realtime Event-location Analyzer
Junyeob Yim, Bumsuk Lee and Byung-Yeon Hwang
Dept. of Computer Science and Engineering, The Catholic University of Korea, Jongno-gu, Seoul, Republic of Korea
Keywords: Social Network Analysis, Data Mining, Natural Language Processing, Real-time Event-location Analyzer.
Abstract: A Social Networking Service (SNS) is a web-based platform that helps to build or to keep relationships
among people. The SNS platforms in early stage including Friendster and MySpace were implemented for
the desktop and laptop users. As more people access wireless internet using their mobile phones, SNS
platforms can also have some important features such as “real-time access” and “location information”.
These two features make it possible to let people share their activities, interests, and observations in real-
time at any places. Recently, most of SNS platforms including Twitter, Facebook, and Yelp use the location
information of users. Therefore, if we consider a SNS user as a sensor that reports its observations at a
specific location, it would be possible to detect events by analyzing their social contents. There are already
numbers of research on this topic have been published or still ongoing. Twitter has been widely used for
conducting the research because it has important three features which are required to detect an event: time,
location, and content. However, the most approaches struggle with detecting the location which is related to
an event correctly. In this paper, we introduce a system that detects an event with its location in real-time
based on increment of tweets that mention a specific location frequently. The result of performance
evaluation shows that the proposed system detects an event in real-time. We also improved the system
performance by reducing some noises from our system.
1 INTRODUCTION
A Social Networking Service (SNS) is an online
platform service that allows people share
information, and SNS Users expands their social
relation networks by communicating about their
interests to each other (Barbosa and Feng, 2010).
The number of users has been increased as web
accessibility has been improved with smart mobile
phone. More than 645 million people use Twitter,
one of the most popular SNS platforms, at the
moment of January 1, 2014, and they generate 58
million tweets every day. There are many research
projects have been conducting recently to use the
massive social data from the variety of SNS
platforms. Among them, Twitter has a distinguished
open network structure that allows a user to
subscribe another user’s tweets easily using the
Follower-Following relationship. The relationship
based on subscription on Twitter is relatively opened
compared to the request-accept relationship which is
used on Facebook or Instagram. This special feature
of Twitter lets people expand their social networks
in a short period of time and makes it easy to spread
information widely. Another important feature is
Tweet. Twitter users communicate each other with a
short message named Tweet, and it is limited to 140
characters. The limitation on length seemed like an
obstacle, but it turned into a big advantage. The most
people access Twitter on their mobile phone, and the
people are already familiar with the short text
message. Lee compared users’ posting behaviour
between blogs and Twitter. Twitter users post most
of their tweets during the day time about their life
events while the blog users write the articles mostly
during the night time (Lee, 2012). These features
made Twitter become popular than other SNS
platforms and made the users generate massive
social data which allows many researchers to
conduct their research using the data.
The contents on Twitter are mostly on the topic
of life events, new experiences, and information
sharing. A paper (Hong and Kim, 2011) classified
the contents on Twitter, and the major topics were
news articles, personal opinions/emotions, and
commercial advertisements. Among these topics, the
personal experience about an incident can be used to
detect an event. Previous approach detected an event
by observing the increase of quantity of Tweets
349
Yim J., Lee B. and Hwang B..
Implementation of a Realtime Event-location Analyzer.
DOI: 10.5220/0005193903490352
In Proceedings of the International Conference on Agents and Artificial Intelligence (ICAART-2015), pages 349-352
ISBN: 978-989-758-074-1
Copyright
c
2015 SCITEPRESS (Science and Technology Publications, Lda.)
about the event (Lee and Hwang, 2012). For
example, there was a research that detected the flu
epidemic by observing the social signal based on
quantity. In the research, they also pointed out the
location where the flu epidemic is confirmed. This
strategy maximizes the effectiveness at preventing
the flu if the system detects location in early stage.
An event consists of time, location, and content (Lee
et al., 2014). People who experience a special event
tend to share their experiences to others and many of
them do it through social media these days. Also,
people talk to others what they have heard. Thus, we
can use an individual on a social networking service
as a moving sensor that observes its environment
and generates signals to detect an event by analyzing
the social contents. In this paper, we propose a
system that detects an event in the real-world using
Twitter. Detecting an event has been designed to
detect any kinds of events based on the name of
locations. In addition, the proposed system has been
implemented based on the Apache Lucene Search
Engine and has a special feature that can detect the
names of the locations in Korea.
This paper is organized as follows: In the next
section, we explain the previous studies on event
detection systems which are helpful to remind you
about our research. In section 3, we present the
architecture and each module of the proposed
system. The results of performance evaluation of the
system are shown in section 4, and finally, we
conclude the paper related work does not cover all
existing methods and discuss about the future work
in Section 5.
2 RELATED WORK
There are many related works to ours. T. Sakaki et
al. proposed Toretter system to detect the
earthquakes and typhoons in Japan (T. Sakaki et al.,
2010). According to their paper, Twitter users who
were in crisis tweeted about the kind of disaster,
their experience, and the status. The system used a
filtering method with a pre-defined word dictionary
about the specific disasters such as earthquakes and
typhoons. With these pre-processing stages, their
system detects event’s location based on the Geo-
coordinates in Tweets, and it sends out an email to
warn to the registered people. According to their
evaluation result, the system could detect 96% of all
the earth quakes and its speed was faster than the
warning system of the Japan Meteorological
Agency. The system, named TEDAS, which detects
disasters and crimes in the United States in real-time
(Li et al., 2012). Same as Toretter, it used pre-
defined keywords and Geo-coordinates in Tweets to
detect an event and its location. The above
mentioned methods considered Twitter users as a
group of sensors. As the system detects an event in
real-time, it can help minimize the damage;
however, the limitation is that the system is based on
the pre-defined dictionary, so it can detect some
specific events only. Moreover, the system used the
Geo-coordinates in Tweets, but many people usually
turn off their GPS on the mobile phone or simply
just do not want to share their location information.
To solve this problem, Lee and Hwang proposed a
method to find location using the users’ profile
information, but only 12% of all users have the
profile locations. As they commented, the profile
locations were not matched with the Tweet location;
thus, the studies to resolve these problems and
limitations need to be done.
3 REALTIME EVENT LOCATION
ANALYZER
In this paper, we introduce a system that detects the
event location in real-time by analyzing the social
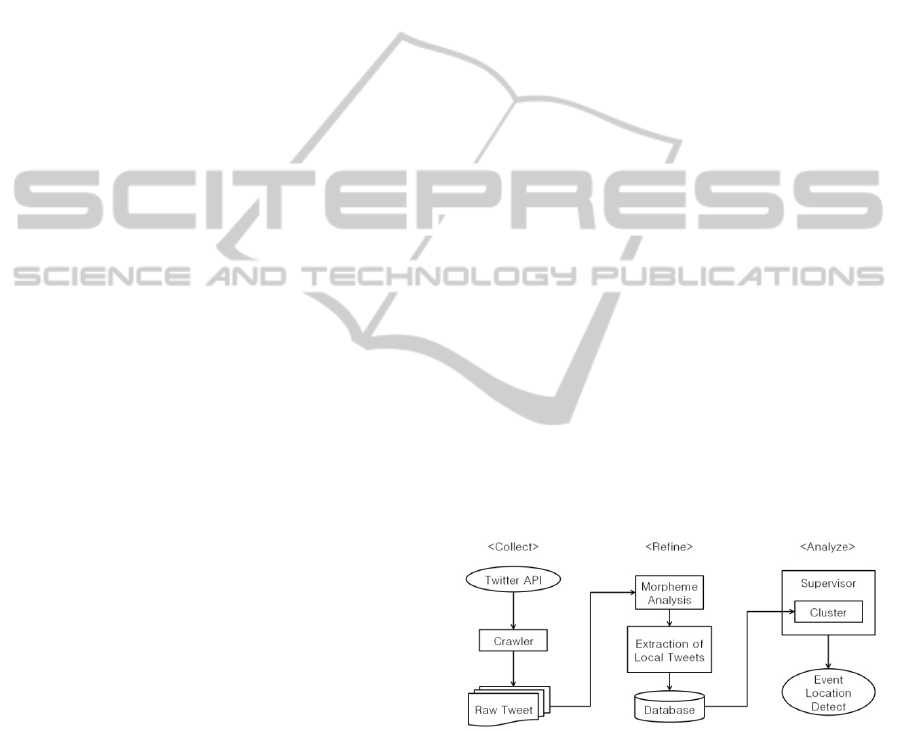
data. Figure 1 depicts the system architecture of the
proposed system. Section 3 explains about the three
modules shown in Figure 1. The system was
implemented with the special feature that can extract
the names of places in Korea. The locale setup can
be modified in other countries.
Figure 1: The System Architecture of the Real-time Event
Detector.
3.1 Data Collection
The proposed system uses Twitter’s Streaming API
which makes it available to collect Tweets in real
time. Since the API collects Tweets from all over the
world, the system needs to decide the country where
a Tweet was generated. There are several different
approaches for this step, but the proposed system
determines the country based on the characters in a
ICAART2015-InternationalConferenceonAgentsandArtificialIntelligence
350
Tweet. The API offers only 1% of all Tweets, but
our system uses temporal analysis to detect the
location of an event. Thus, if the system can collect
the data steadily, it does not need to collect all the
Tweets.
3.2 Refinement Stage
Once the data collection stage is done, the proposed
system extracts the Tweets which include the names
of places with the Natural Language Processing
techniques. In this paper, we used Lucene Korean
Morph Analyzer. The system disassembles a Tweet
into a set of morphemes and collects nouns as
keywords. After collecting all the keyword set, the
proposed system determines the location of each
Tweet using a table of the names of administrative
districts from the Korean census report. The entire
classification forms a tree structure. We assume that
the places with the same names are considered as the
place located on the higher level of the tree. In
addition, if more than two different places were
mentioned in a Tweet, we put this Tweet into the
first mentioned place because it is more appropriate
based on the word order of Korean language. We
also added the name set of the subway stations as a
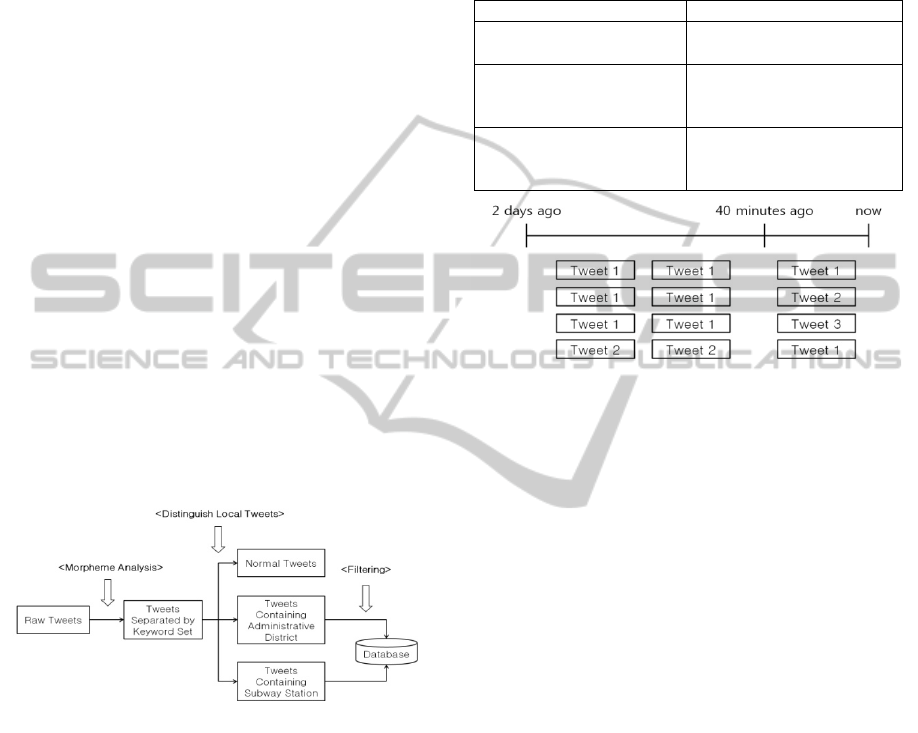
concept of landmark. Figure 2 shows the above
explanations as a diagram.
Figure 2: Tweet Refinement Stage.
3.3 Tweet Analyzer
For the last stage, the proposed system conducts
clustering to sort out the Tweets by locations. The
system initially creates clusters, and then it scans
continuously to detect the location of an event in real
time. At each time when the system scans new
Tweets, the clusters are updated and the system
calculates the variables shown in Table 1. The
variables in Table 1 are the values for the quantity
comparison between the recent data and the previous
data. Each time period is set to 40 minutes and is
going backward from the current time. TF is the
number of Tweets in last 40 minutes at a specific
location. VT is the number of the different kinds of
Tweets excluding duplicated Tweets and Retweets
in the same period of time at the location. DA is the
average number of the Tweets in last 2 days at the
location. Figure 3 shows an example.
Table 1: The Variables to Analyze Tweets.
Variables Explanations
TF (Term Frequency) The number of Tweets in
a time period at a location
VT (Variety of Tweets) The number of different
Tweets in a time period at
a location
DA (Document Average) The average number of
Tweets during last 72 time
period at a location
Figure 3: An Example Tweets at a Location A.
Assume that, there is a location named A. TF would
be 4 in Figure 3, and VT is 3 because we exclude the
duplications to get the VT. DA is close to 0.167
(12/72).
The supervisor module scans all clusters to
determine the location of an event with the variables.
To make candidates, the system uses TF and DA of
each place. If a real event occurs, the quantity of
Tweets which mention about the place is being
increased. Thus, a place which has more tweets
compared to the normal situation will be considered
as a candidate location. Some locations have
irregular numbers of tweets, and these locations can
be included in the candidate set although they do not
have any event. To avoid this situation, we set the
minimum Tweet increment as 10. This number can
be changed depending on the size of a target event,
but the bigger number causes the delays of the
detection. The increment of Tweets in each place of
N locations can be calculated with the Equation (1).
At the final stage, the system filters out the
candidates and only remains the event locations.
There are many places which were included in a
candidate set because the numbers of Tweets of the
places were increased in a short period of time. To
remove these locations, we need to consider the
variety of Tweets. Equation (2) shows how the
system finalizes the result. The system compares the
values between VT and DA and chooses the
locations where the VT is bigger than the DA. The
ImplementationofaRealtimeEvent-locationAnalyzer
351

EventDecision(k) must be bigger than 0 to be
determined as an event location.
(1)
(2)
4 RESULT
We collected the social data on Twitter from March
2013 to April 2014, more than a year. The control
event set was from the list of Breaking News from
Korean Broadcasting System, and the experimental
event set was extracted from the proposed system.
At the time when we were conducting the evaluation,
the system could collect about 60,000 Korean
Tweets in an hour. It took 22 minutes in average to
initialize the system. The initializing time includes
the time to scan all the data with two days history
and to create a set of clusters. Once the system is on
track, it takes only 0.277 seconds in average to scan
all the locations. This result shows that our system
can analyze the social data in real time within a
second.
Figure 4: Changes of TF, DA, and VT values.
Figure 4-left shows the changes of TF, DA, and VT
values at 3:50pm on March 9, 2013 in Pohang,
Korea. At the time, there was a fire at a mountain.
Our system detected the event 26 minutes after the
fire occurs. It only took less than half an hour
because there were not many Tweets in this city and
many people could observe the incident.
Figure 4-right is the graph that shows another
incident at 9:16pm on February 17, 2014 in
Gyeongju, Korea. When the roof of a resort was
collapsed, more than a thousand university students
were staying at the resort. The interesting point on
this graph is the aspect of information propagation.
Right after the incident, the graph reached the first
peak by the people who were at the scene. VT value
explains this aspect. The number of Tweets had been
reduced for a while, and the graph hit the second
peak later. During the graph hits the second peak,
the Tweets of the first peak started to be retweeted
by their followers and the Tweets from the news media
pushed up the graph as well.
5 CONCLUSIONS
This paper introduces the Real-time Event-location
Analyzer and shows its performance. The proposed
system detects an event in real-time if the event
occurs in a town or at a resort, but it still need to be
improved in its precision of the result and need to
reduce the false event. We plan to explore the up-to-
date methods in natural language processing that can
be applied to our system.
ACKNOWLEDGEMENTS
This research was supported by Basic Science
Research Program through the National Research
Foundation of Korea (NRF) funded by the Ministry
of Education, Science and Technology (No. 2011-
0009407).
REFERENCES
Barbosa, L., Feng. J., 2010. Robust Sentiment Detection
on Twitter from Biased and Noisy Data. In Proc. of
23
rd
Int'l Conf. on Computational Linguistics. pp. 36-44.
Lee, B., 2012. A Temporal Analysis of Posting Behavior
in Social Media Streams. In Proc. of ICWSM'12
Workshop on Social Media Visualization.
Hong, C., Kim, H., 2011. Effective Feature Extraction for
Tweets Classification. In Proc. of Korea Computer
Congress. pp. 229-232.
Lee, B., Hwang, B. Y., 2012. A Study of the Correlation
between the Spatial Attributes on Twitter. In Proc. of
ICDE'12 Workshop on Spatio-Temporal Data
Integration and Retrieval.
Lee, B., Yoon, J., Kim, S., and Hwang, B. Y., 2012.
Detecting Social Signals of Flu Symptoms. In Proc. of
COLLABORATECOM'12. pp. 544-545.
Lee, J., Bengio, S., Kim, S., Lebanon, G., and Singer, Y.,
2014. Local Collaborative Ranking. In Proc of 23rd
Int'l Conf. on WWW Conference Committee. pp 85-95.
Sakaki, T., Okzaki, M., and Matsuo, Y., 2010. Earthquake
Shakes Twitter Users: Real-time Event Detection by
Social Sensors. In Proc. of the 19th International
Conference on WWW. pp. 851-860.
Li, R., Lei, K. H., Khadiwala, R., and Chang, K. C. C.,
2012. TEDAS: a Twitter based Event Detection and
Analysis System. In Proc of the 28th International
Conference on Data Engineering. pp. 1273-1276.
ICAART2015-InternationalConferenceonAgentsandArtificialIntelligence
352
