
An Information-theoretical Approach to Classify Hospitals with
Respect to Their Diagnostic Diversity using Shannon’s Entropy
Thomas Ostermann
1
and Reinhard Schuster
2
1
Institute of Integrative Medicine, Witten/Herdecke University, 58313 Herdecke, Germany
2
Institute of Mathematics, University of Lübeck, 23562 Lübeck, Germany
Keywords: Entropy, Diagnostic Diversity, Hospital Comparison, Classification.
Abstract: In Germany hospital comparisons are part of health status reporting. This article presents the application of
Shannon’s entropy measure for hospital comparisons using reported diagnostic data. We used Shannon’s
entropy to measure the diagnostic diversity of a hospital department by means of reported ICD–9–codes.
Entropy values were compared both with respect to the hospital status (i.e. primary, secondary, tertiary or
specialized hospital) and specialisations (e.g. surgery, gynaecology). There were relevant differences in
entropy values between the different types of hospitals. Primary hospitals differed from specialized
hospitals (0.535 ± 0.09 vs. 0.504 ± 0.07). Furthermore, specialized departments like obstetrics or
ophthalmology did generate lower entropy values than area-spanning departments like paediatrics or general
internal medicine, having significantly higher values. In conclusion, we showed how entropy can be used as
a measure for classifying hospitals. Besides of hospital comparisons, this approach can be implemented in
all fields of health services research for measuring variability in nominal or ordinal data. The use of entropy
as a measure for health services research and classification algorithms should be encouraged to learn more
about this measure, which unreasonably has fallen into oblivion in health services research.
1 INTRODUCTION
With emerging costs in the health care sector,
hospitals more and more compete for limited
financial ressources. Hence, not only the comparison
of hospitals with respect to their outcome, but also
with respect to structural qualities plays an important
role for health care providers, physicians and of
course for the the patients (Betzler and Haun, 1998;
Aiken et al., 1998). In Germany however, hospital
comparisons are part of health status reporting and
thus have been put on a legal basis by the Federal
Gouvernment. Despite this fact, some
methodological problems are still unsolved
(Wegscheider, 2004; Schulz et al., 2004).
According to Frick et al. (2003) one of the main
problems is the handling of differences observed in
outcome and performance of hospitals, which are
mainly produced by two sources. On the one hand,
they emerge from the infrastructural properties of
the hospitals themselves; on the other hand they
emerge from the patients population treated in the
hospitals and their diagnostic diversity and severity.
One methodological approach of solving this
problem is to make a statistical adjustment for these
differences and then to perform a comparison on all
hospitals. Another approach is to compare only
those institutions, which have similar structural
premises and join them into groups by means of
cluster analysis.
This however requires the development of a
measure, which maps these characteristics onto a
numerical value. In the work of Gerste (1996) such a
measure was pragmatically calculated from the
relative differences of the ICD-9-codes as can be
seen in Figure 1.
Figure 1: Hospital group-profiles “Surgery” adapted from
Gerste (1996).
325
Ostermann T. and Schuster R..
An Information-theoretical Approach to Classify Hospitals with Respect to Their Diagnostic Diversity using Shannon’s Entropy .
DOI: 10.5220/0005197103250329
In Proceedings of the International Conference on Health Informatics (HEALTHINF-2015), pages 325-329
ISBN: 978-989-758-068-0
Copyright
c
2015 SCITEPRESS (Science and Technology Publications, Lda.)

Most of these approaches for grouping hospitals by
means of diagnostic data are empirically motivated
and e.g. ask for the number n of diagnoses needed to
account for, say 80% of the patient volume. Only a
few systematic and intersubjetively valid approaches
have been proposed for this problem so far (Izsak,
1994).
One method based on the concept of Shannon’s
entropy was proposed quite early by Elayat et al.
(1978) to cluster hospitals in homogenous groups
and has been adapted by Farley (1989) for the
analysis of case-mix specialization and the
concentration of diagnoses in hospitals quite early.
Although information-theoretical approaches are
commonly accepted and applied as a measure for
diversity in other fields of science (Nayak, 1985;
Ricotta and Avena, 2003), it did not become an
accepted method in Health Services Research so far.
For the special case of diagnostic diversity, a
MEDLINE search only found one result dealing
with the relevance of diagnostic diversity and patient
volumes for quality and lenght of stay in pediatric
intensive care units (Ruttimann et al., 2000).
This article is based on a very short conceptual
paper from Erben (2000) and presents the
application of Shannon’s entropy measure for the
calcualtion of diagnostic diversity on a broarder
dataset from hospitals and discusses the results with
respect to other hospital performance measures.
2 MATERIAL AND METHODS
Shannon’s entropy is based on a system of mutually
exclusive and exhaustive events A
1
, A
2
,…, A
n
and a
set of probabilities p
1
:= p(A
1
), p
2
:= p(A
2
),…, p
n
:=
p(A
n
). Then, the entropy is given by
1)
1
(,, log
n
nkk
k
E
pp pp
(1)
where 0 log 0 = 0 is assumed. The largest value of E
is given for the equal distribution of the events A
i
with
nkp
n
k
,,2,1;
1
, which is easy to proof.
Thus, to standardize E on the interval [0, 1], it has to
be divided by
)log(
1
max
n
E
.
In the following, we use the term entropy for this
kind of standardised entropy value. Expect from a
scaling factor which depends on which logarithm
is used, there is only one such function E, which
quantifies the content of information in the above
defined way.
To illustrate our approach, we will give the
original example from Erben (2000): In his work he
analysed the L4-hospital diagnosis statistics and
thus, the events A
i
are given by aggregated three-
digit-ICD-9 codes (e.g. 820 = “Fracture of the neck
of the femur”).
Suppose now, we have two hospitals A and B.
Hospital A is highly specialized in orthopaedic
surgery. In this case, 75% of all cases are covered by
one two three-digit-ICD-9 codes and four three-
digit-ICD-9 codes include about 90% of all cases
treated in this hospital. In total, 71 three-digit-ICD-9
cover the complete spectrum of this hospital. This
leads to a value of E=0,368.
Hospital B is an orthopaedic clinic and
additionally serves as a university clinic. In this
case, 17 three-digit-ICD-9 codes are needed to cover
75% of all cases. In total 113 three-digit-ICD-9
codes are needed to cover the complete range of
cases. This leads to an entropy-value of E = 0,729.
With a low value for the specialized clinic A and a
value double that size for the university clinic B,
entropy thus might serve as a good indicator for
diagnostic diversity.
To see if the results of this example are
generalizable to a greater variety of hospital
departments, we analysed the complete spectrum of
hospital departments in Schleswig- Holstein. For
further analysis these departments are subdivided
with respect to their area (e.g. internal medicine,
surgery, gynaecology) but also with respect to the
hospital status they are affiliated with. This status is
defined as follows:
Primary hospitals include at least the fields of
Internal Medicine and Surgery, and according to
requirements may include the fields of Obstetrics
and/or Gynaecology, Otorhinolaryngology and
Ophthalmology and, in special cases Urology and
Orthopaedics.
Secondary hospitals: Additionally to the fields
covered by primary hospitals, secondary hospitals
include paediatrics, neurology and dental surgery.
Tertiary hospitals: The range of services of
tertiary hospitals significantly goes far beyond those
of secondary and primary hospitals. This includes
the provision of a highly differentiated range of
technical equipment e.g. medical devices like a
positron emission tomograph.
Specialized hospitals offer the best medical
therapy and care for a limited range of diagnoses
including the referral of complicated cases.
Just like in the original work of Erben (2000), the
statistics are based on the data set of the aggregated
three-digit ICD-9-codes from the L4-hospital
statistics of 1998. We excluded hospitals with
incomplete diagnostic data, which led to a sample of
HEALTHINF2015-InternationalConferenceonHealthInformatics
326
977 hospitals and hospital departments that were
included in our analysis.
Descriptive statistics and the calculation of the
entropy were performed with SPSS for Windows
Version 20.
3 RESULTS
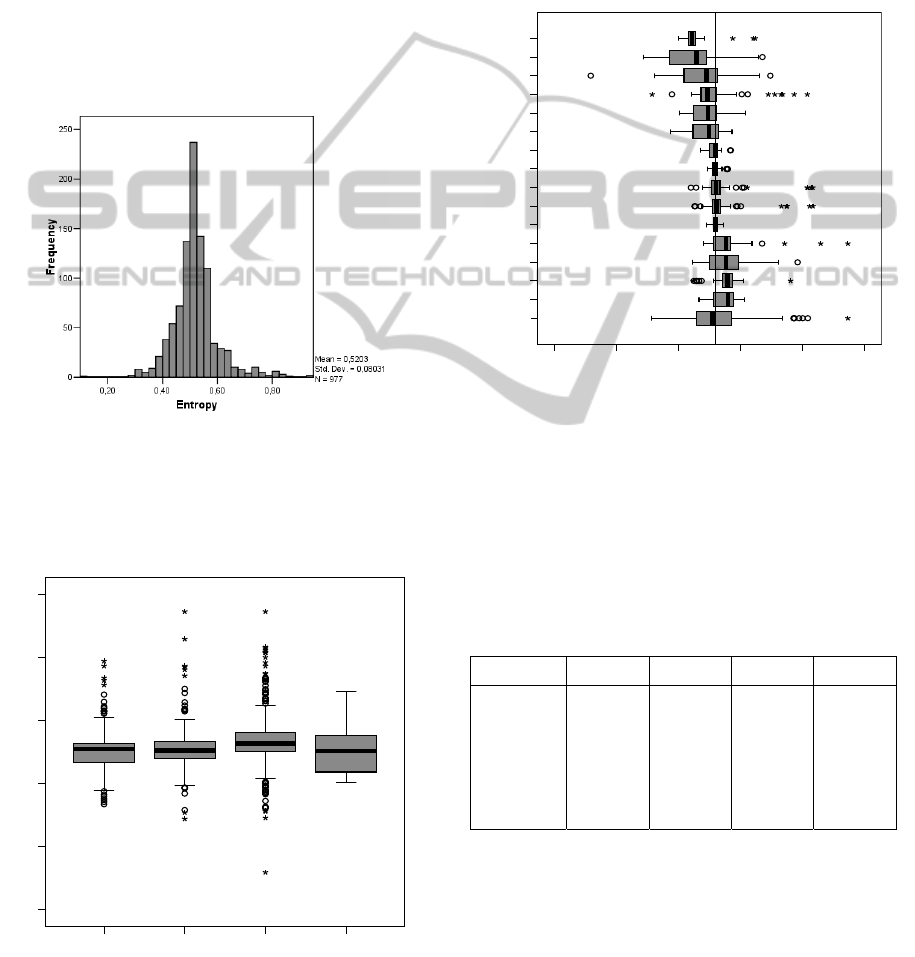
Figure 2 shows the distribution of entropy values for
all 977 institutions. The distribution is quite
symmetric with a minimum entropy value of 0.12, a
maximum of 0.95 and a median of 0.516, which is
near the mean of 0.520.
Figure 2: Entropy-distribution of all hospitals and
departments (N=977).
Figures 3 and 4 show the subgroup analysis of
entropy with respect to the hospital classification
and the medical fields of the hospitals.
Primary Hospitals Secondary
Hospitals
Tertiary Hospitals Special Hospitals
0,00
0,20
0,40
0,60
0,80
1,00
Entropy
Figure 3: Boxplot of Entropy-values for all hospitals and
departments subdivided for hospital status.
With median-values from 0.50 to 0.52 and a similar
interquartile ranges (IQR), primary, secondary and
tertiary hospitals do not extremely differ in their
entropy-values. Nevertheless there is a difference
with respect to the range. As can also be seen from
the distribution of entropy parameters in the Table 1,
there is an evidence of outliers in the group of
primary to tertiary hospitals, which are marked in
the boxplot-figure with stars and circles. This effect
is not observed in the group of specialized hospitals.
Sonst.
GGY
IVM
URO
ZKH
CUC
CHI
IMD
KIH
NUR
ORT
PSY
GGF
HNO
AUG
GBH
Medical Field
0,00 0,20 0,40 0,60 0,80 1,00
Entropy
OTHER
Figure 4: Boxplot of Entropy-values for all hospitals and
departments subdivided into medical fields (CHI=
Surgery; IMD= Internal Medicine; HNO=
Otorhinolaryngology; GGF= Gynaecology and Obstetrics;
URO= Urology; PSY= Psychiatry; ORT= Orthopaedics;
IVM= Intensive Care; KIH= Paediatric Intensive Care;
NUR= Nuclear Medicine and Radiology; ZKH= Dental
Surgery; GGY= General Gynaecology; GBH= Obstetrics;
AUG= Ophthalmology; CUC= Traumatology).
Table 1: Statistical parameters for the distribution of
entropy subdivided by hospital classification.
Primary Secondary Tertiary Specialized
Mean SD
Median IQR
Minimum
Maximum
Range
0.535
0.09
0.506 0.06
0.33
0.79
0.46
0.510
0.07
0.505 0.06
0.29
0.95
0.66
0.505 0,07
0.510 0,06
0.12
0.95
0.83
0.504
0.07
0.503 0.12
0.40
0.69
0.29
Whilst the subgroup analysis of entropy by
means of hospital categories did not yield to
promising conclusions, the subdivision with respect
to medical fields does generate some interesting
findings. On first sight, highly specialized
departments like obstetrics (0.44) or ophthalmology
(0.46) generate lower entropy values than area-
spanning departments like Nuclear Medicine and
AnInformation-theoreticalApproachtoClassifyHospitalswithRespecttoTheirDiagnosticDiversityusingShannon's
Entropy
327

Radiology (0.52) or general gynaecology (0.56),
which have significantly higher values (p<0.05).
4 CONCLUSIONS
This article examines the application of Shannon’s
entropy measure to hospital diagnostic admission
data. Although Shannon's entropy has been widely
used as a measure for diversity in various scientific
fields, it has only sparsely been applied for
classification purposes in health services research.
Based on the frequencies of three-digit-ICD-9
codes at hospital admission, we showed the
possibilities of Shannon’s measure of entropy as a
possibility for analysing nominal scaled data of
health status reporting of hospitals. Based on the L4-
statistics, we exemplified how entropy can be used
for clustering hospitals by using their routine
diagnostic data.
Although the ICD-9 data from our example dates
back almost 10 years, our approach can easily be
adapted to hospital data based on ICD-10 or DRGs.
Especially in DRG-data a clearer differentiation of
specialized hospitals might be possible.
With increasingly limited financial resources in
the health care sector, hospitals as well as networks
of general practitioners are seeking for markers
which distinguish them from competitors in their
fields (Sabatino et al., 1992). The assessment of
diversity therefore might be one promising
approach, which especially in the life sciences is
already a highly important issue. From the level of
molecular biology i.e., the diversity of gene
expressions is actually discussed, whereas on the
level of evolutionary biology the diversity of species
in the animal and plant kingdom is of relevance. In
both situations entropy has been applied as a
measure to assess the diversity or complexity (Pueyo
et al., 2007).
Using entropy as a diversity marker can basically
be implemented in all fields of health services
research, where categorical data emerges. One actual
example is the application of entropy as a measure to
assess the diversity of medical devices in large
inventories of medical equipment (Brindle et al.,
2008). For diagnostic or therapeutic data, entropy
might be useful e.g. for measuring the variability of
diagnostic data.
One particular application might be the
comparison of suspected diagnosis at referral of
hospitalized patients versus the proven admission
diagnosis at intake. Another example is the use of
entropy for the analysis of clinical pathways.
Especially in integrated care, the question arises,
whether entropy is created by transferring patients
from a primary hospital to a specialized clinic or
vice versa. This might lead to a sequential
calculation of entropy by dividing diagnostic data
with respect to the pathways patients were admitted.
Hence, one might wonder why outcomes
research has not used this measure e.g. for the
diversity classification in health outcomes.
Especially for the task of measuring variability in
nominal or ordinal data parameters common
parameters like standard deviation or the variation
coefficient are not applicable and thus, entropy can
be used for such purposes.
Although our examples are quite
comprehensible, one has to be aware that entropy is
just a marker for variety and does not measure a
difference in the distribution of categorical data. For
example, groups one and four in Fig. 1 of the
hospital group-profiles “Surgery” from Gerste
(1996) show a similar distribution, where group one
can be created by shifting group four to the right.
Although their profile is completely different, their
entropy, if it had been calculated, would be quite
similar. Hence, entropy only classifies with respect
to similar structures (e.g. centroids in special
diagnostic groups), but does not give a clue whether
these structures are similar to each other in respect
of contents.
Thus, according to Jost (2006) it is important to
distinguish between entropy and true diversities
when interpreting such indices as it is not obvious on
what basis these indices were computed.
Moreover a variety of entropy measures does
exist summarized in the generalized diversity indices
proposed by Patil andTaillie (1982)
)(
1
j
S
j
j
pp
with
1)ln(
1
1
1
)(
1
ifp
if
p
p
j
j
j
As a special case (=1) does also include
Shannon’s entropy measure.
A detailed mathematical analysis of Leinster and
Cobbold (2012) found that Shannon’s entropy might
be more sensitive to rare events, while others like
Simpson’s measure of diversity (=2) is not that
much influenced by such events. This property still
makes Shannon’s entropy to be one of the most
reliable diversity indices.
HEALTHINF2015-InternationalConferenceonHealthInformatics
328

Nevertheless different sensitivities to the occurence
of rare events have to be taken into account very
carefully, when deriving conclusions from entropy
measures (Ricotta and Seidl, 2006).
In our case of diagnostic diversity of hospitals
we therefore believe that Shannon’s entropy is a
proper choice.
In conclusion the use of entropy as a measure for
health services research and classification algorithms
based on entropy have to be encouraged to learn
more about this measure, which unreasonably has
fallen into oblivion in health services research.
REFERENCES
Aiken, L.H., Sloane, D.M., Sochalski. J., 1998. Hospital
organisation and outcomes. Quality in Health Care
7:222–226.
Betzler, M., Haun, P., 1998. Hospital Comparison – Status
quo and prospects. Chirurg 69:1300-1304.
Brindle, G.W., Gibson, C.J., 2008. Entropy as a measure
of diversity in an inventory of medical devices. Med
Eng Phys.;30(3):399-401.
Elayat, H.A., Murphy, B.B., Prabhakar, N.D., 1978.
Entropy in the hierarchical cluster analysis of
hospitals. Health Serv Res 13: 395-403.
Erben, C.M., 2000. The concept of entropy as a possibility
for gathering mass data for nominal scaled data in
health status reporting. Stud Health Technol Inform
2000; 77:118-9.
Farley, D.E., 1989. Case-Mix specialization and the
concentration of diagnoses in hospitals using
information theory. J Health Economics 8: 185-207.
Frick, U., Binder, H., Barta, W., Cording, C., 2003. Fair
Hospital Comparisons - Does the method contracted in
Germany enable unbiased results? Gesundheitswesen
65: 8-18.
Gerste, B., 1996. Bildung von Krankenhausgruppen auf
Fallmix-Basis. In Arnold M, Paffrath D (Eds.):
Krankenhaus-Report ’96.Stuttgart: Gustav-Fischer:
115-126.
Izsak, J., 1994. Applying the jackknife method to
significance tests on diagnsotic diversity. Methods Inf
Med 33: 214-9.
Jost, L., 2006. Entropy and diversity. Oikos, 113(2), 363-
375.
Leinster, T., Cobbold C.A., 2012. Measuring diversity: the
importance of species similarity. Ecology, 93(3), 477-
489.
Nayak, T.K., 1985. On Diversity Measures Based on
Entropy Functions. Commun. Statist.- Theory Meth.
14: 203-215.
Patil, G.P., Taillie, C., 1982. Diversity as a concept and
its measurement. J. Am. Stat. Assoc. 77, 548–567.
Pueyo, S., He, F., Zillio, T., 2007. The maximum entropy
formalism and the idiosyncratic theory of biodiversity.
Ecol Lett.10(11):1017-28.
Ricotta, C., 2002. Measuring taxonomic diversity with
parametric information functions. Community Ecology
3(1): 95-99.
Ricotta, C. Avena G.C., 2003. An information-theoretical
measure of taxonomic diversity. Acta Biotheor 51: 35-
41.
Ricotta, C., Szeidl, L., 2006. Towards a unifying approach
to diversity measures: bridging the gap between the
Shannon entropy and Rao's quadratic index.
Theoretical population biology 70(3): 237-243.
Ruttimann, U.E., Patel, K.M., Pollack, M.M., 2000.
Relevance of diagnostic diversity and patient volumes
for quality and leght of stay in pediatric intensive care
units. Pediatr Crit Care Med 1: 133-9.
Sabatino, F., Koska, M.T., Burke, M., Hudson, T., 1992.
Clinical quality initiatives: the search for meaningful-
and accurate-measures. Hospitals 66(5):26-32, 34, 36-
40.
Schulz, H., Barghaan, D., Watzke, B., Koch, U., Harfst,
T., 2004. Clinical Comparison as an instrument for
Quality Assurance in the treatment of patients with
mental disorders: The Significance of Risk
Adjustment. ZaeFQ 98: 663-672.
Wegscheider, K., 2004. Methodological requirements for
center comparisons (profiling) in health care. ZaeFQ
98: 647-654.
AnInformation-theoreticalApproachtoClassifyHospitalswithRespecttoTheirDiagnosticDiversityusingShannon's
Entropy
329
