
Analysis of the Electromechanical Activity of the Heart from
Synchronized ECG and PCG Signals of Subjects Under Stress
Ana Castro
1
, Ali Moukadem
2
, Samuel Schmidt
3
, Alain Dieterlen
2
and Miguel T. Coimbra
4
1
Faculdade de Engenharia, Universidade do Porto, Porto, Portugal
2
MIPS - IUT, Universit
´
e de Haute-Alsace, Mulhouse, France
3
Department of Health Science and Technology, Aalborg University, Aalborg, Denmark
4
Instituto de Telecomunicac¸
˜
oes, Departamento de Ci
ˆ
encia de Computadores, Faculdade de Ci
ˆ
encias,
Universidade do Porto, Porto, Portugal
Keywords:
Electrocardiogram, Phonocardiogram, Heart Sound, Exercise, Stress.
Abstract:
In this exploratory study we propose to analyze, in healthy adult volunteers, the heart electrical (electrocar-
diogram, ECG) and mechanical (phonocardiogram, PCG) activity during exercise. Heart sounds amplitude,
frequency content, and RS2, may be important features in the non-invasive assessment of heart activity, such
as for the estimation of cardiac output and blood pressure. Nine healthy volunteers were monitored with ECG
and PCG simultaneously, under a stress test. After each workload level a 10 s window of signal was collected.
PCG first (S1) and second (S2) heart sounds were manually annotated, based on time of QRS complex occur-
rence. A QRS detector was implemented to detect the QRS complex, and time intervals between electrical
and mechanical events. Extracted features were analyzed in relation to heart rate (HR), including RS2, S1
and S2 amplitudes, and high frequency content of S1 and S2. Spearman correlation was used. Changes be-
tween baseline and maximum workload stage/HR for each volunteer were analyzed. Significant correlation
was observed between HR, and all characteristics extracted (P<0.01). There was a clear difference between
all variables from baseline to maximum workload level: with increasing workload/HR heart sounds amplitude
increased (more pronounced in S1), RS2 decreased, and high frequency content of S2 decreased in relation
to the high frequency content of S1, demonstrating that dynamic cardiovascular relations are individualized
during cardiac stress and that assumptions for resting conditions may not be assumed.
1 INTRODUCTION
The heart is the center of the cardiovascular system,
pumping blood to the pulmonary and systemic circu-
lations, taking oxygen and nutrients to all organs.
During exercise, the muscles need for oxygen and
nutrients, leads to an increase in heart activity and res-
piration rate. It is known that stroke volume (SV) in
athletes is superior to the normal person, nonetheless
in rest condition the cardiac output (CO) is compara-
ble between the two, since heart rate (HR) tends to be
lower in the athletes.
With increasing levels of exercise, oxygen con-
sumption increases, leading to an elevated CO. The
CO increases as a function of increased HR (major
responsible for this increase), and SV, which tends to
stabilize in a plateau (Guyton and Hall, 2006). Also,
the blood pressure (BP) during exercise is increased
(Sullivan et al., 1989).
Heart function may be monitored through differ-
ent means, such as electrical activity (electrocardio-
gram, ECG), and the register of mechanical activity
through ecocardiography, or heart sound auscultation
(phonocardiogram, PCG). In the PCG, the heart cy-
cle period (S11) is depicted in four main components:
the first sound (S1) corresponding to the closure of
mitral and tricuspid valves, the systolic period (S12),
the second sound (S2) corresponding to the closure
of the aortic and pulmonary valves, and the diastolic
period (S21) (Guyton and Hall, 2006).
The correct identification of heart sounds allows
retrieval of information from each component, includ-
ing the detection of murmurs and their characteristics,
which is very important for cardiovascular patholo-
gies screening. The S2 is described as being com-
posed by two components: the first related to the clo-
sure of the aortic valve (A2) and systemic BP, and a
second component related to the closure of the pul-
49
Castro A., Moukadem A., Schmidt S., Dieterlen A. and T. Coimbra M..
Analysis of the Electromechanical Activity of the Heart from Synchronized ECG and PCG Signals of Subjects Under Stress.
DOI: 10.5220/0005202400490056
In Proceedings of the International Conference on Bio-inspired Systems and Signal Processing (BIOSIGNALS-2015), pages 49-56
ISBN: 978-989-758-069-7
Copyright
c
2015 SCITEPRESS (Science and Technology Publications, Lda.)

monary valve (P2) and pulmonary BP (Guyton and
Hall, 2006; Xu et al., 2001). Previous studies have
demonstrated a relation between S2 characteristics
such as amplitude and frequency, and the arterial BP
both on the systemic (Bartels and Harder, 1992) and
pulmonary circulations (Xu et al., 2001; Smith and
Ventura, 2013).
Electrical and mechanical time events in the heart
cycle have also been explored to better understand
cardiovascular function, using pulse transit time (Sola
et al., 2011), vascular transit time (Chandrasekaran
et al., 2013), RS2 timing (Figure 1) (Zhang et al.,
2008) and their relation to BP and CO, in the search
for non-invasive estimations of these variables.
Figure 1: Representation of the heart electromechanical ac-
tivity as measured by the electrocardiogram (ECG) and the
phonocardiogram (PCG), with time intervals of interest.
Individual response to cardiac stress is dependent
on baseline conditions and dynamic adaptations dur-
ing exercise, nonetheless assumptions for resting con-
ditions may not me assumed under cardiac stress. The
study of the dynamic relations between electrical and
mechanical cardiac events may introduce important
information for the non-invasive assessment of car-
diac state (CO and BP e.g.) (Zheng et al., 2014). In
this exploratory study it was aimed at analyzing, in
adult volunteers under different exercise levels, the
evolution of the heart electromechanical activity un-
til stress is reached, including RS2 time interval and
the amplitude and frequency characteristics of heart
sounds, in order to better understand these relations
during exercise.
2 MATERIAL AND METHODS
2.1 Data Collection
To study experimentally the variation of some physi-
ological parameters in the ECG and PCG signals un-
der a stress test, data collected from healthy subjects
from the department of Health Science and Technol-
ogy, Aalborg University is used in this paper (Ronved
et al., 2011).
Nine healthy subjects were enrolled in the study,
four females and five males, with median age 32 (24-
36). Informed consent was retrieved from all subjects
prior to the exercise test.
A Panasonic microphone was incorporated in a
coupler, specially designed by the Department of
Acoustics at Aalborg University, Denmark. The mi-
crophone detects the mechanical pressure differences
in the coupler, caused by alterations of the sound pres-
sure. The microphone records with a sampling fre-
quency of 48000 Hz. The microphone was fitted to
the 3rd left intercostal space with a specially designed
double adhesive plaster. The heart sound recordings
are synchronized with a 3-lead ECG.
Following monitoring, the subject cycled on a
Monark Ergometric 894E ergometer bicycle, and the
workload was increased by 25 Watt every two min-
utes, with an initial workload of 25 watt. The sub-
ject cycled until subjective maximum endurance was
reached. Afterward subjects that did not reach 80%
of maximum heart rate defined as 220 minus age±12
were excluded from the study. One subject did not
reach this rate and was therefore excluded from the
study. Recordings of heart sounds were made for 10
seconds at the end of each workload level.
An Acarix Data Acquisition System was used for
recording the heart sounds and ECG (Hansen et al.,
2011).
2.2 Electromechanical Activity Analysis
PCG and ECG signals were visually inspected, and
the heart sounds manually annotated based on the
point where the variation from the baseline began
(Ronved et al., 2011).
For the ECG, a QRS detector based on the wavelet
transform was implemented. A zero-phase, Butter-
worth band-pass filter was applied to the data (10-
25 Hz), and the wavelet transform level 8 was ob-
tained. Energy peaks of detail coefficients at levels
7 and 8 were used in a peak-picking algorithm to de-
tect the QRS complex (Kohler et al., 2002; Zidelmal
et al., 2012).
Figure 2 presents the collected signals in one of
the volunteers in the study, including the manually an-
notated heart sounds, and detected QRS complexes.
Markers from the ECG were crossed with the
PCG markers to obtain the electromechanical time in-
tervals, for the different workload levels. For each
heart sound cycle manually annotated, the algorithm
searched for the corresponding QRS complex (within
BIOSIGNALS2015-InternationalConferenceonBio-inspiredSystemsandSignalProcessing
50
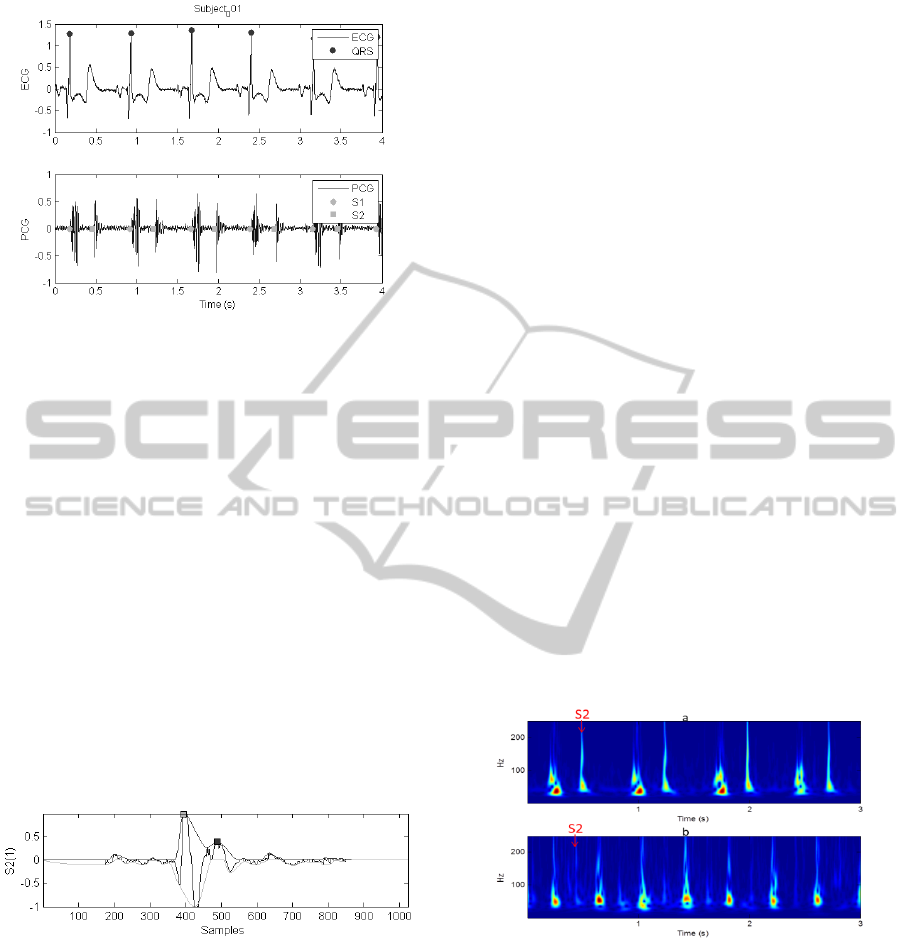
Figure 2: Data from one of the volunteers in the study, at
rest condition: on top the electrocardiogram (ECG), and be-
low the corresponding phonocardiogram (PCG) with over-
lapping markers of the first heart (S1) and second (S2) heart
sounds.
a 50 ms neighborhood of S1), and when a match was
obtained, the time intervals were registered with the
corresponding workload level.
RS2, RR, S12, S21 and S11 time intervals were
extracted as the time difference between each marked
event as depicted in Figure 2.
For the assessment of the heart sounds’ ampli-
tudes the temporal contour envelopes were extracted
from each S1 and S2, based on the local maximums
and minimums of the signal, and interpolated using a
cubic Hermite spline, as may be observed in Figure
3. The contour envelopes were used to estimate the
amplitude of heart sounds. The cubic Hermite spline
was used since it produces smooth contour envelopes
of the signal without overshoot.
Figure 3: Example of the temporal positive and negative
contour envelopes of a S2.
2.3 Assessing the High Frequency
Content of Heart Sounds
Besides time analysis the frequency content of S1 and
S2 with increasing workload levels/HR was analyzed.
As referred earlier, the initial component of S1 is re-
lated to the mitral and tricuspid valve closure, due
to the contraction of ventricles, thus identifying the
onset of ventricular systole and the end of mechani-
cal diastole (Felner, 1990a). The S2 is produced by
the aortic and pulmonic valves closing when left ven-
tricular pressure decreases under diastolic aortic pres-
sure. The vibrations of S2 occur at the end of ven-
tricular contraction and identify the onset of ventricu-
lar diastole and the end of mechanical systole (Felner,
1990b).
Normally, S2 exhibits higher frequency content
than S1, however the intensity and frequency of the
S1 are affected by the velocity of the forces respon-
sible to the acceleration and deceleration of the blood
masses, which on the other hand are directly related
to the HR (Felner, 1990a).
In this paper, the high frequency content of S1 and
S2 is assessed and its variation over HR is investi-
gated. The frequency content is calculated from the
Stockwell transform (S-transform) which is a time-
frequency transform (Stockwell et al., 1996).
The S-Transform originates from two advanced
signal processing tools, the Short Time Fourier Trans-
form (STFT) and the Wavelet Transform (WT). It can
be viewed as a frequency dependent STFT or a phase
corrected WT. The S-transform is becoming a valu-
able tool applied on many signals and domains as
cardiovascular (Moukadem et al., 2013), EEG sig-
nals (Assous and Boashash, 2012), geophysics (Pin-
negar and Mansinha, 2003), power system engineer-
ing (Biswal and Dash, 2013), among others.
Figure 4 presents the heart sound S-Transform for
the same volunteer, under two different workload lev-
els.
Figure 4: The S-Transform of two sounds corresponding to
the same subject and two different heart rates (a: HR=80
bpm, b: 142 bpm) showing the high frequency content of
S2 decreases when the heart rate is higher.
2.3.1 The High Frequency Content (HFC)
First, the heart sounds are segmented into S1 and
S2 by using the algorithm proposed in (Moukadem,
2013) and the high frequency content is assessed as
follows:
HFC
x
(t) =
Z
+∞
−∞
S
x
(t, f )d f (1)
AnalysisoftheElectromechanicalActivityoftheHeartfromSynchronizedECGandPCGSignalsofSubjectsUnderStress
51
where f ∈ [50, 250]Hz.
The function HFC
x
gives the high frequency con-
tent of the given signal x (which is a S1 or S2 sounds
in this case). A peak detector algorithm is then ap-
plied to assess the frequency content of each seg-
mented sound and the ratio HFC
S2
/HFC
S1
(noted
S2/S1 for simplicity) is calculated.
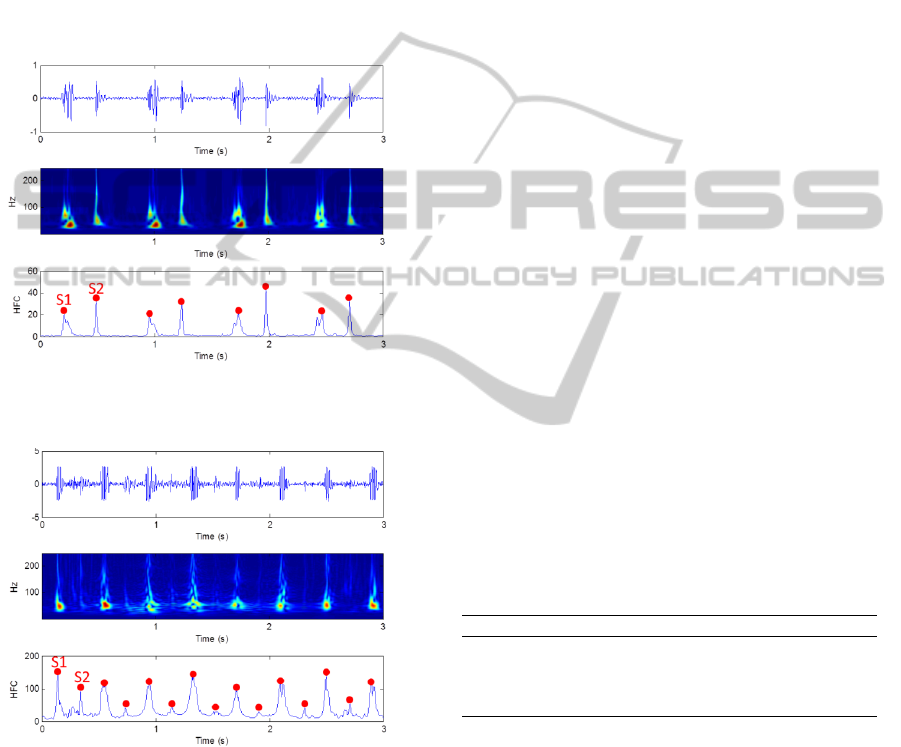
Figures 5 and 6 show an example of heart sounds
selected from the database and the detected peaks on
the HFC function which aim to assess the high fre-
quency content of S1 and S2. We may observe that
with increasing HR, the HFC of S2 is decreased.
Figure 5: Heart sounds selected form the database (top), the
S-transform (middle), the HFC function and the detected
peaks where HFC
S1
< HFC
S2
(bottom).
Figure 6: Heart sounds selected form the database (top), the
S-transform (middle), the HFC function and the detected
peaks where HFC
S1
> HFC
S2
(bottom).
2.4 Statistical Analysis
Data collected from nine volunteers was down-
sampled to 2 kHz, and analyzed for each selected
workload level. One of the volunteers was excluded
from the analysis due to protocol deviation. The eight
volunteers started the experiment with different base-
line HR values for the first workload (76±17.6), and
reached different workload levels (9, 12, 12, 7, 10, 14,
8, 6).
For each subject four heart cycles are selected at
four different stress levels (different HR), then the
mean and the standard-deviation of the extracted fea-
tures are calculated in relation to the HR. Extracted
features include HR, RS2, S1 and S2 amplitudes, and
S1/S2 HFC ratio.
Features were then analyzed in relation to the HR
(Spearman correlation coefficient ρ), for the total data
and for each subject individually.
Baseline conditions versus the maximum exercise
workload achieved were compared using error bar
plots.
3 RESULTS AND DISCUSSION
3.1 Electromechanical Activity of the
Heart
It was observed that the RS2 time intervals decreased
with increasing workload in all volunteers, as demon-
strated in Figure 7. This decrease in time from elec-
trical on-set to mechanical event (aortic valve closure)
was accompanied by an increase in heart sounds’ am-
plitude. S1 amplitude had a more pronounced in-
crease than S2 as may be observed in Figure 8.
Table 1 presents the Spearman correlation coeffi-
cient values between the different metrics extracted
from the PCG and ECG, and the workload levels/HR.
Table 1: Correlation between workload, HR and the vari-
ables extracted from the PCG and ECG, for the total dataset,
and the average for each subject individually (* P<0.01).
Total (ρ) Average Individual (ρ)
RS2 -0.88* -0.86
S1 Amplitude 0.47* 0.63
S2 Amplitude 0.12 0.29
S2/S1 -0.70 -0.88
We may observe that RS2 presents the highest cor-
relation values for the total data set. This was also ob-
served within each subject data. RS2 has been linked
to blood pressure, which is also increased during ex-
ercise. This may configure a good indicator of car-
diovascular changes during exercise, such as CO, BP,
pre-ejection period (PEP), and the left ventricle ejec-
tion time (LVET) (Paiva et al., 2009; Carvalho et al.,
2010; Sola et al., 2011; Sola et al., 2013). RS2 val-
ues present a high correlation with HR, both using the
total data, as the individual changes, which indicates
that this variable was similar among subjects (base-
line values and evolution with HR).
BIOSIGNALS2015-InternationalConferenceonBio-inspiredSystemsandSignalProcessing
52

Figure 7: Variation of the RS2 interval over the HR for all subjects.
S1 amplitude also presented a good correlation
with the workload/HR, however we should highlight
that heart sound amplitudes are highly dependent on
the acquisition conditions. Heart sounds amplitudes
are known to vary with subjects’ biotype, as well
as microphone positioning and gain, representing a
bias in the comparison of values for different subjects
(subject 3 on Figure 8 e.g.). This was confirmed by
the lower correlation for the total data set, when com-
pared to the individual assessment.
In Figure 8 it is observed that S1 and S2 ampli-
tudes present an increasing tendency with increas-
ing stress levels (except subject 2), but with different
baseline values for each subject. It is also observed
that the amplitude ratio between S1 and S2 ampli-
tudes are different at baseline, which may be a result
of microphone positioning and subjects’ biotype, as
referred earlier. This however does not diminish the
information contained in these signals on the mechan-
ical activity of the heart under stress tests, if one con-
siders an individual calibration, as suggested in (Bar-
tels and Harder, 1992). Heart sounds amplitude and
frequency content have been used in previous stud-
ies to estimate systemic and pulmonary BP (Bartels
and Harder, 1992; Smith and Ventura, 2013; Dennis
et al., 2010), and results in this preliminary study in-
dicate that they also reflect the known cardiovascular
changes during exercise (increased CO).
The observed changes in the electromechanical
events and heart sound characteristics are the result of
the heart effort to pump more blood to reach the tis-
sues with increasing muscular effort. It is known that
the heart morphology varies with increasing exercise
(left ventricle diameter e.g.), and depending on the
type of physical activity (Pluim et al., 2000), this re-
sults in different baseline and stress adaptations from
the cardiovascular system, which may explain the
difference between volunteers regarding the baseline
values observed, and maximum workload achieved.
The different features extracted may convey im-
portant information on the assessment of the cardio-
vascular system, and allow for the better understand-
ing of these changes during a stress test.
3.2 Assessing the High Frequency
Content of Heart Sounds
To show experimentally the relation between the fre-
quency content of heart sounds and the HR, the HFC
of S1 and S2 is estimated as described earlier. Results
for the eight subjects in the experiment considering
S2/S1 are presented in Figure 9.
The results in Figure 9 show clearly the direct re-
lation of the frequency content of the heart sounds
and the heart rate. Normally, S2 has a higher fre-
quency content than S1 (S2/S1 > 1) except for sub-
ject 5. When the heart rate increases, the high fre-
quency content of S2 decreases which decrease the
ratio S2/S1, also observed in Figures 5 and 6.
The red line in Figure 9 indicates when the fre-
quency content of S1 exceeds the frequency content
of S2. The HFC ratio (S2/S1) presented a very good
correlation with the workload/HR (-0.88). However,
a lower correlation results for the total data set is ob-
AnalysisoftheElectromechanicalActivityoftheHeartfromSynchronizedECGandPCGSignalsofSubjectsUnderStress
53
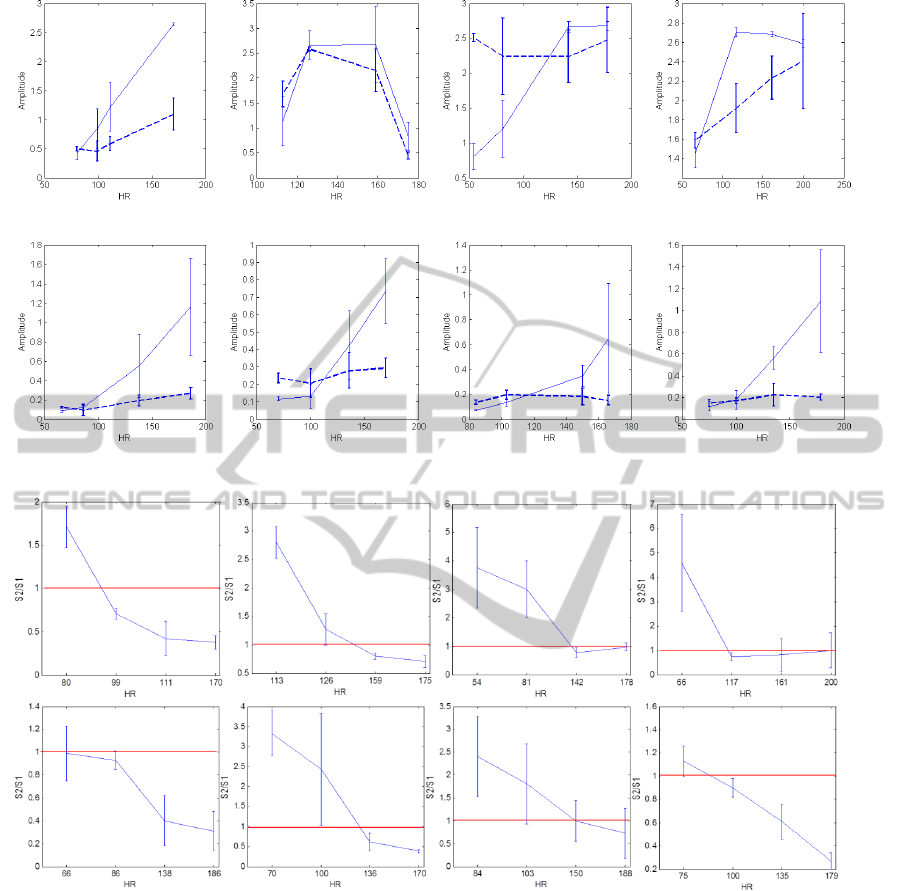
Figure 8: Variation of the S1 (solid line) and S2 (dashed line) amplitudes over the HR for all subjects.
Figure 9: Variation of the high frequency content ratio (S2/S1) over the HR for all subjects. The red lines indicate when the
high frequency content of S2 become lower than S1.
tained (-0.7). The frequency content of S1 and S2 is
also related to the biotype which makes the HFC mea-
sure more sensitive when compared between diffirent
subjects.
4 CONCLUSIONS
Investigating unobtrusive monitoring is of paramount
importance due to the society demands for long-term
monitoring in several scenarios from athletes assess-
ment, to the monitoring of the elderly at home (Zheng
et al., 2014). In this study a framework for the anal-
ysis of the cardiovascular electromechanical events
during exercise is proposed.
Several features from the ECG and PCG were
studied in adult volunteers during a exercise test in-
cluding the RS2 time interval, heart sounds amplitude
and HFC. All analyzed characteristics were related to
the increase in cardiac stress. Different baseline val-
ues were observed between subjects which may be de-
termined by their fitness and biotype.
RS2 was comparable between subjects, both for
the baseline and maximum stress achieved, with a
BIOSIGNALS2015-InternationalConferenceonBio-inspiredSystemsandSignalProcessing
54

good correlation both individually and for the total
data set. The assessment of the RS2 may be useful for
the non-invasive assessment of PEP and LVET during
exercise. Heart sound amplitude was also observed to
be increased with stress, the result of the cardiovascu-
lar response to the extra need for oxygenated blood in
the muscles during exercise, leading to an increase in
CO, HR and BP.
S2/S1 was decreased with increasing exercise,
and although HFC of S2 tend to be higher than of S1,
in this study we observed that during a stress test this
relation may be altered, leading to the need of differ-
ent features in the discrimination of S1 and S2 than
those usually proposed.
The description of these features allows a more
comprehensive assessment of the cardiovascular sys-
tem, and the dynamic changes that occur during a
stress test, paving the way for future studies, includ-
ing the assessment of these variables with blood pres-
sure measurement and simultaneous pulse wave am-
plitude analysis (vascular transit time).
ACKNOWLEDGEMENTS
This work was partially funded by the Fundac¸
˜
ao
para a Ci
ˆ
encia e Tecnologia (FCT, Portuguese Foun-
dation for Science and Technology) under the ref-
erence Heart Safe PTDC/EEI-PRO/2857/2012; and
Project I-CITY - ICT for Future Health/Faculdade de
Engenharia da Universidade do Porto, NORTE-07-
0124-FEDER-000068, funded by the Fundo Europeu
de Desenvolvimento Regional (FEDER) through the
Programa Operacional do Norte (ON2) and by na-
tional funds through FCT/MEC (PIDDAC); and the
french telemedicine project E-Care.
REFERENCES
Assous, S. and Boashash, B. (2012). Evaluation of the mod-
ified s-transform for time-frequency synchrony analy-
sis and source localisation. EURASIP Journal on Ad-
vances in Signal Processing, 2012(1).
Bartels, A. and Harder, D. (1992). Non-invasive determina-
tion of systolic blood pressure by heart sound pattern
analysis. Clinical Physics and Physiological Mea-
surement, 13(3):249 –256.
Biswal, M. and Dash, P. (2013). Detection and characteriza-
tion of multiple power quality disturbances with a fast
s-transform and decision tree based classifier. Digital
Signal Processing, 23(4):1071 – 1083.
Carvalho, P., Paiva, R., Couceiro, R., Henriques, J., An-
tunes, M., Quintal, I., Muehlsteff, J., and Aubert, X.
(2010). Comparison of systolic time interval measure-
ment modalities for portable devices. In Engineer-
ing in Medicine and Biology Society (EMBC), 2010
Annual International Conference of the IEEE, pages
606–609.
Chandrasekaran, V., Dantu, R., Jonnada, S., Thiyagaraja,
S., and Subbu, K. (2013). Cuffless differential blood
pressure estimation using smart phones. Biomedi-
cal Engineering, IEEE Transactions on, 60(4):1080–
1089.
Dennis, A., Michaels, A. D., Arand, P., and Ventura, D.
(2010). Noninvasive diagnosis of pulmonary hyper-
tension using heart sound analysis. Computers in Bi-
ology and Medicine, 40(9):758 – 764.
Felner, J. M. (1990a). Clinical Methods: The History, Phys-
ical, and Laboratory Examinations, chapter 22. The
First Heart Sound. CRC Press, Boston: Butterworths.
Felner, J. M. (1990b). Clinical Methods: The History, Phys-
ical, and Laboratory Examinations, chapter 23. The
Second Heart Sound. CRC Press, Boston: Butter-
worths.
Guyton, A. and Hall, J. E., editors (2006). Textbook of Med-
ical Physiology. Elsevier Saunders, 11th edition.
Hansen, J., Zimmermann, H., Schmidt, S., Hammershoi,
D., and Struijk, J. (2011). System for acquisition of
weak murmurs related to coronary artery diseases. In
Computing in Cardiology, 2011, pages 213–216.
Kohler, B.-U., Hennig, C., and Orglmeister, R. (2002). The
principles of software qrs detection. Engineering in
Medicine and Biology Magazine, IEEE, 21(1):42–57.
Moukadem, A., Dieterlen, A., Hueber, N., and Brandt, C.
(2013). A robust heart sounds segmentation module
based on s-transform. Biomedical Signal Processing
and Control, 8(3):273 – 281.
Paiva, R., Carvalho, P., Aubert, X., Muehlsteff, J., Hen-
riques, J., and Antunes, M. (2009). Assessing pep and
lvet from heart sounds: Algorithms and evaluation. In
Engineering in Medicine and Biology Society, 2009.
EMBC 2009. Annual International Conference of the
IEEE, pages 3129–3133.
Pinnegar, C. R. and Mansinha, L. (2003). The s-transform
with windows of arbitrary and varying shape. Geo-
physics, 68(1):381–385.
Pluim, B. M., Zwinderman, A. H., van der Laarse, A., and
van der Wall, E. E. (2000). The athletes heart: A meta-
analysis of cardiac structure and function. Circulation,
101(3):336–344.
Ronved, S., Gjerlov, I., Brokjaer, A., and Schmidt,
S. (2011). Phonocardiographic recordings of
first and second heart sound in determining the
systole/diastole-ratio during exercise test. In Drem-
strup, K., Rees, S., and Jensen, M., editors, 15th
Nordic-Baltic Conference on Biomedical Engineer-
ing and Medical Physics (NBC 2011), volume 34 of
IFMBE Proceedings, pages 85–88. Springer Berlin
Heidelberg.
Smith, R. and Ventura, D. (2013). A general model
for continuous noninvasive pulmonary artery pres-
sure estimation. Computers in Biology and Medicine,
43(7):904 – 913.
AnalysisoftheElectromechanicalActivityoftheHeartfromSynchronizedECGandPCGSignalsofSubjectsUnderStress
55

Sola, J., Chetelat, O., Sartori, C., Allemann, Y., and Ri-
moldi, S. (2011). Chest pulse-wave velocity: A novel
approach to assess arterial stiffness. Biomedical Engi-
neering, IEEE Transactions on, 58(1):215–223.
Sola, J., Proenca, M., Ferrario, D., Porchet, J.-A., Falhi,
A., Grossenbacher, O., Allemann, Y., Rimoldi, S.,
and Sartori, C. (2013). Noninvasive and nonocclusive
blood pressure estimation via a chest sensor. Biomedi-
cal Engineering, IEEE Transactions on, 60(12):3505–
3513.
Stockwell, R. G., Mansinha, L., and Lowe, R. P. (1996). Lo-
calization of the complex spectrum: the s transform.
Signal Processing, IEEE Transactions on, 44(4):998–
1001.
Sullivan, M. J., Knight, J. D., B., H. M., and Cobb,
F. R. (1989). Relation between central and periph-
eral hemodynamics during exercise in patients with
chronic heart failure. muscle blood flow is reduced
with maintenance of arterial perfusion pressure. Cir-
culation, 80:769–781.
Xu, J., Durand, L.-G., and Pibarot, P. (2001). Extraction of
the aortic and pulmonary components of the second
heart sound using a nonlinear transient chirp signal
model. Biomedical Engineering, IEEE Transactions
on, 48(3):277 –283.
Zhang, X.-Y., MacPherson, E., and Zhang, Y.-T. (2008).
Relations between the timing of the second heart
sound and aortic blood pressure. Biomedical Engi-
neering, IEEE Transactions on, 55(4):1291 –1297.
Zheng, Y.-L., Ding, X.-R., Poon, C., Lo, B., Zhang, H.,
Zhou, X.-L., Yang, G.-Z., Zhao, N., and Zhang, Y.-
T. (2014). Unobtrusive sensing and wearable devices
for health informatics. Biomedical Engineering, IEEE
Transactions on, 61(5):1538–1554.
Zidelmal, Z., Amirou, A., Adnane, M., and Belouchrani, A.
(2012). Qrs detection based on wavelet coefficients.
Computer Methods and Programs in Biomedicine,
107(3):490 – 496.
BIOSIGNALS2015-InternationalConferenceonBio-inspiredSystemsandSignalProcessing
56
