
Patterning of Multi-slits on Pipes for Developing Fine Diameter
Stents
Toshiyuki Horiuchi, Hiroshi Sakabe and Hiroshi Kobayashi
Graduate School of Engineering, Tokyo Denki University, 5 Senju-Asahi-cho, Adachi-ku, Tokyo, Japan
Keywords: Stent, Laser Scan Lithography, Slit Pattern, Etching, Stainless Steel Pipe.
Abstract: Precise slit patterns were delineated on fine stainless steel pipes with an outer diameter of 100 μm. The aim
of the research is to clarify the feasibility of fabricating stents with diameters of less than 1 mm by
delineating precise multi-slit patterns on fine pipes. Using a laser scan exposure system, slit patterns with
widths of 11-29 μm were successfully delineated as fundamental stent patterns. At first, the exposure shutter
was opened just before the specimen was scanned. However, swells appeared at the pattern ends. For this
reason, exposure program was changed to open the shutter after starting the specimen scan. As a result,
swells were completely diminished. In addition to simple parallel slit patterns, alternatively positioned
parallel slit patterns were homogeneously delineated. Because the delineation speed of the investigated
method is not fast, an idea of scan projection lithography was also proposed. It is feasible to fabricate stents
if the pipes are etched using the resist patterns as etching masks continuing to the lithography.
1 INTRODUCTION
Catheters and stents have become very important
operation tools and medical components for low
invasive cures of diseased circular organs, blood
vessels, ureters, and others. Speaking on the stents,
net like structures with very complicated patterns
have been proposed and used. (Baichoo and Wong
Kee Song, 2014; Chandrasekhar et al., 2014;
Consentino et al., 2014; Hanada et al., 2013; Kumar
et al., 2013; Wang et al., 2014; Zhu et al., 2013)
Such structures were conventionally fabricated by
weaving fine wires or precisely cutting pipes by a
focused laser beam, and typical outer diameter were
2-3 mm.
It is considered that stents with finer diameters
for example 0.5-1 mm are also necessary in some
cases. However, it will be difficult to fabricate stents
with such fine diameters using the conventional
methods. For this reason, a new fabrication method
of fine-diameter stents is proposed here, and the
feasibility of the method is investigated.
In the new method, it is supposed that net-like
patterns of stents are delineated by laser scan
lithography onto fine stainless-steel pipes, and the
pipes are etched to stents. It has already been
demonstrated in past researches that various helical
patterns are surely delineated onto fine pipes or
wires with diameters down to several tens microns.
(Horiuchi and Sasaki, 2012)
However, it is necessary to delineate more
complicated patterns for fabricating net-like stents.
The stents need to have net-like features that can be
extended in the radial direction by a balloon inserted
in the stents. On the other hand, they need to have
appropriate rigidity for sustaining the compressive
forces from the diseased blood vessels and ureters.
Considering these backgrounds, patterning of
net-like patterns composed of many slit patterns
alternately allocated in parallel to the pipe axis is
investigated. To clarify the ultimate technological
feasibility, stainless steel pipes with outer and inner
diameters of 100 and 60 μm were used as specimens.
Although appropriate pipe diameters were 0.5-1 mm,
such fine pipes were used instead depending on the
limitations of exposure system.
2 LASER SCAN LITHOGRAPHY
SYSTEM
Laser scan lithography system for delineating
patterns on fine diameter pipes was developed in
2003 to fabricate various cylindrical micro-
components with outer diameters of less than 500
103
Horiuchi T., Sakabe H. and Kobayashi H..
Patterning of Multi-slits on Pipes for Developing Fine Diameter Stents.
DOI: 10.5220/0005202601030108
In Proceedings of the International Conference on Biomedical Electronics and Devices (BIODEVICES-2015), pages 103-108
ISBN: 978-989-758-071-0
Copyright
c
2015 SCITEPRESS (Science and Technology Publications, Lda.)
μm. (Joshima et al., 2004) The technology was
drastically improved by developing a new system in
which a specimen pipe was held in the vertical
direction. Specimen diameters were gradually
reduced, and the minimum diameter size was
reached to less than 50 μm. (Horiuchi and Sasaki,
2012) And, the system was used for fabricating
micro-coil springs to give contact pressure forces to
probe pins densely arrayed in circuit testers of
semiconductor devices and bio-devices. (Horiuchi et
al., 2012; Horiuchi et al., 2013)
Rotation
stage
Monitor
display
Linear up-and-
down stage
Chuck
Support
guide
XYZ stages
positioning
the guide
Specimen pipe
10X objective lens
Beam splitter
2X imaging lens
1X imaging lens
Beam-spot
i
Camera
Shutter
Pinhole
Violet
laser
Base plate
Pipe
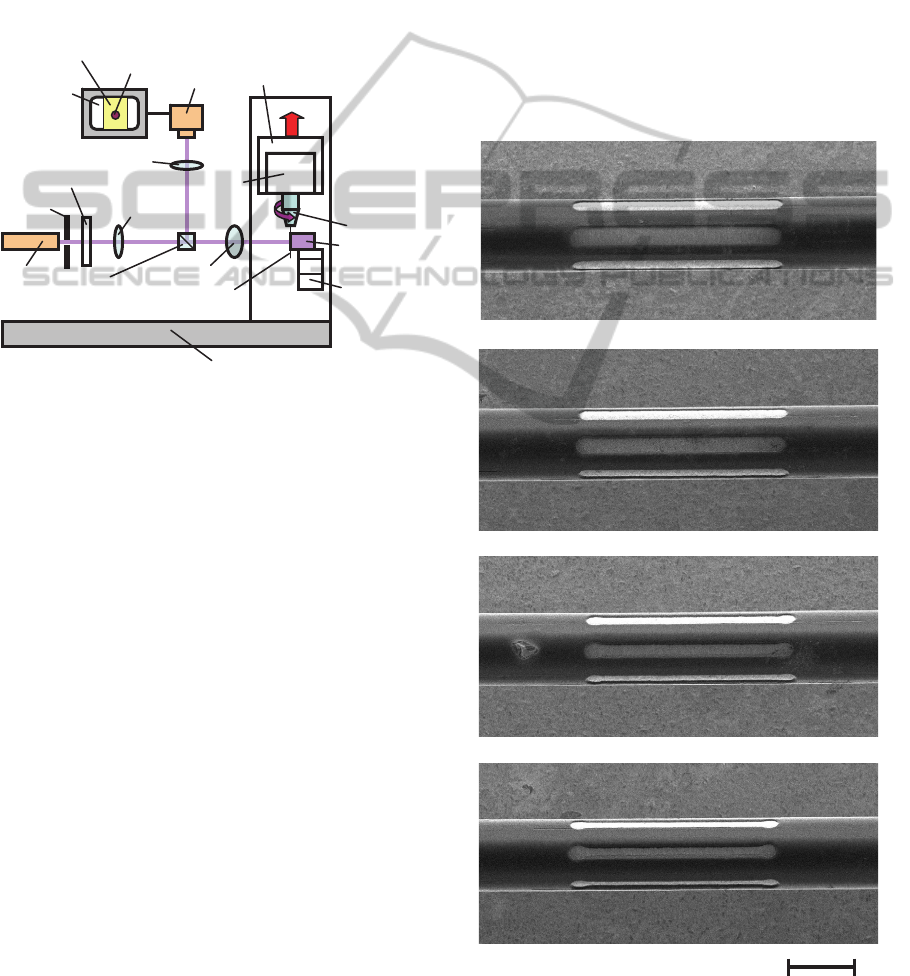
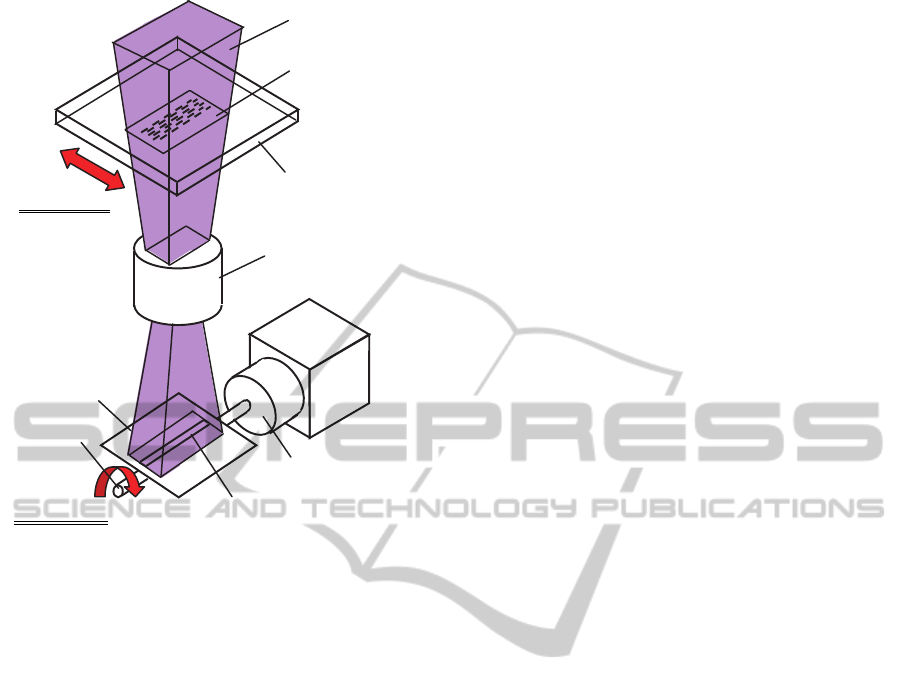
Figure 1: Fundamental structure of exposure system.
The fundamental structure of improved exposure
system is shown in Fig. 1. In the system, laser beam
is reshaped by a pinhole, and the light image of the
pinhole exit is projected onto the surface of
specimen pipe coated with a resist film. The
projection ratio of the optics was calculated to be
1/2×1/10=1/20 in total. The pipe specimen was
supported by a mechanical chuck equipped to a
rotation stage on an up-and-down stage, and scanned
to the laser beam. By moving the specimen pipe, the
resist film was scanned to the laser beam spot, and
sensitized. The exposure beam spot on the
specimen-pipe surface was monitored by projecting
it on a monitor display.
Slit patterns were delineated by vertical linear
scans of specimen pipes, and the specimen pipes
were intermittently rotated for delineating parallel
slit patterns one after another. As a resist, positive
PMER P LA-900PM (Tokyo Ohka Kogyo) was
used, and it was coated on the specimen pipes in
approximately 3 μm thick using the dip method.
(Joshima et al., 2004) This thickness was obtained
by drawing specimens up at a speed of 0.8 mm/s.
3 CONTROL OF PATTERN-END
PROFILES
3.1 Swelling of Pattern Ends
Laser scans were controlled using a mechanical
shutter, and open and shut operations were assigned
by computer programs. At first, slit patterns were
delineated according to the program that the
specimen scan in the vertical direction was started
just after the shutter was opened. Fig. 2 shows the
patterns obtained by above mentioned method. The
slit pattern length was 300 μm. It is known from the
figures that the slit pattern ends swelled according to
the increase of scan speed.
(a) 50 µm/s
(b) 100 μm/s
(c) 200 μm/s
(d) 300 μm/s 100 μm
Figure 2: Slit patterns delineated by starting the scan of
specimen pipe just after the shutter was opened.
BIODEVICES2015-InternationalConferenceonBiomedicalElectronicsandDevices
104
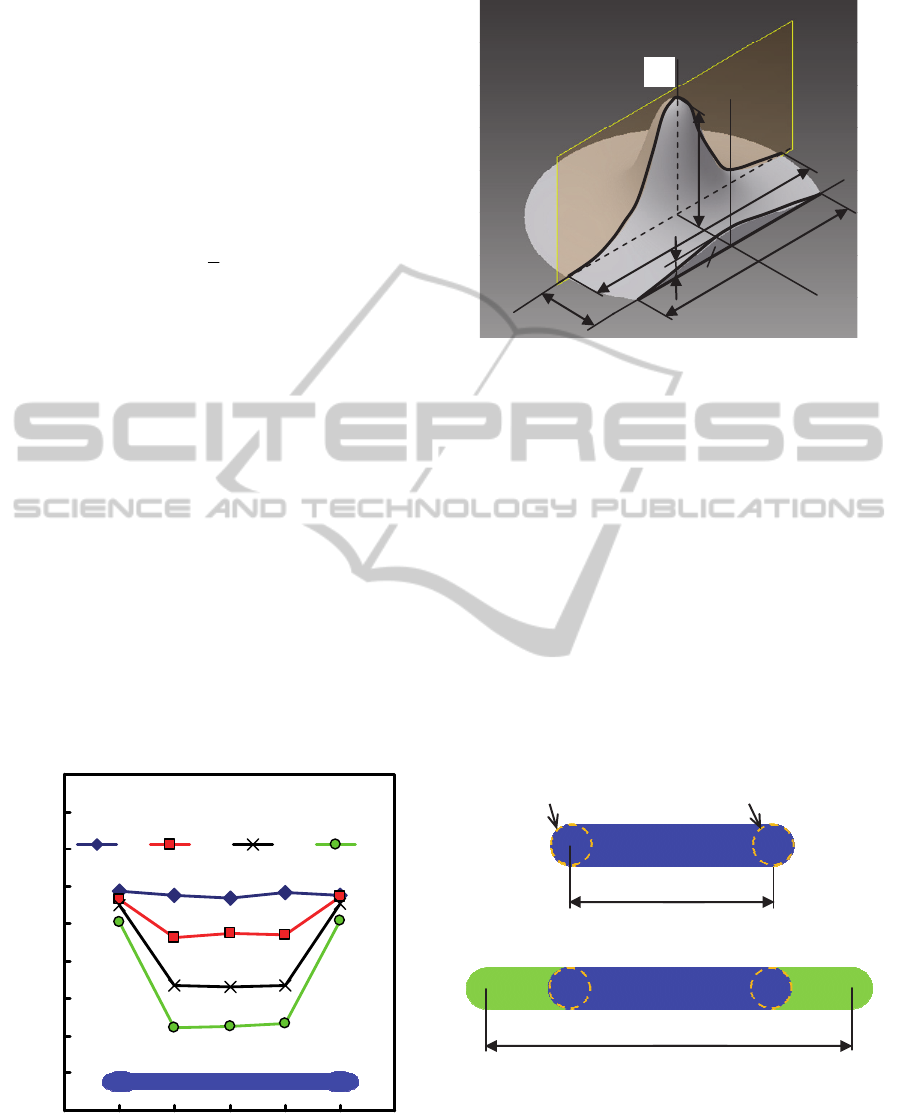
Fig. 3 shows width changes along the patterns. It
was clarified that the swells at the pattern ends
became notable when the scan speed was more than
100 μm/s.
It was considered that these swells of pattern
ends were caused by the difference between the light
beam intensity distributions of static spot exposure
and dynamic scan exposure. Distribution of single-
mode laser spot was roughly simulated by the
Gaussian curve expressed by eq. 1.
2
)(2
0
R
r
eII
(1)
Here, R is the beam radius and r is the radial
distance from the beam centre. It is supposed that
light intensity for the stopped spot exposures at the
start and terminal points distributes according to this
equation.
However, if the beam spot was scanned in x
direction, exposure dose at the distance y from the
centre line of the linear scan was decided by the area
size S
y
of the cross section of stereo beam intensity
profile in the direction parallel to the scan direction
x, as shown in Fig. 4.
The peak intensity I
y
at the distance y is the same
with that for the spot exposure, and estimated by eq.
1, if r is replaced by y. However, the cross section
profiles are different depending on y, because the
length L across the beam varies depending on y.
That is, the length L
0
at the centre is decreased to L
y
at the distance y. When y becomes large, L
y
steeply
decreases. Accordingly, S
y
steeply becomes small.
0
5
10
15
20
25
30
35
40
45
0123456
50 100 200 300
Measured
p
osition
Pattern width (μm)
Scan speed (μm/s)
Slit pattern
Figure 3: Width distribution of slit patterns delineated by
starting to scan the specimen pipe just after the shutter was
opened.
I
0
L
0
L
y
y
x
y
I
s
y
I
y
Figure 4: Figure for explaining parameters deciding the
exposure dose of linear scan.
Because the exposure dose is proportional to S
y
,
the dose also steeply decreases at the side
peripheries or at the places distant from the centre of
scan lines. For this reason, the light intensity across
the scan line distributes narrower than the static spot
exposure. Accordingly, slit pattern widths become
narrower than those at the pattern ends, and swells
of pattern ends are generated.
3.2 Improvement of Pattern Profiles at
Slit-pattern Ends
To improve swells at pattern ends, delineation
method was improved, as shown in Fig. 5.
(a) Beforeimproved.
Scan length
(b) Afterimproved.
Scan length
Beam position for
opening the shutter
Beam position for
closing the shutter
Figure 5: Improvement of timing for opening and closing
the shutter.
In the conventional method shown in Fig. 5(a),
the scan of specimen pipe was started just after the
shutter was opened
. On the other hand, in the
improved method, patterns were delineated by
PatterningofMulti-slitsonPipesforDevelopingFineDiameterStents
105
opening the shutter after the specimen pipes were
scanned, as shown in Fig. 5(b). As a result, linear
space patterns were delineated only by the genuine
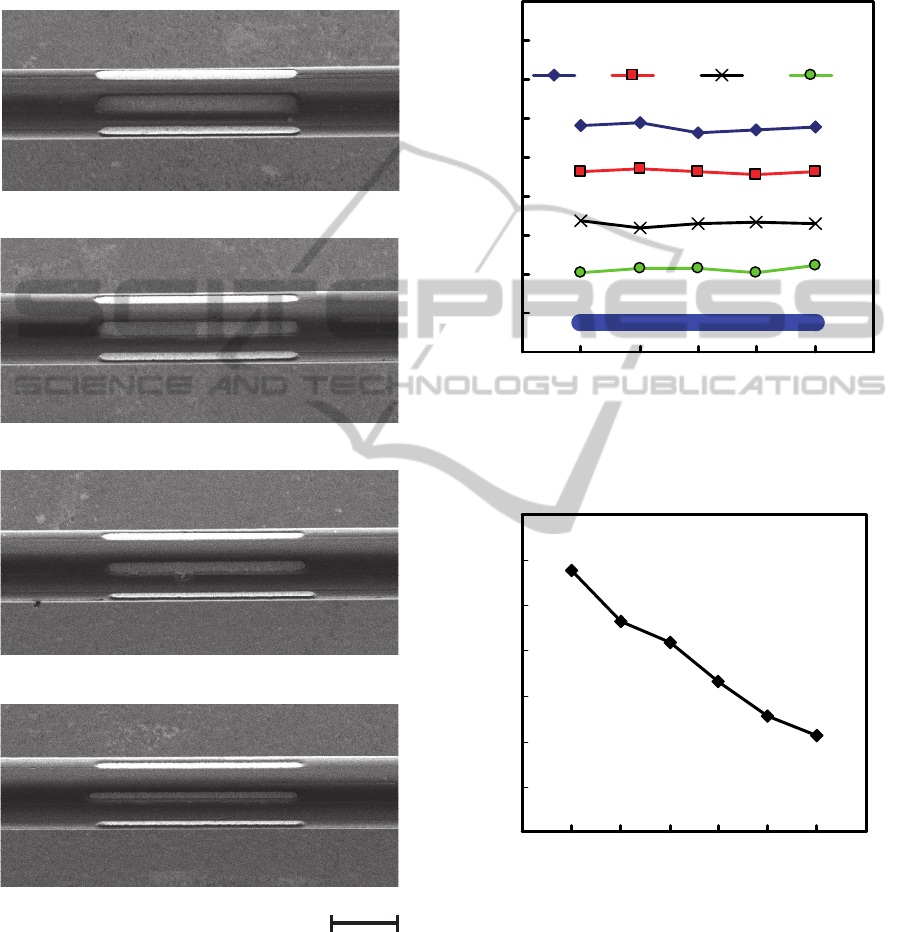
scan exposure. Results for the improved method are
exhibited in Fig. 6.
(b)100 µm/s
(c)200 µm/s
(
d
)
300
µ
m
/
s
100 μm
(a)50µm/s
Figure 6: Slit patterns delineated by opening and closing
the shutter during the scan of specimen pipes.
It was verified that swells at pattern ends were
almost diminished by adding above mentioned
approach and over scans. The width homogeneity is
shown in Fig. 7. It was demonstrated that the straight
space patterns with homogeneous widths were
obtained for various scan speeds. It was clarified that
the mean space-pattern widths were intentionally
changed by adjusting the scan speed in a wide range
of 11-29 μm/s, as shown in Fig. 8.
0
5
10
15
20
25
30
35
40
45
012345
6
50 100 200 300
Measured position
Pattern width (μm)
Scan speed (μm/s)
Slit pattern
Figure 7: Width distribution of slit patterns delineated by
opening and closing the shutter during the scan of
specimen pipes.
0
5
10
15
20
25
30
35
0 50 100 150 200 250 300 350
Scan speed (μm)
Paqttern width (μm)
Figure 8: Space-pattern width dependence on scan speed.
4 ALTERNATELY ALLOCATED
SLIT PATTERNS
Next, alternately positioned slit patterns were
delineated supposing the fabrication of net-like
stents. Slit pattern positions were shifted by a half
BIODEVICES2015-InternationalConferenceonBiomedicalElectronicsandDevices
106
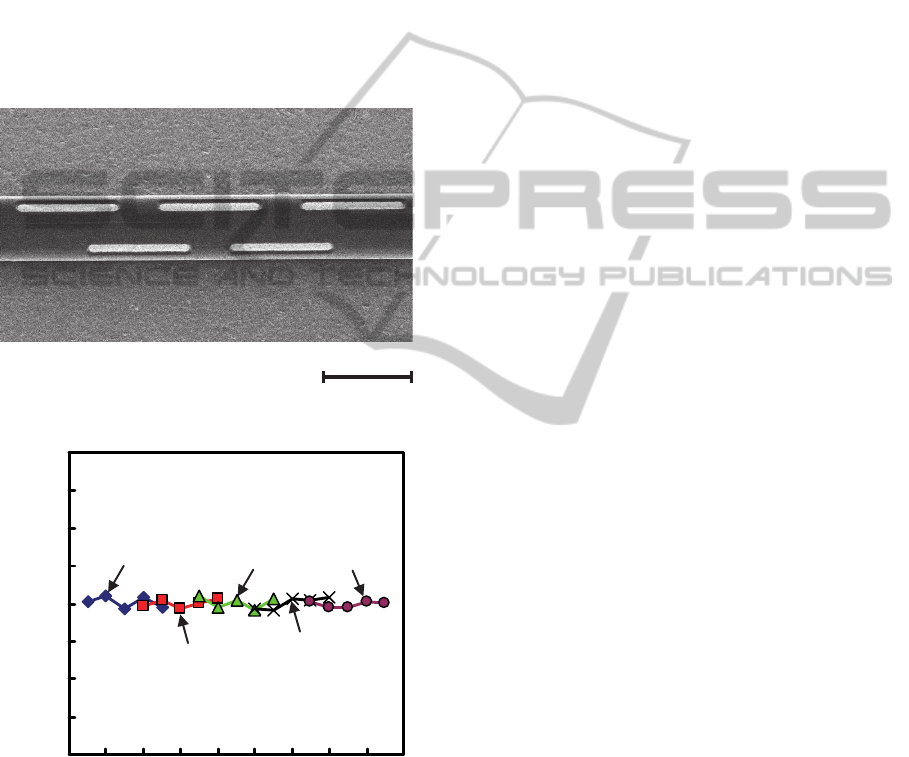
pitch in the axial direction for every 90° rotation of
the specimen axis. As a result, patterns shown in Fig.
9 were successfully delineated. Measured pattern
widths were almost homogeneous, as shown in Fig.
10. If these patterns were delineated on a long pipe
with appropriate diameters and the pipes were
etched similarly to the patterns, aimed stents would
be obtained.
It seems that the space-pattern widths are too narrow,
and the resist-pattern widths are too wide. However,
pipe walls are excessively etched according to the
undercut phenomena. For this reason, space widths
seem too narrow at a glance are probably
appropriate for etching the pipes.
100 μm
A
B
C
D
E
Figure 9: Alternately positioned slit patterns.
0
5
10
15
20
25
30
35
40
0 2 4 6 8 1012141618
A
B
C
D
E
Measured
p
osition
Pattern width (μm)
Figure 10: Width homogeneity of alternately positioned
slit patterns.
5 IDEAS FOR IMPROVING
PATTERNING SPEED
Slit patterning parallel to the specimen axis was
investigated. As a result, it was clarified that slit
patterns with widths between 11 and 29 μm were
successfully delineated, and pattern widths were
sufficiently homogeneous. However, because the
maximum delineation speed is 300 μm/s, it will take
a long time to delineate practical stent patterns. The
long patterning time is caused by the exposure
principle of the system shown in Fig. 1. Because
only one small laser spot is sequentially scanned on
whole specimen surface, it takes a very long time.
This time, pipe specimens with an outer diameter of
100 μm were used, and by precisely delineating fine
patterns even on such small diameter pipes,
technical difficulty in patterning processes were
almost cleared. The first reason why such fine pipes
were used is the diameter limitation of specimen
pipes attachable to the exposure system, and the
second reason is the too long exposure times for
delineating the slit patterns. Because the resist was
coated in the parts of 20-mm near the specimen-pipe
ends, it took approximately 18 mm / 300 μm/s = 600
s =10 min for delineating only one long slit pattern.
Accordingly, it took 10 min × 6 = 60 min = 1 h for
delineating only 6 long slits on a 100-μm pipe.
However, more complicated or larger volume
patterning is required on specimen pipes with larger
diameters of 0.5-1 mm. If such large diameter pipes
were used, the total exposure time would become 5-
10 h. Therefore, much faster exposure method is
necessary.
As an exposure system for such use, scan
projection exposure system shown in Fig. 11 will be
effective. Original patterns on a reticle are projected
onto a specimen pipe surface through a projection
lens. By inserting an oblong slit aperture above the
specimen, only patterns limited in a narrow region
are printed on the almost flat top-surface of the
specimen pipe. Therefore, the patterns are replicated
clearly without being defocused. In addition, if the
specimen pipe is rotated synchronously to linear
scan movement of the reticle, all patterns on the flat
reticle are printed on the whole cylindrical surface of
specimen pipe.
Because patterns in the oblong exposure field are
simultaneously printed on the specimen pipe, the
total exposure time becomes far shorter than the
laser scan lithography investigated here. Although
the exposure time depends on the width of oblong
slit, the light source power, and the optics for
collecting the exposure light, it will be less than 1
min for a pipe with a diameter of 1 mm.
PatterningofMulti-slitsonPipesforDevelopingFineDiameterStents
107
Opaque plate
Specimen pipe
Exposure light
Exposure field
Projection lens
Rotation stage
Slit
with a slit
Reticle
Linear scan
Rotary scan
Figure 11: Scan exposure system with a high throughput
using a lamp source and a reticle.
6 CONCLUSIONS
Slit pattern delineation on fine pipes were
investigated for developing precise stents with
diameters of less than 1 mm. As a result, fine slit
patterns with widths of 11-29 μm were delineated on
fine stainless steel pipes with outer and inner
diameters of 100 and 60 μm using 3-μm thick
positive resist PMER LA-900PM.
By adding approach and over scans and
controlling the exposure shutter appropriately,
swells at pattern ends were almost diminished. As a
result, slit patterns with homogeneous widths were
obtained. In addition to simple parallel slit patterns,
alternately allocated slit patterns were also
homogeneously delineated.
Because a little long delineation time was
anticipated, scan projection methods were also
proposed as a counter measure. It is feasible to
fabricate small diameter stents, if specimen pipes
masked by the resist patterns are precisely etched.
ACKNOWLEDGEMENTS
This work was partially supported by Grant-in-Aid
for Scientific Research (C) 26390040 from Japan
Society for the Promotion of Science.
REFERENCES
Baichoo, E. and Wong Kee Song, L. M., 2014. Palliative
enteroscopic stent placement for malignant mid-gut
obstruction. Gastrointestinal Intervention, 3(1), pp.
30-34.
Chandrasekhar, J., Allada, C., O’Connor, S., Rahman, M.,
Shadbolt, B., and Farshid, A., 2014. Efficacy of non-
compliant balloon post-dilation in optimization of
contemporary stents: A digital stent enhancement
study. IJC Heart & Vessels, 3, pp. 43-48.
Consentino, D., Zwierzak, I., Schievano, S., Diaz-
Zuccarini, V., Fenner, J. W., and Narracott, A. J., 2014.
Uncertainty assessment of imaging techniques for the
3D reconstruction of stent geometry. Medical
Engineering & Physics, 36, pp. 1062-1068.
Horiuchi, T., and Sasaki, R., 2012. New Laser-Scan
Exposure Tool for Delineating Precise Helical Patterns
onto Sub-50-Micron Wires, Jpn. J. Appl. Phys., 51,
06FL01, pp. 1-5.
Horiuchi, T., Ishii, H., Shinozaki, Y., Ogawa, T. and
Kojima, K., 2012. Novel Fabrication Method of
Microcoil Springs Using Laser-Scan Helical
Patterning and Nickel Electroplating. Jpn J. Appl.
Phys., 50, 06GM10, pp. 1-5.
Horiuchi, T., Sakabe, H., Yuzawa, T. and Yamamoto, D.,
2013. Fabrication of Straight Stainless-steel Micro-
coils for the Use of Biodevice Components. Proc. 6
th
International Conference on Biomedical Electronics
and Devices (BIODEVICES 2013), pp. 114-119.
Hanada, K., Matsuzaki, K., Huang, X., and Chino, Y.,
2013. Fabrication of Mg alloy tubes for biodegradable
stent application. Material Sci. and Eng. C 33, pp.
4746-4750.
Joshima, Y., Kokubo, T., and Horiuchi, T., 2004.
Application of Laser Scan Lithography to Fabrication
of Microcylindrical Parts. Jpn. J. Appl. Phys., 43, pp.
4031-4035.
Kumar, G. P., Cui, F., Danpinid, A., Su, B., Hon, J. K. F.,
and Leo, H. L., 2013. Design and finite element-based
fatigue prediction of a new self-expandable
percutaneous mitral valve stent. Computer-Aided
Design, vol. 45, pp. 1153-1158.
Wang, A., Eggermont, J., Dekker, N., Koning, P. J. H.,
Reiber, J. H. C., and Dijkstra, J., 2014. 3D assessment
of stent cell size and side branch access in
intravascular optical coherence tomographic pullback
runs. Computerized Medical Imaging and Graphics,
38, pp. 113-122.
Zhu, Y., Hu, C., Li, B., Yang, H., Cheng, Y., and Cui, W.,
2013. A highly flexible paclitaxel-loaded poly (ε-
caprolactone) electrospun fibrous-membrane-covered
stent for benign cardia stricture. Acta Biomaterialia, 9,
pp. 8328-8336.
BIODEVICES2015-InternationalConferenceonBiomedicalElectronicsandDevices
108
