Arousal Recognition Method using Electroencephalography Signals
to Construct Emotional Database
Yujun Niu
1
, Hao Zhang
2
, Shin’ichi Warisawa
1
, and Ichiro Yamada
1
1
Graduate School of Frontier Sciences, The University of Tokyo, 5-1-5 Kashiwanoha, Kashiwa, Japan
2
School of Engineering, The University of Tokyo, 7-3-1 Hongo, Bunkyo-ku, Tokyo, Japan
Keywords: Arousal Recognition, Electroencephalography (EEG), Discrete Wavelet Transform (DWT), Channel
Selection.
Abstract: Improving arousal recognition accuracy by using EEG signals is important for emotion recognition. In this
research, discrete wavelet transform is used to extract features, and a cross-level method is adopted to select
effective features. The cross-level method shows great potential for two-level arousal classification, and the
recognition accuracy reaches 91.8%. The sensitivity of EEG channels is also discussed based on two
ranking methods of SCP (single-channel performance) and ANOVA (analysis of variance). Finally, arousal
recognition method based on EEG signals is applied to construct a Japanese emotion database.
1 INTRODUCTION
Human emotion plays a significant role in daily life.
Effective communication requires both verbal
information and emotion. Sharing one’s emotions is
helpful as a way of understanding one’s true ideas.
In healthcare, emotion regulation is also very
important when dealing with certain diseases, like
mental disorders. Positive emotions have proved to
be effective to help patients recover from illness. For
human-computer interaction (HCI), analysis of
human emotion can help establish fluent
communication between computers and humans. For
this, emotion recognition can be used in various
fields in various ways.
Such importance has led to a lot of research on
analysis of human emotion in recent years. Based on
signal analysis, several kinds of signals have been
used to help study emotions. Previous studies show
that emotions are the result of cognitive processes
(Sander et al., 2005). Collected from the brain, EEG
signals can reflect brain activity and be used to
obtain emotion-related information. In this research,
EEG signals have been selected for arousal-related
study.
The selection of target emotions is another very
important issue in emotion recognition. A
six-emotion group consisting of happiness, anger,
disgust, surprise, fear, and sadness has been studied
by many researchers (Ekman et. al., 1972). In this
research, this emotion group is also used. For
emotion recognition, many models are available in
the field of affective computing. T. Musha (Musha
et al., 1997) used a four dimensional feature vector
to represent four kinds of emotions (joy, anger,
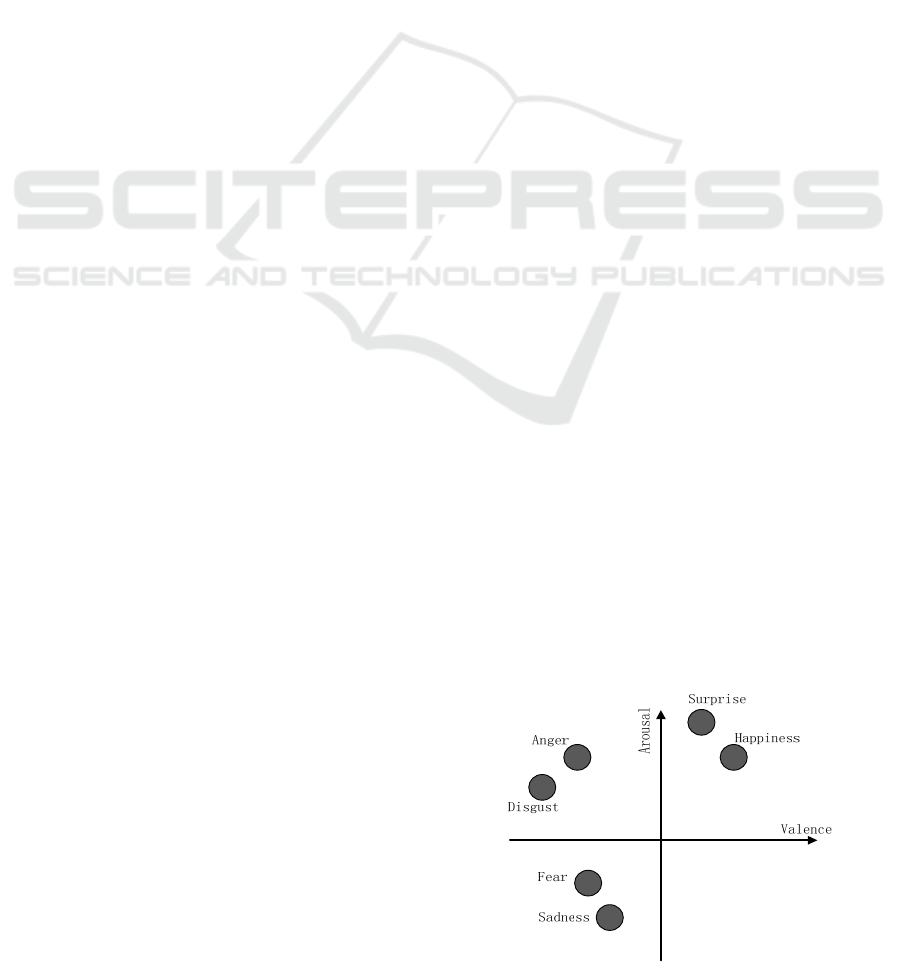
sadness, and relaxation). However, one of the most
popular models for emotion-related study is based
on the arousal-valence (A-V) space as shown in
Figure 1. Since this model was first proposed,
valence (positive and negative) and arousal (passive
and active) have been accepted by many researchers
to represent different emotions. It has been
developed a lot, and the relative positions of several
kinds of emotions have been studied (Russell, 1980).
Figure 1: Distribution of emotions on A-V space.
360
Niu Y., Zhang H., Warisawa S. and Yamada I..
Arousal Recognition Method using Electroencephalography Signals to Construct Emotional Database.
DOI: 10.5220/0005208403600366
In Proceedings of the International Conference on Health Informatics (HEALTHINF-2015), pages 360-366
ISBN: 978-989-758-068-0
Copyright
c
2015 SCITEPRESS (Science and Technology Publications, Lda.)

In the study of valence recognition, S. A. Hosseini et
al. adopted entropy analysis of EEG signals and
achieved a two-level valence recognition rate of
72.35% (Hosseini et al., 2011). With their proposed
cross-level feature selection method, H. Zhang et al.
improved the recognition accuracy to 98% for the
two-level model and 90% for the three-level model
(Zhang et al., 2014) and showed that cross-level
wavelet features are effective for valence
recognition. On the other hand, for arousal-related
studies, Y. Liu et al. used EEG signals collected
from 44 electrodes in an experiment. The two-level
recognition rate of arousal reached 76.51% (Liu et
al., 2012). In the experiment conducted by M.
Soleymani et al., 216 features were extracted from
the data collected with 32 EEG electrodes, and the
three-level recognition rate of arousal was 52.4%
(Soleymani et al., 2012). Although different methods
have been adopted in previous studies, effective
method for feature selection still puzzles a lot of
researchers. Moreover, arousal-related EEG
channels also need to be studied more. Previous
study with fMRI analysis shows that the arousal
recognition performance of the left and right
hemisphere of the brain is different, especially for
the occipital region (Lang et al., 1998). In
accordance with the experiment designed by L. I.
Aftanas et al., the right posterior area of the cortex
shows a greater relationship with arousal than other
areas (Aftanas et al., 2004). However, the result of H.
J. Yoon’s study indicates that EEG signals recorded
at the T7, T8, C3, and C4 electrodes can discern
arousal effectively (Yoon et al., 2011). Earlier
studies on the asymmetry function of the brain show
that arousal-related indices are more dependent on
the right than the left hemisphere (Lane et al., 1995;
Wittling, 1995).
2 AROUSAL RECOGNITION
PROCEDURE
2.1 Raw Signal Acquisition
The data used in this section is from the
IAPS-stimulated Japanese emotion database. In
constructing the database, pictures from the
international affective picture system (IAPS) were
used as stimuli while EEG signals being recorded
with 1 kHz sampling frequency. The subjects were
asked to refrain from blinking their eyes and the line
noise was filtered at 50Hz during the experiments in
order to reduce artifacts. Corresponding to each
picture, 10-second EEG signals were recorded in 16
channels: Fp1, Fp2, F3, F4, C3, C4, P3, P4, O1, O2,
F7, F8, T3, T4, T5, and T6 according to
International 10-20 system (Figure 2). In this
research, those channels were also remarked with
the number from 1 to 16.
Fp1 Fp2
F7 F8
T3 T4
T6T5
O1 O2
A2A1
F3 F4
C3 C4
P4P3
Cz
Fz
Pz
Figure 2: International 10-20 system (EEG).
2.2 Feature Extraction
To utilize EEG signals for arousal recognition,
seven-level DWT was applied on raw EEG signals.
With detail coefficients and approximation
coefficients decomposed, data from eight frequency
bands, 250-500 Hz, 125-250 Hz, upper γ (63-125
Hz), lower γ (31-63 Hz), β (16-31 Hz), α (8-16 Hz),
θ (4-8 Hz), and δ (0-4 Hz), were obtained from the
raw EEG signals. For the coefficients from each
DWT level, statistical features of standard deviation
(SD), mean, skewness, and kurtosis were extracted.
2.3 Feature Selection
To select sensitive features for arousal recognition,
mono-level and cross-level methods were adopted
and compared. Both methods focus on the selection
of effective frequency bands or DWT levels.
2.3.1 Mono-level Feature Selection
The same DWT level, from which features were
extracted, was selected for 16 electrodes. In this
method, one certain DWT level was chosen for all
channels depends on the performance of arousal
recognition. However, for different subjects, the
certain DWT level may be different.
ArousalRecognitionMethodusingElectroencephalographySignalstoConstructEmotionalDatabase
361
2.3.2 Cross-level Feature Selection
One DWT level, from which features were extracted,
was selected independently for 16 electrodes. In this
method, genetic algorithm was applied to select the
optimal DWT level group.
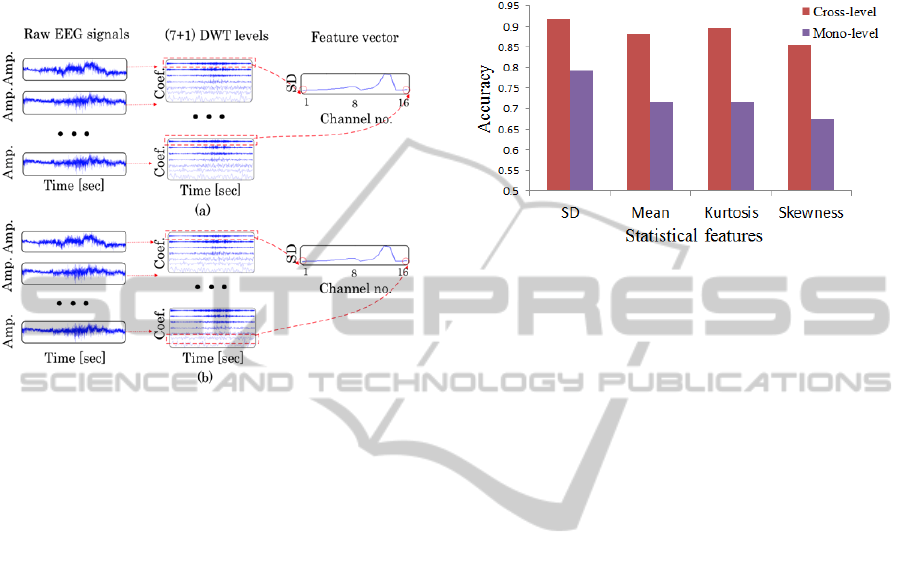
Figure 3: DWT level selection method. (a) Mono-level
method (the same DWT level is selected for all EEG
channels). (b) Cross-level method (different DWT levels
are selected for different EEG channels).
Figure 3 shows a schematic of the DWT level
selection method (mono-level method and
cross-level method). After selecting DWT levels, a
statistical feature such as SD was extracted from the
selected DWT levels. Then, a feature vector was
constructed by using the statistical features of 16
channels.
2.4 Classification
In this research, a subject-dependent model was
applied. The arousal recognition accuracy for each
subject was obtained based on the leave-one-out
cross-validation with Probabilistic neural network
(PNN). EEG signals (1000 samples) collected from
50 healthy Japanese subjects (35 males and 15
females) are used for the validation.
2.5 Results and Discussion
The result of two-level arousal recognition is shown
in Figure 4. Compared with other statistical features,
SD performed the best with an average accuracy of
91.8%. Moreover, cross-level feature selection
showed greater potential than mono-level feature
selection. With cross-level feature selection, the
average accuracy was always higher than that of
mono-level feature selection for all the statistical
features.
For three-level arousal recognition, with the
cross-level method and SD extracted as a feature, the
average accuracy reached 73.4%.
Figure 4: Two-level arousal recognition accuracy for
applying mono-level and cross-level methods on DWT
level selection.
3 EEG CHANNEL SELECTION IN
AROUSAL RECOGNITION
Arousal-related EEG channels are also discussed in
this research. To study the optimal channel groups
for arousal detection, two methods (SCP and
ANOVA) were applied to obtain the ranking of the
16 channels, and it will be used to select the optimal
channel groups and common channels.
3.1 Single-Channel Performance (SCP)
Similar to the procedure used for the cross-level
method, the seven-level DWT and PNN were
adopted to compute the SCP. However, the input
signal was not from 16 channels but from one
channel. In this way, one feature from a certain
DWT level was selected instead of the feature vector
mentioned in Figure 3. The output accuracy from the
PNN classifier could show the sensitivity of the
channel for arousal recognition. In accordance with
the results from each channel, the SCP ranking of
the whole channel was calculated for each subject.
3.2 Analysis of Variance (ANOVA)
ANOVA was applied to the EEG signals of 10
pictures for each level. Those signals were assigned
to 10 groups. Such assignment was conducted based
on the arousal values of the corresponding pictures.
In this research, three cases were considered:
HEALTHINF2015-InternationalConferenceonHealthInformatics
362
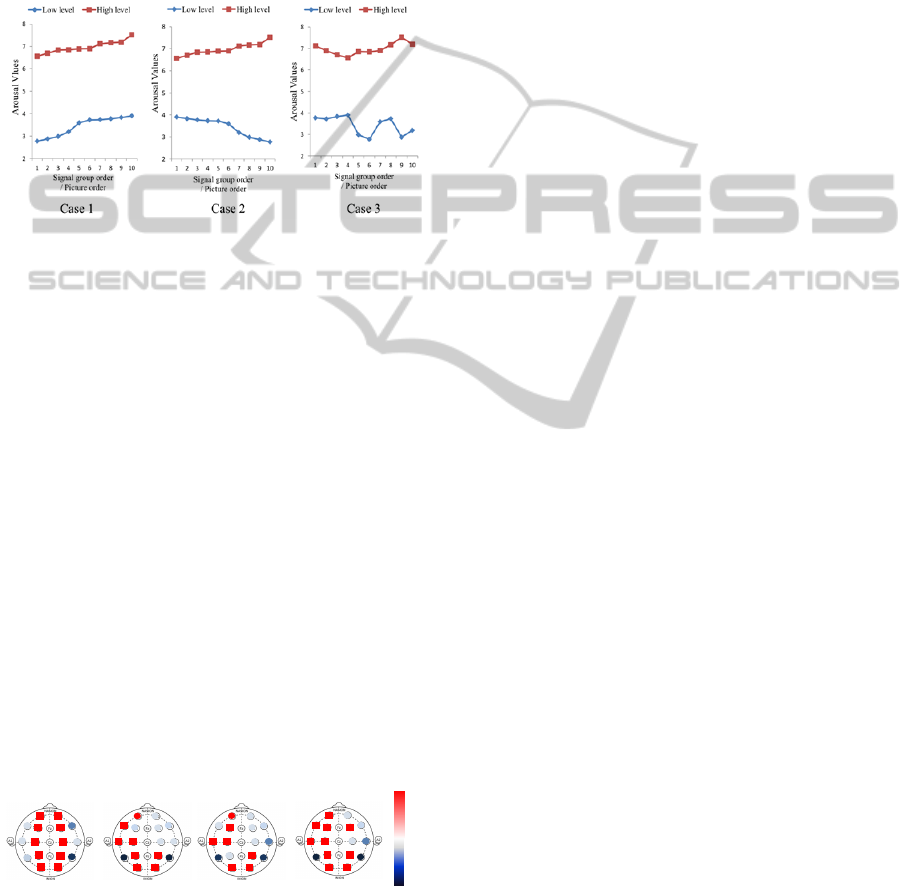
Case 1: The EEG signals in each arousal level
were sequenced in ascending order of
arousal values.
Case 2: The ascending order was adopted for the
high arousal level, but the descending
order was adopted for the low arousal
level.
Case 3: A random order was adopted for each
arousal level.
Figure 5: Order of EEG signals in three ANOVA cases.
Signals with the same order in each level are
assigned to the same group. Seven-level DWT was
also applied to help decompose the raw signals.
With the significance in the computing set to 0.05,
ANOVA was applied to the same coefficients (detail
and approximate) from both the high arousal signal
and the low arousal one, and the results are the sum
of 10 groups for each DWT level. The result from
the DWT level that achieved the highest score was
used as the final ANOVA confidence. Thus, an
ANOVA ranking of 16 channels could be
established. In this way, besides the SCP ranking,
the other three rankings were obtained from Case 1,
Case 2, and Case 3.
3.3 Common Channels
Statistical analysis was conducted on these four
rankings (from SCP and ANOVA), and a sensitive
score was computed for each channel (Figure 6).
0
200
-200
ANOVA Case 1 ANOVA Case 3ANOVA Case 2
SCP
Figure 6: Sensitive score of 16 channels based on SCP and
ANOVA. Higher score in positive direction (red) means
more sensitive to arousal.
Considering the similar results of three cases from
the ANOVA method, ANOVA Case 1 was used for
the latter analysis.
In accordance with Figure 6, three areas of
channels show higher sensitivity than other
channels: Channel Fp1 in the left front area, Channel
C3 in the left temporal area, and Channel O1, O2, P4
in the posterior of the cortex. Such a finding is partly
compatible with the conclusions from previous
neuroscience studies mentioned in the introduction
(Aftanas et al., 2004; Yoon et al., 2011). From the
sensitive performance for 50 subjects, the common
channels, including Fp1, C3, O1, O2, and P4 proved
to be effective in arousal recognition and will be
used in the latter section of this research.
3.4 Optimal Channel Groups
Different from common channels, the optimal
channel groups were defined based on the
accuracy-oriented rules. In accordance with the
rankings of SCP and ANOVA, arousal recognition
performances were computed for channel groups of
1 channel to 16 channels, and the results indicate
that 10-channel group achieved the highest accuracy
for most subjects in two-level arousal recognition.
The first 10 highest ranking channels were selected
for each subject, as the optimal channels, to achieve
higher recognition accuracy.
3.5 Arousal Recognition Performance
for Different EEG Channel Sets
As the last part of channel selection, two-level
arousal recognition performance was computed for
further discussion on different EEG channel sets
(Figure 7). For SCP and ANOVA, ten EEG channels
were selected according to their rankings.
The important channel sets in Figure 7 are the
optimal channels and common channels. In the case
of common channels, with EEG signals from only 5
channels, two-level arousal recognition accuracy is
similar to that of 16 channels. Therefore, the
common channels are suitable for database
validation.
The optimal channels raise arousal recognition
accuracy by about 4% compared to the common
channels with p<0.001 by paired t-test. Considering
the performance for two-level arousal recognition,
such subject-dependent optimal channel information
was used to help select the typical emotional data.
ArousalRecognitionMethodusingElectroencephalographySignalstoConstructEmotionalDatabase
363
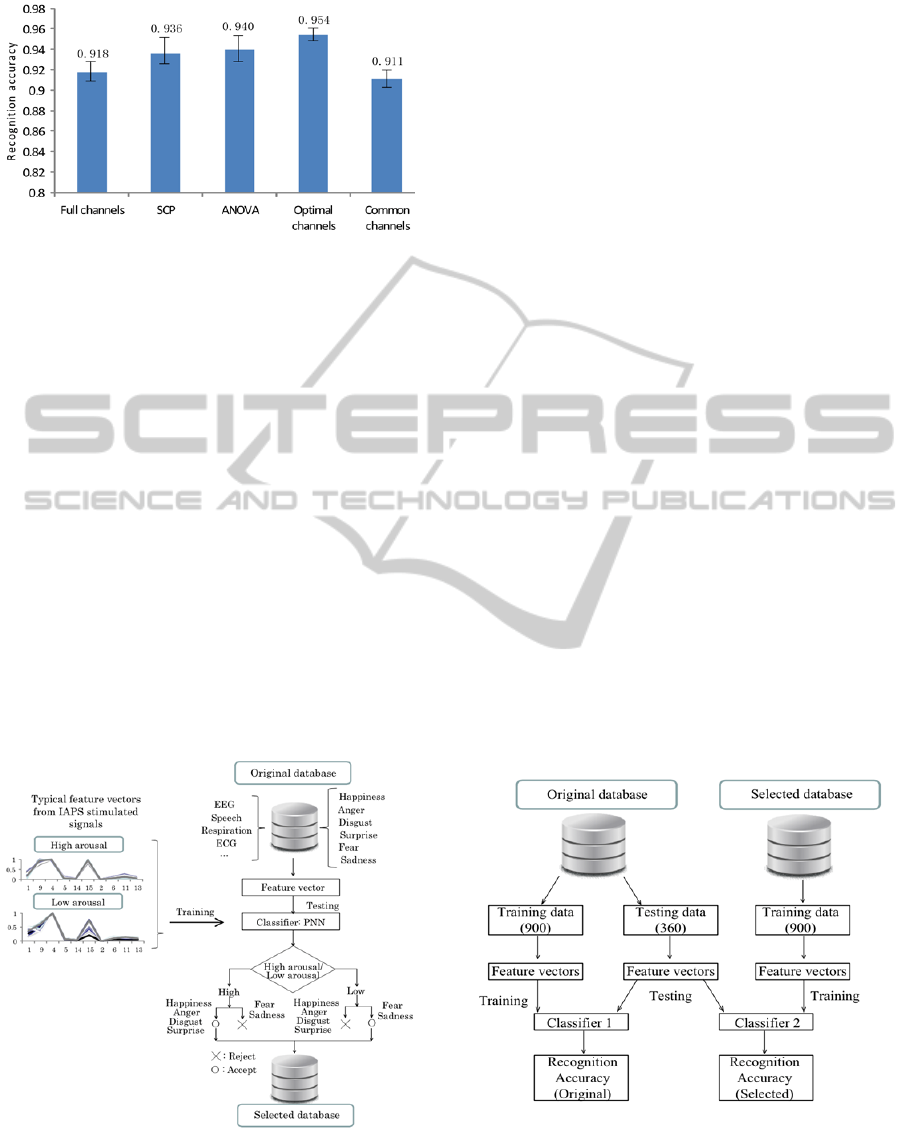
Figure 7: Two-level arousal recognition accuracy for
different EEG channel sets.
4 DATABASE VALIDATION
Database validation was applied to the Japanese
emotion database (original database in Figure 8), of
which emotional signals were induced by self-recall
experience by each subject. Database validation
consists of two steps: selecting good data from the
original database and evaluating the quality of the
selected database. An EEG-based database
validation method is proposed in this research by
using the results of former sections.
4.1 Data Selection
With the optimal channel information, including
optimal channels and the corresponding effective
DWT levels, data selection was conducted as shown
in Figure 8.
Figure 8: Procedure of data selection.
In accordance with the channel information, the
typical feature vectors for both high arousal and low
arousal were obtained for training the two-level
PNN classifier. A similar process was also
conducted on the testing EEG signals from the
original database. After 0-1 normalizing and
extracting a feature vector from testing EEG signals,
the feature vector was input to the PNN. Based on
the distribution of emotions in A-V space, six
emotions could be classified into two arousal levels.
If the classification results of PNN met the arousal
level of A-V space, the signal was believed to be
good and was accepted for constructing the selected
database. By applying this selection method, about
half of the data were accepted to the selected
database from the original database.
4.2 Evaluation of Database Quality
The two-level arousal recognition method was used
for evaluating the quality of the selected database.
360 pieces of signals, 60 for each emotion, were
selected randomly from the original database to be
used as testing signals. Another 900 pieces of signals
were selected separately from the original database
and the selected database to train the PNN classifier.
As the first step in processing those signals, EEG
signals recorded in five common channels (Fp1, C3,
O1, O2, and P4) were decomposed by seven-level
DWT. Then, standard deviation (SD) was extracted
from each frequency component (DWT level). Using
the PNN as a classifier, the recognition accuracy for
each emotion was collected as the evaluation results
(Figure 9).
Figure 9: Procedure of database evaluation.
To reduce the effect of bias selection of data, the
procedure illustrated in Figure 9 has been repeated
ten times, and the average results were calculated
and shown in Figure 10.
HEALTHINF2015-InternationalConferenceonHealthInformatics
364
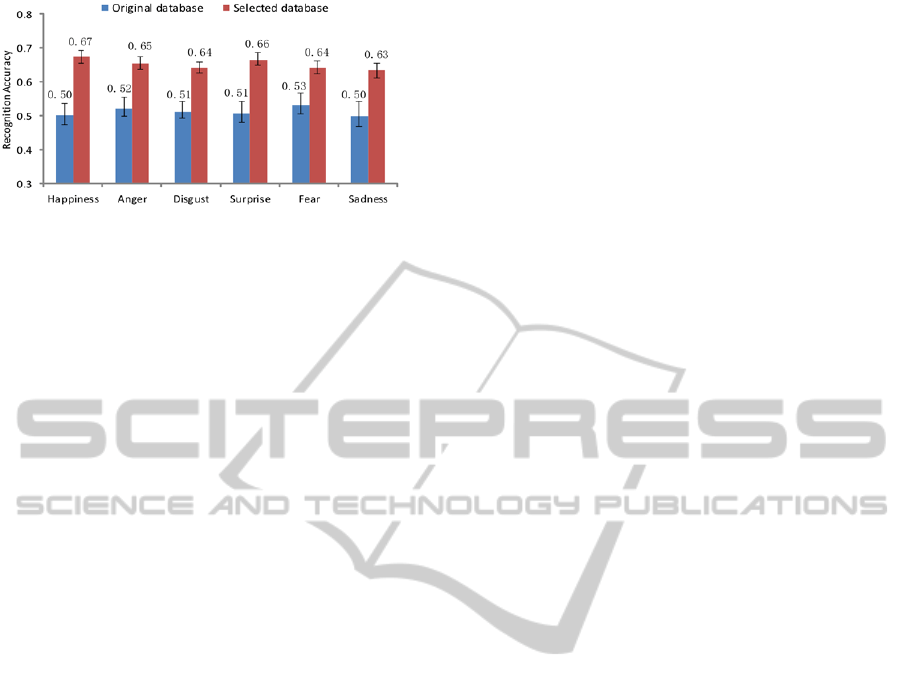
Figure 10: Recognition accuracies using original and
selected databases.
The recognition accuracy can be regarded as
reflecting the quality of the corresponding training
database. As shown in Figure 10, a great difference
in two-level arousal recognition performance
appears among these two databases. The quality of
the selected database is obviously higher than that of
the original database. Such a result also proves that
the EEG-based data selection method is an effective
way to improve the quality of an emotion database.
5 CONCLUSION AND FUTURE
PERSPECTIVES
In this research, we carried out arousal-related
studies on EEG signals because they are an
important area of affective computing. Firstly, by
applying a cross-level feature selection method and
the optimal channel groups, the recognition accuracy
for two-level arousal recognition has been improved
to 95.4%, which is better than the results from the
full channel test. Adoption of the optimal channel
groups shows that the individual difference in EEG
signals is very large.
Secondly, the discussion on common channels is
fulfilled based on two rankings of SCP and ANOVA.
Common channels also show a good performance of
91.1%. The 5-channel group provides some ideas for
further study on arousal-related sensitive channels.
Finally, in database validation, an EEG-based
data selection method is useful to select the typical
emotional data from the original database. And this
method has been proved to be effective by
evaluating the quality of the selected database.
However, there are still some points that need to
be studied:
1. Other arousal-related features. In this research,
four kinds of statistical features for detecting
arousal status were discussed. However, there
are still other features that we did not mention.
2. For common channels, 5 channels are simply
selected out of 16 channels. However, the other
channel combinations were not studied.
REFERENCES
Aftanas, L. I., Reva, N. V., Varlamov, A. A., Pavlov, S. V.,
& Makhnev, V. P. 2004. Analysis of Evoked EEG
Synchronization and Desynchronization in Conditions
of Emotional Activation in Humans: Temporal and
Topographic Characteristics. Neuroscience and
Behavioral Physiology. 34(8). pp.859-867.
Ekman, P., Friesen. W. V., & Ellsworth. P. 1972. Emotion
in the human face: Guidelines for research and an
integration of findings. New York: Pergamon Press.
Hosseini, S. A., & Naghibi-Sistani. M. B. 2011. Emotion
recognition method using entropy analysis of EEG
signals. I. J. Image, Graphics and Signal Processing.
3(5). pp.30-36.
Lane, R. D., & Jennings, J. R. 1995. Hemispheric
asymmetry, autonomic asymmetry, and the problem of
sudden cardiac death. In R.J. Davidson, & K. Hugdahl
(Eds), Brain asymmetry. pp. 271-304. Cambridge,
MA: MIT Press.
Lang, Peter J., Bardley, Margaret M., Fitzismmons,
Jeffrey R., Cuthbert, Bruce N., Scott, James D.,
Moulder, B., & Nangia, V. 1998. Emotional arousal
and activation of the visual cortex: An fMRI analysis:
Psychophysiology. 35. pp. 199-210.
Liu, Y., & Sourina, O. 2012. EEG-based Valence Level
Recognition for Real-Time Applications. International
conference on Cyberworlds. pp.53-60.
Murugappan, M., Rizon, M., RNagarajan, Yaacob, S.,
Zunaidi, I., &Hazry, D. 2007. EEG Feature Extraction
for Classifying Emotions using FCM and FKM.
International Journal of Computers and
Communications. 2(1). pp. 21-25.
Musha, T., Terasaki, Y., Haque, Hasnine A., & Ivanitsky,
George A. 1997. Feature Extraction from EEGs
Associated with Emotions. Artif Life Robotics. 1(1).
pp.15-19.
Russell, James A. 1980. A Circumplex Model of Affect.
Journal of Personality and Social Psychology. 39(6).
pp.1161-1178.
Sander, D., Grandjean, D., & Scherer, K. R. 2005. A
systems approach to appraisal mechanisms in emotion.
Neural Networks. 18. pp. 317-352.
Soleymani, M., Lichtenauer, J., Pun, T., & Pantic, M.
2012. A Multimodal Database for Affect Recognition
ArousalRecognitionMethodusingElectroencephalographySignalstoConstructEmotionalDatabase
365

and Implicit Tagging. IEEE Transactions on Affective
Computing. 3(1). pp.42-55.
Wittling, W. 1995. Brain asymmetry in the control of
autonomic-physiologic activity. In R.J. Davidson, & K.
Hugdahl (Eds), Brain asymmetry. pp. 305-357.
Cambridge, MA: MIT Press.
Yoon, H. J., & Chung, S. Y. 2011. EEG Spectral Analysis
in Valence and Arousal Dimensions of Emotion. 11th
International Conference on Control, Automation and
Systems. pp.1319-1322.
Zhang, H., Warisawa, S., & Yamada, I. 2014. Emotional
Valence Detection based on a Novel Wavelet Feature
Extraction Strategy using EEG signals. 7th
International Conference on Health Informatics.
pp.52-59.
HEALTHINF2015-InternationalConferenceonHealthInformatics
366
