
Strategic Planning of Hospital Service Portfolios
The DRGee Viewer
Dominique Brodbeck
1
, Markus Degen
1
, Andreas Walter
2
, Serge Reichlin
3
and Christoph Napierala
4,5
1
University of Applied Sciences and Arts Northwestern Switzerland, Basel, Switzerland
2
Inselspital, Bern University Hospital, Bern, Switzerland
3
University Hospital Basel, Basel, Switzerland
4
University of Lucerne, Luzern, Switzerland
5
Siemens Schweiz AG, Z
¨
urich, Switzerland
Keywords:
Strategic Hospital Planning, DRG, Visual Analytics.
Abstract:
In 2012 inpatient financing for hospitals in Switzerland was changed from a system based on cost per case
to a system based on a fixed fee per case. The fixed-fee model makes medical services comparable from
a financial point of view. Characterizing medical service portfolios in this way, creates large amounts of
high-dimensional data. In order to operationalize this information and use it as a factual basis for decision
support, we developed a visualization tool and a methodology to support strategic planning of hospital service
portfolios. The method centers around a visual metaphor that provides the basis for strategic thinking. It is
complemented by a visualization tool that allows visualization, analysis, and modification of service portfolios.
Extensive support is provided for visual comparison of different scenarios. Special features enable the tool to
be used during live planning sessions. The system was used in strategy workshops in over forty hospitals, and
has contributed to infrastructure planning, reorganization, and resource optimization decisions.
1 INTRODUCTION
The Swiss healthcare system is continuously under-
going change since the implementation of the new
Swiss health insurance law in 1996. Most signifi-
cantly, in 2012 inpatient financing was changed from
a system based on cost per case to a system based on a
fixed fee per case. Such a significant change has a far-
reaching impact on the overall system, especially on
the hospital sector. Hospital management, but also na-
tional and regional policy makers, are forced to plan
and manage in different dimensions than before.
The idea behind a fixed-fee model is that hos-
pital cases can be classified into groups of similar
cases, and that these groups can then be treated like
products that are comparable, and that are reimbursed
with the same fixed amount of money, because it
is assumed that they have the same cost structure.
The classification rules are based on diagnoses, medi-
cal procedures, demographic patient information, and
other case-specific data. The combination of all these
groups, or products, makes up the medical service
portfolio of a hospital. This comparability of medi-
cal intervention from a financial point of view is new
and opens a variety of new possibilities. In particu-
lar, it allows policy makers and hospital management
to make decisions based on factual information from
the analysis of current service portfolios, as well as
the simulation of medical service portfolios into the
future. Such flexible analysis possibilities are crucial
to make sound infrastructure decisions that will meet
patient needs in the next years.
Characterizing and comparing service portfolios
in such a way quickly produces large amounts of
high-dimensional data. The portfolios need to be vi-
sualized, compared, interpreted, and modified by an-
alysts, as well as by groups of managers in live work-
shop settings. Common spreadsheet programs are too
general to cover these tasks well. In order to take full
advantage of the possibilities offered by the new reim-
bursement system, there is a need for tools that allow
the various stakeholders to analyze and communicate
the data in a flexible and efficient way.
This paper describes a method and a correspond-
ing visualization tool that supports management lev-
els in discussing strategic decisions and future devel-
82
Brodbeck D., Degen M., Walter A., Reichlin S. and Napierala C..
Strategic Planning of Hospital Service Portfolios - The DRGee Viewer.
DOI: 10.5220/0005210100820090
In Proceedings of the International Conference on Health Informatics (HEALTHINF-2015), pages 82-90
ISBN: 978-989-758-068-0
Copyright
c
2015 SCITEPRESS (Science and Technology Publications, Lda.)

opments based on current restrictions and conditions.
2 BACKGROUND
Diagnosis-related groups (DRGs) is a patient classifi-
cation system that links similar types of cases that a
hospital treats, to the resources that the hospital uses
for the treatment. DRG systems were pioneered in
the USA, but are now in use in many other countries
(Schrey
¨
ogg et al., 2006).
The SwissDRG system is a variation of German
DRG but refers to Swiss reference values (Swiss
DRG, Web). Like in all DRG systems, single cases
are classified into a specific class according to their
diagnoses (using ICD10), treatment types (e.g. hip
surgery), and other case attributes. Each group has a
unique code, which enables a precise attribution of a
case’s revenues to its costs. This results in a shift from
a more cost-oriented daily allowance to a product-
oriented view, where optimal management along the
patient pathway gains in relevance (e.g. in (Gocke
et al., 2002) and (Rohner, 2012)). This shift opens
the potential for providing a basis for evidence-based
decisions in an operative and above all in a strategic
perspective.
The dimensions of interest for strategic analysis
are: average length of stay, cost weights, and the over-
all base rate. The average length of stay (ALOS) is
used in a DRG system as an output measurement for
complexity of the case (Luke, 1979). The other di-
mension is the cost weight, a relative indicator for
the severity of the case, which serves as a measure
for resource intensity. Cost weight is recalculated ev-
ery year based on cost data provided by hospitals to
the Case Mix Office (i.e. SwissDRG in Switzerland).
Each DRG is assigned specific values for these two in-
dicators, and all the values for all the DRGs are stored
in a reference catalog.
The base rate (which is basically determined by
negotiation between the hospital and insurance com-
panies) is multiplied with the cost weight attribute to
determine the monetary value of a case that is clas-
sified into a particular DRG. Besides revenues from
private insurance and specialized pharmaceuticals or
technologies for special treatments (e.g. specialized
oncological treatments) these revenues represent the
main income that a hospital can generate from their
patients.
As theoretically the cases behind any DRG code
should on average represent similar cases in each hos-
pital, these elements make hospitals comparable and
allow a benchmark-oriented approach. Comparisons
can be achieved by using one hospital’s cases, and
then comparing them either with the reference values
of the DRG catalog, or to the portfolio of a peer hos-
pital, both at the service and at the cost level. Most
importantly, this allows comparing the efficiency of
hospitals, but it will also enable quality or other as-
sessments.
The services that a hospital offers are influenced
by many factors. In most administrative districts (i.e.
in our Swiss case corresponding to cantons), service
portfolios or service requirements are defined by pol-
icy makers. However not all districts decide to pro-
vide a full scope of medical services, but might del-
egate the remaining activities to other providers that
can be situated beyond their control or area of di-
rect responsibility. This is complicated by the fact
that with the new reimbursement system, patients also
gained the freedom to choose their hospital of treat-
ment independently of their canton of residency.
On top of that, there are a number of national poli-
cies that impose further restrictions, e.g., the highly
specialized medicine act that restricts the number of
centers for very complicated treatments, or the chang-
ing outpatient health care provision that still heav-
ily depends on resident physicians, who are however
overaged and struggle to find replacing practice hold-
ers. All these factors push hospitals towards stratify-
ing patient portfolios and focusing on selected medi-
cal areas, in order to improve their economic situation
actively.
Modern hospitals must engage in strategic discus-
sions about visions, cooperations, specialization, cen-
tralization and further infrastructure or organization-
ally relevant questions. These decisions affect their
market position and help them to cope with growing
and dynamic competitors both at administrative dis-
trict or regional levels.
For example, hospitals that today provide maxi-
mal service levels, will have to decide whether they
will focus on more specific therapies that generate
high cost weights (L
¨
ungen and Lauterbach, 2002), or
whether they will continue offering a broad range of
health care services, focusing on a me-too strategy.
The analysis of pancreas and esophagus carci-
noma surgery in Germany as another example has
shown that it can be highly beneficial for hospitals to
treat a high number of benign cases instead of focus-
ing on the malign cases with high cost weights but bad
average length of stay management. This is the case
even if the minimal numbers are reached that would
be required by the official rules and regulations.
Ultimately, Swiss hospitals will have to adapt their
current management models. In order to take the right
decisions in this complex environment, hospital man-
agers need to rely on data, and models that are based
StrategicPlanningofHospitalServicePortfolios-TheDRGeeViewer
83
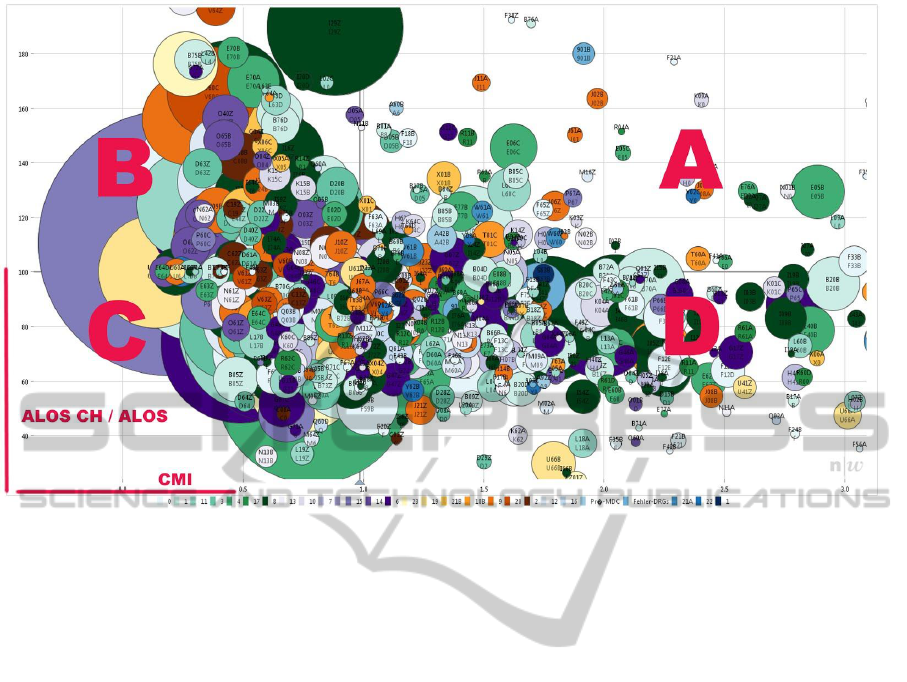
Figure 1: The visual metaphor of the strategic model: a bubbleplot that plots the case mix index (CMI) of a medical service
vs. how well the length of stay compares to the country average (ALSO CH / ALOS). This creates four quadrants A, B, C,
and D, with different strategic interpretations. The size of the bubble is proportional to the case count for this service. The
color shows Major Diagnostic Category MDC.
on that data. Collecting the data is usually not a prob-
lem anymore, as modern hospital information systems
are well equipped for that job and are commonly in
use today. Projecting the data into the strategic mod-
els and operationalizing it however, requires new ap-
proaches.
3 METHODS
3.1 Strategic Model
As outlined above, the key dimensions of a hospital
case are its cost weight - as determined by the DRG
into which the case was classified - and the length of
stay. Since the analysis of individual cases is too low-
level for the kind of strategic questions that need to
be supported, the cases are aggregated into groups ac-
cording to their DRG code. These groups can be con-
sidered as the services that a hospital performs.
Working with inpatient service portfolios from
various hospitals of various sizes, types, and different
geographic areas has shown that plotting the normal-
ized average of the cases’ cost weights (also called
case mix index CMI) of such a service, versus the
deviation of the average of the lengths of stay (also
called ALOS) from the DRG catalog reference (CHA-
LOS), produces a graph that is easy to interpret in the
context of strategic questions (Figure 1). Each ser-
vice is plotted as a bubble with the size of the bub-
ble proportional to the number of cases, and the color
mapped to any of the other available service attributes
(e.g. Major Diagnostic Category MDC, profit, cost,
department) depending on the focus of the analysis.
The plot can be separated into four quadrants that
each have a distinct strategic meaning, similar to the
BCG growth-share matrix used in a strategy or mar-
keting context (Boston Consulting Group, Web). This
allows to analyze the strategic positioning of a hospi-
tal’s inpatient portfolio using the four quadrants (A-
D). The quadrants have the following interpretation:
Quadrant A represents the area where the
grouped cases generate on average a high cost weight,
and result in an average length of stay that is better
(i.e. shorter) than the DRG catalog value. We there-
fore expect the bubbles in this quadrant to be prof-
itable and to represent the services where the hospitals
portfolio performs better than the benchmark. Strate-
gically, these activities support the hospital in creating
a brand, where the hospital can distinguish itself for
quality and performance, and thus should aim at in-
creasing case numbers and building relationships to
referring medical doctors. Further options could be to
HEALTHINF2015-InternationalConferenceonHealthInformatics
84

create a good infrastructure that would attract above-
standard surgeons, and centralize the activities of sur-
rounding hospitals in this area. In general, these kind
of services should be expanded and require focus.
In quadrant B the case mix indices (CMIs) are
lower than the average of the hospital, but the aver-
age length of stay in the hospital is better than the
catalog value. The cases in this part of the grid re-
quire detailed analysis of costs. The right infrastruc-
ture is of special importance because economic mar-
gins are tight. Strategic decisions like outsourcing or
PPP (private public partnerships) models should be
considered. In general, this area is expected to be at
least cost covering and the portfolio overall should be
kept constant.
At the bottom left, quadrant C represents cases
where ALOS ratio is below 100%, i.e. worse than the
benchmark and where a low CMI is generated. Be-
cause the CMI is low, these activities are potentially
loss generating. The hospital has to thoroughly in-
vestigate its patient pathways and focus on workflow
management, trying to cooperate closely with rehabil-
itation or care management. Furthermore, direct mea-
sures to lower costs need to be taken through imple-
menting for example intermediate care units (IMC)
or similar. Additionally, cooperations with resident
medical doctors and other hospitals that could take
over those cases, need to be investigated. In sum-
mary, this area marks activities where the hospital has
to reflect, why its activities cannot be executed cost-
effectively, or if they could be provided in a day-care
or outpatient management setting.
The last quadrant D is characterized by high case
mix indices and low ALOS ratios. As in quadrant
C, an internal focus needs to concentrate on patient
pathways and workflow management. From a long
term perspective, the number of cases could then be
increased. This can be realized through the creation
of specialized competence centers, with the aim of at-
tracting cases from surrounding hospitals and refer-
rals from resident physicians. Interesting improve-
ments can also be generated from applying a sound
case management that addresses high-outlier issues
(i.e. cases that remain in hospital above the high trim
point length of stay according to the respective DRG
code). Nevertheless this area has a dualistic perspec-
tive. Either processes and cost structures are opti-
mized, or the number of cases are reduced in order
to improve the overall economical situation.
While the above description is necessarily rough
and exemplary, it clearly indicates the added value of
such a graphical representation. It serves as a map of
reference for discussions without the need to refer to
quantitative tables with many dimensions.
3.2 Tool Support
In order to make it possible to apply this strategic
model in practice, we developed an interactive visual
tool called DRGee (as in ”(DR)Gee! Look at this!”)
that supports the planning process. The tool uses a
dynamic bubble chart, similar to (Gapminder, Web),
but with a focus on dynamically modifying the un-
derlying data, instead of temporal trend analysis. It
provides the following core functionality:
• Load a collection of portfolios (a theme)
• Visualize a portfolio in a standardized way
• Allow selection of parts of a portfolio
• Calculate and display characteristic indicators and
summary values of a portfolio or selected parts of
it
• Allow the modification of a portfolio by creat-
ing a copy and editing individual services to play
through what-if scenarios
• Provide the possibility to compare the differences
between two or more portfolios
Figure 2 shows the main interface of the tool. The plot
that was introduced with the strategic model is fea-
tured prominently in the center of the interface. The
case-mix index is plotted against the ratio of catalog
length-of-stay and actual length-of-stay. The bubbles
represent medical services that a hospital performs,
and the size of the bubbles is proportional to the num-
ber of cases for the service.
Along the left side we find from top to bottom:
• The list of portfolios that is loaded (simple selec-
tion of a portfolio in the list displays it and makes
it active, portfolios can be cloned here in order to
modify them)
• A table of all the services defined in the selected
portfolios, showing any number of attributes that
characterize each service (services can be sorted,
selected, and colored here to make them active
and visible, deselected services are shown as
ghosts in the background to preserve overall con-
text)
• A display of characteristic indicators and sum-
mary values of a portfolio (e.g., total number of
cases, revenue, average case-mix index, average
length of stay, etc.). There is a choice between the
whole portfolio or just the selected subset.
All the necessary controls are contained in these three
interface elements. The menus in the menu bar are
only used for high-level configuration of the tool (e.g.,
StrategicPlanningofHospitalServicePortfolios-TheDRGeeViewer
85
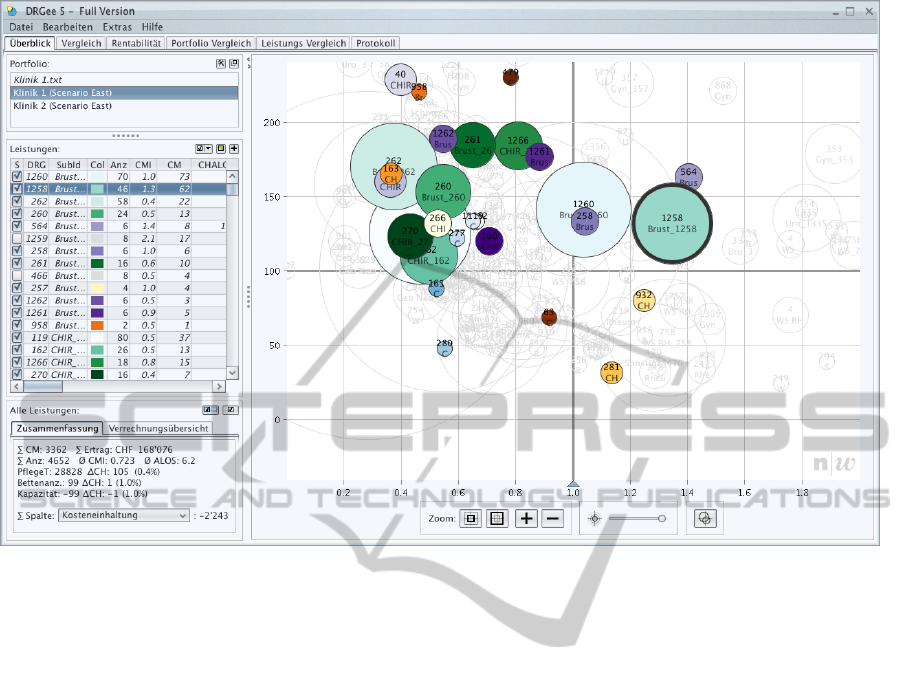
Figure 2: The DRGee tool. The 4-quadrant plot is at the center stage. Services (bubbles) can be directly resized and repo-
sitioned with the mouse to simulate what-if scenarios. Controls along the left are for selecting portfolios, services within
portfolios, and for displaying summary information. Tabs along the top are plugins that extend the basic functionality, mainly
for comparing the various scenarios and documenting the analysis process.
base rate, currency, etc.) and infrequently used func-
tions (e.g., data export, printing, etc.). This was a de-
liberate design decision in order to ensure the discov-
erability of the main functionality without having to
resort to user manuals.
The software was implemented in Java for plat-
form independence, and uses only a handful of third
party libraries, mainly for the look&feel, logging, and
PDF generation.
The architecture provides a dynamic extension
mechanism, where modules (plugins) can be com-
piled into self-contained (Java) jar files that are loaded
automatically and independently at starttime. Every
plugin loaded this way is placed into a separate tab in
the main window of the application, as visible along
the top of the plot in Figure 2. Encapsulating different
features into plugins allows to incrementally increase
the functionality of DRGee without having to touch
the overall architecture and core functionality of the
system. In addition, it supports the easy packaging
and delivery of different versions of DRGee with tai-
lored functionality.
3.3 Working with Scenarios
One of the key features of the tool is the possibility
to modify existing portfolios in order to play through
what-if scenarios, and simulate how the characteristic
values of a portfolio change. Each service (bubble)
has two dimensions that can be changed: length-of-
stay compliance (y-axis) and case count (size of bub-
ble). The case mix indices (x-axis) can not be mod-
ified, as they are fixed and predefined by the DRG
reference catalog.
To modify a bubble, it can simply be manipulated
with the mouse pointer (drag to new position, drag ra-
dius to new size). The values in the table are adjusted
accordingly. Direct manipulation techniques have the
advantage that they are intuitive and efficient if high
precision is not required (Shneiderman, 1983).
Comparing the newly created scenario with the
original portfolio is challenging. There are three
different approaches for visual comparison (Gleicher
et al., 2011): juxtaposition (showing objects side-by-
side), superposition (showing objects overlaid in the
same space), and difference (showing the difference
between the objects).
The DRGee tool supports all three approaches,
HEALTHINF2015-InternationalConferenceonHealthInformatics
86
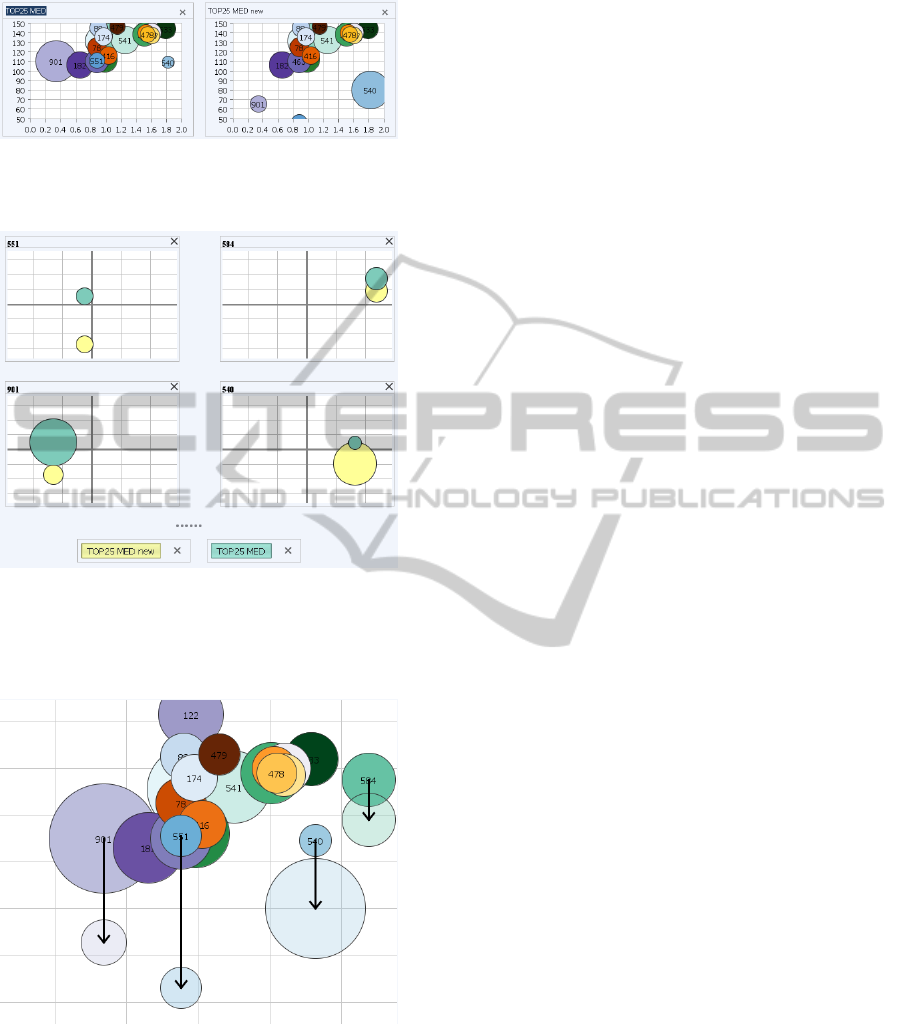
Figure 3: Comparing portfolios by juxtaposition. Signif-
icant differences and overall trends are perceived quickly
(e.g., 901 moved and shrank, 540 moved and grew).
Figure 4: Comparing portfolios by superposition. Individ-
ual differences of only the modified objects are shown as
small multiples. This provides a complete and precise rep-
resentation of all the changes, at the disadvantage of losing
the overall context.
Figure 5: Showing the differences between two portfolios
explicitly. Changes in position are marked by arrows. The
size of the new bubbles is shown transparently so as to not
hide the original configuration in the background.
each implemented as a separate plugin. Figure 3
shows two portfolios juxtaposed. This view works
mainly well for detecting a few strong outliers. Su-
perposition was implemented by using a small mul-
tiple (Tufte and Graves-Morris, 1983) representation
of the plot per bubble that changed. Each small rep-
resentation then only shows the changes to that par-
ticular bubble superimposed in the same plot (Figure
4). The third approach represents the differences be-
tween two plots explicitly as arrows between the orig-
inal and the new position (Figure 5). This technique
allows not only to identify changes in the portfolio but
also shows trends (e.g., ”DRGs in quadrant C tend to
be smaller”, ”DRGs mostly move to quadrant A”, etc.)
3.4 Workshop Use
A special requirement for the tool was that it had to
support use in a live workshop setting. As a con-
sequence the following additional aspects had to be
taken into consideration:
Animated Transitions
One of the main differences between operating a tool
oneself and watching someone else perform the oper-
ation is that not all the intentions and actions of the
operator are visible, but very often only the results of
the actions. Even with close attention, changes can
be missed by the audience, a phenomenon known as
change blindness (Rensink et al., 1997), leading to
mental disconnect and discomfort. In order to address
this problem, all the transitions in the tool (zooms,
pans, size and position changes of bubbles, change of
portfolios, etc.) are smoothly animated or designed as
drag and drop interactions, leading the viewers to the
next state of the visualization in a continuous way.
Simple Interface
Operating a tool live in front of an audience puts a cer-
tain pressure on the operator. It is therefore essential
that the user interface is robust and the functionality
reduced to a set of minimal yet powerful enough fea-
tures. All the controls need to be visible so that the
audience can perceive the series of actions performed
by the operator.
The controls for navigating the bubble plot for in-
stance are not implemented as continuous sliders, but
are constrained to just a few discrete buttons (see Fig-
ure 2 bottom, below the plot). The first button zooms
to a fixed standardized view, and as such serves as
the ”home” button. The second button zooms to the
full range that shows the complete portfolio, which
provides the overview. From these two well-defined
positions, in-between views can be obtained by using
the ”+” and ”-” buttons that zoom the view by 20% in
the respective direction.
StrategicPlanningofHospitalServicePortfolios-TheDRGeeViewer
87

Documentation of the Decision Process
The strategic development of a hospital portfolio is an
iterative process, and it is often necessary to go a step
back and try another path. Traditional tools only pro-
vide linear undo/redo stacks, and only the final result
is saved. In an analytical process however, especially
if it is a collaborative effort shared between partic-
ipants, the intermediate steps are important as well.
Making this path visible and navigable is important to
support the analytical reasoning process (Shrinivasan
and van Wijk, 2008).
Figure 6: The history of the analysis process is documented
as a tree (bottom). Each node represents a different editing
step of the portfolio. Nodes marked with a star have a com-
ment attached. Nodes can be rated (green - relevant, red -
not relevant). Any two nodes can be compared and their dif-
ferences visualized (top left) and numerically characterized
(top right).
In the DRGee tool, we implemented a history in
the form of a tree where every modification to the
portfolio results in a new node (Figure 6). Users can
navigate to any node in the tree, see the portfolio’s
state at that point, and branch out from there. A com-
ment can be added to a node to describe the reasons
for the modification. Any two nodes in the tree can
be compared, and the differences in the two states are
shown both visually and numerically as the relative
difference of the characteristic values.
The complete history is saved, and the history plu-
gin therefore also serves as a documentation feature.
Having access to an automatically generated, naviga-
ble and interactive documentation is very useful in the
consolidation phase after the workshop is conducted.
A viewer-only version of the DRGee tool can be dis-
tributed, loaded with the data and the history, to a
wider audience for review.
4 RESULTS AND DISCUSSION
The methodology, together with the supporting tool
described in the previous section, was used in over
forty different hospitals all around Switzerland over
the course of four years. The type of hospitals ranged
from smaller regional hospitals to hospital groups
within a larger geographic region.
Over the course of this time, many workshops
with hospital management were performed. Both the
method and the tool were refined continuously, but
typically the workflow looked like this:
1. Collect the basic data from the hospital and mas-
sage it into a set of portfolios relevant for the
strategic theme that is of interest. Since the na-
ture and quality of the data varies considerably
between hospitals, we used a range of tools for
data cleaning and consolidation. Typically these
included a primary clean-up in delivery files (i.e.
most of the time incomplete rows), load and en-
richment of data in a database where consistency
checks were performed, and a final validation us-
ing known performance indicators for the respec-
tive hospital in order to ensure the consistency of
the full data load. The final step consisted in cre-
ating the DRGee Viewer load files.
2. Analysis of the portfolios by healthcare experts.
The tool’s analysis capabilities proved very use-
ful to first gain the general overview of the data.
Following this, the portfolio comparison function-
ality allowed to check for outliers, or for yearly
comparisons of two specific portfolios (e.g. yearly
comparison of the same two clinics). A deeper
analysis was then performed by using the super-
position comparison. It was possible to directly
display single DRG groups for example over time,
and compare them in one overview allowing for a
direct comparison. The latter oftentimes provided
the basis for the simulation within the existing or
a new portfolio.
3. Perform a strategy workshop with hospital man-
agement in which the tool is used to present the
findings of the analysis, explore different scenar-
ios, and discuss future strategies. These work-
shops typically included senior hospital manage-
ment, controllers, or infrastructure planners, and
are lead by a healthcare consultant that is familiar
with the data. Typical questions revolved around
what-if scenarios. For example, what happens if I
alter the ALOS Ratio of a specific group by adapt-
ing my processes considerably? Or what are the
effects of increasing the number of cases in a spe-
cific DRG or group? Participants found it very
useful that they could directly see the effect of
changing parameters (i.e. either the ALOS ratio
or the number of DRGs per group) and validate
and further discuss the results either in the various
HEALTHINF2015-InternationalConferenceonHealthInformatics
88

portfolio comparison views, or see the profitabil-
ity effects in the summary values.
4. Provide the data used in the workshop and
any resulting modifications to the portfolios to
hospital management, together with a limited-
functionality version of the tool for further dis-
cussion and communication. The recipients were
able to profit by continuing the work beyond the
guided workshops. The wider distribution of the
tool, also to non-expert users, did not turn out
to be a problem. The tool proved to be intuitive
enough so that the required support was not sig-
nificant.
In the workshops, the tool is used in front of a group
of people. This prompts the question, if there is an op-
portunity to extend the tool to provide more explicit
support for collaboration. There are various scenar-
ios in which collaborative visualization can occur. In
the space-time matrix that is used by (Isenberg et al.,
2011) to categorize the design space, our implementa-
tion of DRGee currently corresponds to a co-located
synchronous scenario, where a group of experts in the
same room interact socially to create a common un-
derstanding of the data. Large interactive walls or
multi-touch tabletop displays are technologies that are
of interest in this context. However these devices are
not yet widely available at the places where hospital
decision makers work, which is why the practical po-
tential of such approaches is still limited.
A web-based version of DRGee would facilitate a
distributed asynchronous scenario, with access to the
tool and the analysis results from arbitrary locations
at any time. The focus would not be on social aspects
of a large (mostly lay) audience such as investigated
by systems like Many Eyes (Viegas et al., 2007), but
more on the asynchronous aspect of supporting col-
laborative analysis across time.
Examples of the strategic insights and decisions
that resulted from this work are:
• A group of hospitals reorganized their main op-
erative theaters, because services were delivered
far more efficiently in one hospital than the other.
Consecutively the costs were reduced substan-
tially, leading to an overall benefit within this sec-
tor of activity.
• The tool helped a smaller regional hospital to rec-
ognize its strategic fallacies, and thus proceed to a
strategic partnership by giving up a certain part of
their activities and re-focusing the hospitals over-
all market approach.
5 CONCLUSION
We have developed a tool to visualize and edit hospi-
tal service portfolios in live workshop settings. The
tool is embedded in a strategy methodology that is
used by hospital management and healthcare consul-
tants. The method is actively used and has been suc-
cessfully applied in more than forty hospitals around
the country so far.
Strategic planning is difficult since the set of vari-
ables to consider is multidimensional and complex.
Having a tool at hand that supports modelling, visu-
alization, evaluation, and comparison of various ap-
proaches while self-documenting the individual steps,
proved to be extremely helpful and often acted as a
catalyzer in the planning workshops.
The supporting tool goes beyond graphics towards
an interactive toolset that allows to understand com-
plex situations intuitively and discuss strategic chal-
lenges. In this way the DRGee Viewer distinguishes
itself from purely operative tools that are available in
the market, as it is embedded in a logical framework.
This makes it robust enough (by using the same port-
folio structures at all levels) to provide a stable, com-
parable and evidence-based foundation for decisions.
The approach has the potential to be used at a
more complex level, beyond a single hospital groups
perspective, towards a more public health oriented di-
mension. This is where the value of such a tool could
be useful for health service planning and provision.
Other directions in which the system will be ex-
tended are twofold:
• On the technical side, a migration to a web-based
system is planned, to allow concurrent and collab-
orative work.
• It is planned to incorporate more data sources,
such as quality data, demographic data and geo-
graphic conditions, and a comprehensive simula-
tion within this new data landscape will be devel-
oped.
In summary, the method supported by the DRGee
Viewer reflects claims in literature (Geissler et al.,
2011) that DRGs are not solely a tool for financing
hospital services, but are also well suited for increas-
ing transparency, inducing efficiency and supporting
the hospital management in strategic decisions.
REFERENCES
Boston Consulting Group (Web). The Product Portfolio.
Available online at http://tinyurl.com/prodportfolio,
visited on 08/26/2014.
StrategicPlanningofHospitalServicePortfolios-TheDRGeeViewer
89

Gapminder (Web). Gapminder Homepage. Available online
at http://www.gapminder.org/, visited on 11/16/2014.
Geissler, A., Quentin, W., Scheller-Kreinsen, D., and Busse,
R. (2011). Introduction to DRGs in Europe: Com-
mon objectives across different hospital systems. Di-
agnosis Related Groups in Europe: Moving Towards
Transparency, Efficiency and Quality in Hospitals,
pages 9–21.
Gleicher, M., Albers, D., Walker, R., Jusufi, I., Hansen,
C. D., and Roberts, J. C. (2011). Visual comparison
for information visualization. Information Visualiza-
tion, 10(4):289–309.
Gocke, P., Debatin, J. F., and Drselen, L. F. J. (2002).
Prozessmanagement und Controlling in der Diagnos-
tischen Radiologie im Krankenhaus. Der Radiologe,
42(5):332–343. 00012.
Isenberg, P., Elmqvist, N., Scholtz, J., Cernea, D., Ma, K.-
L., and Hagen, H. (2011). Collaborative visualization:
Definition, challenges, and research agenda. Informa-
tion Visualization, 10(4):310–326.
Luke, R. D. (1979). Dimensions in hospital case mix mea-
surement. Inquiry, 16(1):38–49.
L
¨
ungen, M. and Lauterbach, K. W. (2002). F
¨
uhren DRG
zur Spezialisierung von Krankenh
¨
ausern? Gesundh
¨
okon Qual manag, 7(2):93–95. 93.
Rensink, R. A., O’Regan, J. K., and Clark, J. J. (1997). To
see or not to see: The need for attention to perceive
changes in scenes. Psychological Science, 8(5):368–
373.
Rohner, P. (2012). Achieving impact with clinical process
management in hospitals: an inspiring case. Business
Process Management Journal, 18(4):600–624. 00003.
Schrey
¨
ogg, J., Stargardt, T., Tiemann, O., and Busse, R.
(2006). Methods to determine reimbursement rates
for diagnosis related groups (drg): A comparison of
nine european countries. Health Care Management
Science, 9(3):215–223.
Shneiderman, B. (1983). Direct manipulation: a step be-
yond programming languages. Computer, pages 57–
69.
Shrinivasan, Y. B. and van Wijk, J. J. (2008). Supporting
the analytical reasoning process in information visu-
alization. In Proceedings of the SIGCHI Conference
on Human Factors in Computing Systems, CHI ’08,
pages 1237–1246, New York, NY, USA. ACM.
Swiss DRG (Web). Swiss DRG Homepage. Avail-
able online at http://www.swissdrg.org/, visited on
08/25/2014.
Tufte, E. R. and Graves-Morris, P. (1983). The visual dis-
play of quantitative information, volume 2. Graphics
press Cheshire, CT.
Viegas, F., Wattenberg, M., van Ham, F., Kriss, J., and
McKeon, M. (2007). Manyeyes: a site for visual-
ization at internet scale. Visualization and Computer
Graphics, IEEE Transactions on, 13(6):1121–1128.
HEALTHINF2015-InternationalConferenceonHealthInformatics
90
