
Implementation of a Motor Imagery based BCI System using Python
Programming Language
Luz María Alonso-Valerdi
1
and Francisco Sepulveda
2
1
Department of Research, Tecnológico de Monterrey, Calle del Puente 222,
Col. Ejidos de Huipulco, Tlalpan, 14380, Mexico City, Mexico
2
School of Computer Science and Electronic Engineering, University of Essex,
Wivenhoe Park, CO4 3SQ, Colchester, Essex, U.K.
Keywords: Brain-computer Interface, Motor Imagery, Python Programming Language.
Abstract: At present, there is a wide variety of free open-source brain-computer interface (BCI) software. Even
though the available software is very complete, it often runs under a Matlab environment. Matlab is a high
performance language for scientific computing, but its limitations concerning the license cost, the restricted
access to the algorithm code, and the portability difficulties complicates its use. Therefore, we proposed to
implement a motor imagery (MI) based BCI system using Python programming language. This system was
called miBCI software, was designed to discriminate up to three control tasks and was structured on the
basis of online and offline data analyses. The functionality and efficiency of the software were firstly
assessed in a pilot study, and then, its applicability and utility were demonstrated in two subsequent studies
associated with the external and internal influences on MI-related control tasks. Results of the pilot study
and preliminary outcomes of the subsequent studies are herein presented. This work contributes by
promoting the utilization of tools which facilitate the advance of BCI research. The advantage of using
Python instead of Matlab, which is the widely used programming language at the moment, is the
opportunity to develop BCI software in a public and collaborative way, without property license restrictions.
1 INTRODUCTION
A brain computer interface (BCI) is a system that
allows individuals to interact with their environment
by translating their brain signals into control
commands for a specific-purpose device. In a typical
non-invasive BCI system, the brain signals are
recorded via electroencephalography (EEG) and
users can modulate their brain signals through
control tasks. Those control tasks are generally
grouped into two types: endogenous or exogenous.
Endogenous control tasks are voluntary mental tasks
that generate distinguishable EEG patterns over the
scalp. Exogenous control tasks direct the user
attention to specific sensory-cognitive stimuli, which
causes automatic and detectable changes in the EEG
signals (Mason and Birch, 2003). The scope of the
present project is limited to BCI systems based on
endogenous control tasks, specifically motor
imagery (MI).
The operation of a BCI system is based on three
functions: (1) data collection from an EEG recorder,
(2) online EEG signal translation, and (3) delivery of
user feedback (Figure 1.1). Frequently, it is also
necessary to store the EEG information to study in
depth the brain signals’ patterns emerged during the
brain-computer communication (Delorme et al.,
2010). The implementation of a BCI system, along
with application software for analysing offline EEG
information, is herein called BCI working
environment.
As BCI research has been growing rapidly in the
last years, the necessity to implement appropriate
BCI working environments where researchers can
conduct their specific-purpose studies has also
arisen. To date, there is a wide variety of computer
programs with BCI applications. The best known
and extensively used BCI software includes
BCI2000 (Mellinger and Schalk, 2007), BCILAB
(Kothe and Makeig, 2013), BioSig (Schlögl et al.,
2007), OpenViBE (Renard et al., 2010), and
EEGLAB (Delorme and Makeig, 2004). Most of the
BCI software has been written in C/C++ or Matlab,
and is free open-source. Even though the previous
35
Alonso-Valerdi L. and Sepulveda F..
Implementation of a Motor Imagery based BCI System using Python Programming Language.
DOI: 10.5220/0005211500350043
In Proceedings of the 2nd International Conference on Physiological Computing Systems (PhyCS-2015), pages 35-43
ISBN: 978-989-758-085-7
Copyright
c
2015 SCITEPRESS (Science and Technology Publications, Lda.)
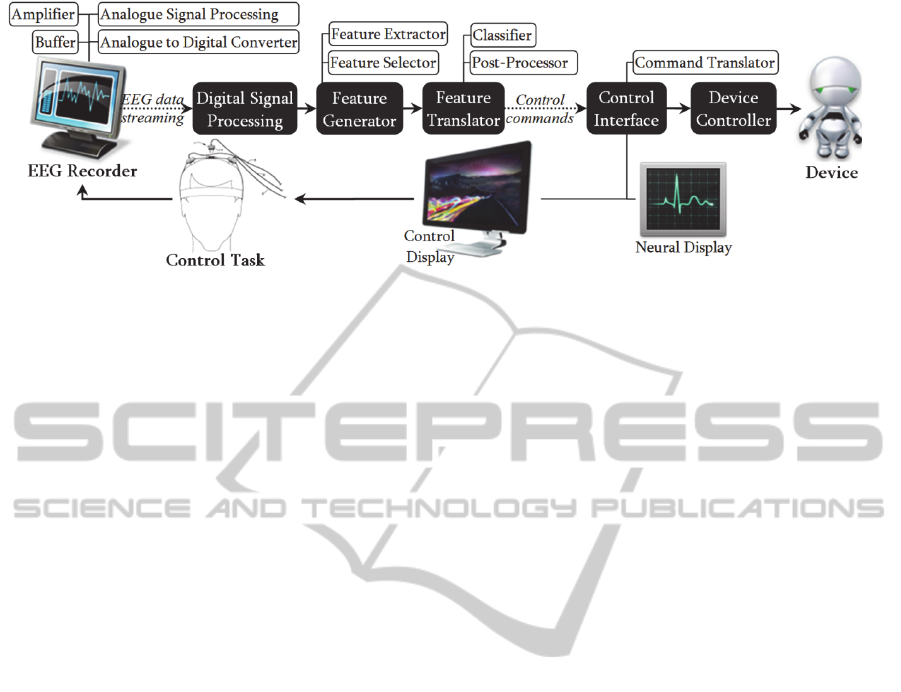
Figure 1: General structure of a non-invasive BCI system. Typically, this system first collects the user brain signals from an
EEG recorder. Then, it translates the EEG signals into control commands via a digital signal processor, a feature generator,
and a feature translator. Finally, it provides feedback about the user performance via a control display and translates the
control commands into semantic control signals.
BCI software is very complete, it usually requires
programming skills (such as BCI2000) or runs under
a Matlab environment (such as BCILAB). These
facts could hinder the research progress due to time
consuming or budget restrictions.
With respect to Matlab, this is currently the most
widely used tool for applying computational
methods. In addition, The MathWorks Company
offers other valuable tools such as Simulink for
developing, testing and prototyping BCI approaches
(Ishak, 2009). However, Matlab has three main
limitations, which are: (1) cost, (2) divulgation and
(3) portability (Klein and Reilink, 2013). Firstly and
although Matlab is feasibly afforded by the business
sector, it may become a financial burden for the
private one. For instance, worldwide universities
often purchase a limited number of licenses to deal
with the cost; however, the number of available
licenses seldom satisfies the demand. Furthermore,
The MathWorks Company usually suggests paying
for a low-cost student edition in restricted budget
cases, but only a few of toolboxes are included.
Unfortunately, toolboxes are the most exploitable
resource of Matlab. Secondly, Matlab algorithms are
under a proprietary licensing model. This prohibits
access to the code, which is inconsistent with the
research goals of transparency and reproducibility
(Perez et al., 2011). Finally, the only way to run a
compiled application in Matlab is using the
Component Runtime, but the version of both the
application and the component must be exactly the
same. If we consider that The MathWorks Company
releases a new version every six months, portability
in Matlab becomes completely unfeasible (Klein and
Reilink, 2013).
In the light of the above discussion, several
scientific fields have been gradually turning to other
programming languages, which could offer all the
benefits of Matlab, but under a free open-source
environment. Over the past few years, Python has
become a potential replacement of Matlab because it
provides a comprehensive ecosystem (Perez et al.,
2011). As Matlab, Python has a large variety of
packages for efficient scientific computing. Unlike
Matlab, Python is not limited to the scientific field.
Python is widely used for more general applications
such as web development and database management
(Spacek and Swindale, 2009; Oliphant, 2007;
Lindstrom, 2005). Furthermore, Chavez et al.,
(2006) evaluated the usability, productivity,
performance and scalability aspects of Python on
high performance computing modernization
programs. They proved that Python was powerful
enough to efficiently implement complex
signal/image processing algorithms (Center, 2006).
Python is additionally very accessible to those who
are not programmers. In fact, Fangohr (2004)
compared the programming languages C, Matlab
and Python as teaching languages for engineering
students, and Python was found to be the best choice
in terms of clarity and functionality.
Owing to the limitations of using Matlab and as
Python provides the sufficient tools for
implementing a customised BCI working
environment, the aim of this project was to develop
a MI-based BCI using Python. This was called
miBCI software and a prototype version was
presented in (Alonso-Valerdi and Sepulveda, 2011;
Alonso-Valerdi and Sepulveda, 2011). In this paper,
the final version of the miBCI software is introduced
as follows. First, the development, evaluation and
application of the system are described in detail.
Thereafter, the results obtained from all of the
conducted experimental studies are reported. Finally,
some highlights and future directions are discussed.
PhyCS2015-2ndInternationalConferenceonPhysiologicalComputingSystems
36
2 METHODS
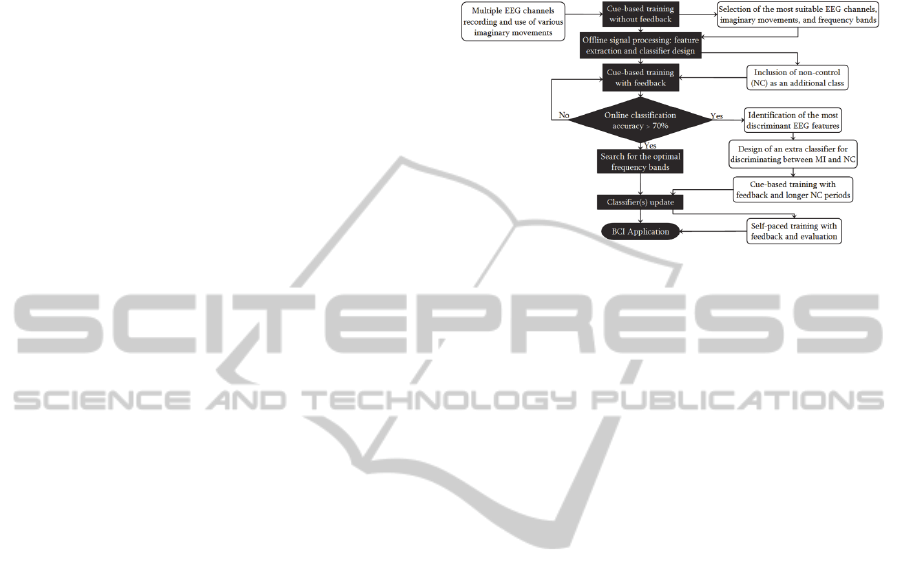
MI has been extensively employed as control task
because this allows a natural and intuitive BCI
control. Moreover, MI-based BCIs provide the
flexibility to develop autonomous (or asynchronous)
systems. There is a large volume of published
studies describing the use of MI in BCIs. In this
regard, the most prominent work has been reported
by Graz BCI Lab (Pfurtcheller et al., 2007). At
present, this research group has a well-established
procedure to develop synchronous and asynchronous
systems (Pfurtscheller et al., 2011; Leeb et al.,
2007). Such procedure has been illustrated in Figure
2.1 and the architecture of the miBCI software was
founded on those stages related to the development
of a synchronous system.
2.1 Design Considerations
The miBCI software was designed to discriminate up
to three control tasks and structured on the basis of
both online and offline data analyses. Considering
the Graz paradigm for developing synchronous MI-
based BCIs (Figure 2.1), the online data analysis
comprises a cycle of two phases: adaptation and
application. The adaptation phase is a series of
computing processes, which adjusts a mathematical
model (classifier) to a particular EEG dataset. Those
datasets come from training sessions with or without
feedback. The application phase is the utilization of
the model adjusted in the adaptation phase to predict
the user control tasks during training sessions with
feedback or during BCI control. The offline data
analysis comprises digital signal processing (DSP),
feature generation and classification, and plotting.
2.2 Description of the System
The miBCI software was completely written in
Python. It was built on top of Numpy and Scipy
(Oliphant, 2007), in addition to a very complete
plotting library, matplotlib (Hunter, 2007). The
graphical user interface of the software was
programmed on PyGTK , a rich binding for creating
interfaces; the machine learning was supported by
mlpy, a module for (un)supervised problems
(Albanese et al., 2012); and the classifier generation
was provided by LIBSVM, a library for supported
vector classification (Chang and Chih-Jen, 2011).
The miBCI software was created to carry out the
same operations through online and offline analyses,
except for the controlling device operation of the
online process. On this basis, the fundamental
structure of the miBCI software was divided into six
modules: (1) data acquisition, (2) DSP, (3) feature
extraction, (4) feature selection, (5) feature
classification, and (6) plotting tools.
Figure 2.1: Flowchart of the general Graz procedure to
develop MI-based BCIs. Both types of systems
synchronous () and asynchronous (,) are illustrated.
2.2.1 Data Acquisition
At Essex BCI group, user brain signals are recorded
via BIOSEMI equipment. Such company provides
an EEG recording system (ActiveTwo), along with
application software (ActiView). The ActiveTwo
was configured to record the EEG signals within a
400Hz-bandwidth at 2048S/s. The ActiView
software displays the EEG signals, saves EEG data
as BDF-file, and provides a server for network-
oriented communication (TCP/IP).
In the miBCI software, EEG data must be
provided in mat-format organized in three
dimensions (channels, trials, and samples) for offline
analysis. As data are saved as BDF-file, those must
be first converted into mat-files by using the BioSig
library (Schlogl and Brunner, 2008). For online
analysis, a TCP/IP client is used to acquire the
upcoming EEG signals. Refer to Figure 2.2a.
2.2.2 Digital Signal Processing
In essence, the DSP of the miBCI software consists
of spectral and spatial filtering. The spectral method
was included in three ways: (1) ‘50Hz-rejection’,
filtering based on a second-order Butterworth band-
stop filter; (2) ‘Low frequency filtering’, filtering for
removing frequencies below 0.01Hz; and (3)
‘Bandwidth selection’, filtering based on a fourth-
order Butterworth high-pass filter followed by a
seventh-order Butterworth low-pass filter. The
spatial technique was mainly encompassed under
three categories: bipolar, Laplacian, and common
average reference (CAR). Bipolar filtering calculates
a local voltage gradient where the influences of
ImplementationofaMotorImagerybasedBCISystemusingPythonProgrammingLanguage
37

distant sources are attenuated. Laplacian filtering is
estimated by subtracting the average of surrounding
electrodes from each individual electrode. CAR is
acquired by removing the mean of all the electrodes
from each individual electrode. See Figure 2.2b.
2.2.3 Feature Extraction
Sensory stimulation, cognitive activities, and motor
behaviour result in amplitude suppression or
enhancement of the EEG signals. The association of
this EEG modulation with specific events is known
as event-related oscillation (ERO). Those events can
be of two types: event-related synchronization
(ERS) and event-related desynchronization (ERD).
If the EEG signals increase their synchrony and thus
their amplitude, an ERS arises. Otherwise, an ERD
appears (Klimesch, 1999). Particularly, MI activity
triggers ERD on the contralateral hemisphere, as
well as ERS on the ipsilateral hemisphere. The
concerned oscillations take place within alpha (8–
12Hz) and beta (16–24Hz) bands over the primary
sensory-motor cortical area (Pfurtscheller and Lopes
da Silva, 1999). As EEG power can reflect ERD and
ERS, there are three methods based on power
measurement to detect MI activity. These are: (1)
band power (BP) or absolute power, (2) relative
power, and (3) ERD-ERS values. All of them were
implemented in the miBCI software and are
illustrated in Figure 2.2c.
BP consists of three steps: (1) band-pass filtering
of the EEG signals in predefined frequency bands,
(2) squaring of the amplitude samples to obtain
power samples, and (3) averaging of the power
samples over specific time segments (Pfurtscheller
and Lopes da Silva, 1999). Note that time segments
used to average the power samples are specified in
the segmentation tool of the data acquisition menu
(Figure 2.2a).
Relative power is defined as the ratio between
the absolute power in a single frequency band, and
the absolute power in a collection of frequency
bands (Kropotov, 2009; Sörnmo and Laguna, 2005).
This is determined as follows. First, the EEG signals
are band-pass filtered in predefined frequency bands.
Second, the EEG signals are band-pass filtered in a
broad band that involves all the foregoing frequency
bands. Third, the amplitude samples are squared to
obtain power samples. Fourth, the power samples in
the predefined frequency bands are divided by the
power samples in the broad band. Finally, the power
samples are averaged as in the BP method.
To obtain ERD-ERS values, the same procedure
described for BP is followed. However, having
determined the BP estimates, these are additionally
divided by an average power value. This value refers
to the BP calculation in a reference interval (RI),
which is typically taken a few seconds before
occurring the control task.
2.2.4 Feature Selection
Feature selection is based on two stages: ranking and
classification. This means that the features within
each vector are first ranked from the most to the
least fruitful feature by using Davis-Bouldin index
(DBI) or recursive feature elimination. Having
ranked the features and in order to select a proper
number of them, a classification stage takes place as
follows. First of all, if there are three classes (class
1
,
class
2
, and class
3
) under study, then one classifier
(c
1
) is assigned to discriminate between class
1+2
and
class
3
, while another one (c
2
) is used to discriminate
between class
1
and class
2
. If there are two classes
(class
1
and class
2
), then only the first classifier (c
1
)
is necessary. Applying any of these two
classification methods, the already ranked feature-
vectors are classified every
features,
accomplishing classifications in total (C
1
K
). This
means that K sub-feature-vectors (x) are formed on
the basis of the factor
. In addition to the factor
,
the feature-indexes (
) corresponding to the first and
last features taken from every feature-vector must be
defined as well. The whole classification stage can
be expressed by
1),::(1),::(
1),::(1),::(
21
1
321
2
1
11
lastfirstclasslastfirstclass
c
lastfirstclasslastfirstclass
xxc
xxc
C
(1)
From the resulting classification accuracies, the
miBCI software searches the classifier(s) that yields
the highest classification accuracy(ies), and so the
most fruitful features are selected.
2.2.5 Classification
Classifiers mainly seek to assign a feature-vector to
a specific class through a discriminant function. In
the miBCI software, this function is obtained by
using Fisher discriminant analysis (FDA) or
linear/Gaussian support vector machines (SVM).
The classification stage in the miBCI software
proceeds in five steps. First, the feature-vectors are
scaled to avoid features in greater numeric ranges
dominate those in smaller numeric ranges. The
feature-vectors are normalized by using the mlpy
module (Albanese et al., 2012) or standardized by
dividing MI-related features by RI related features.
PhyCS2015-2ndInternationalConferenceonPhysiologicalComputingSystems
38
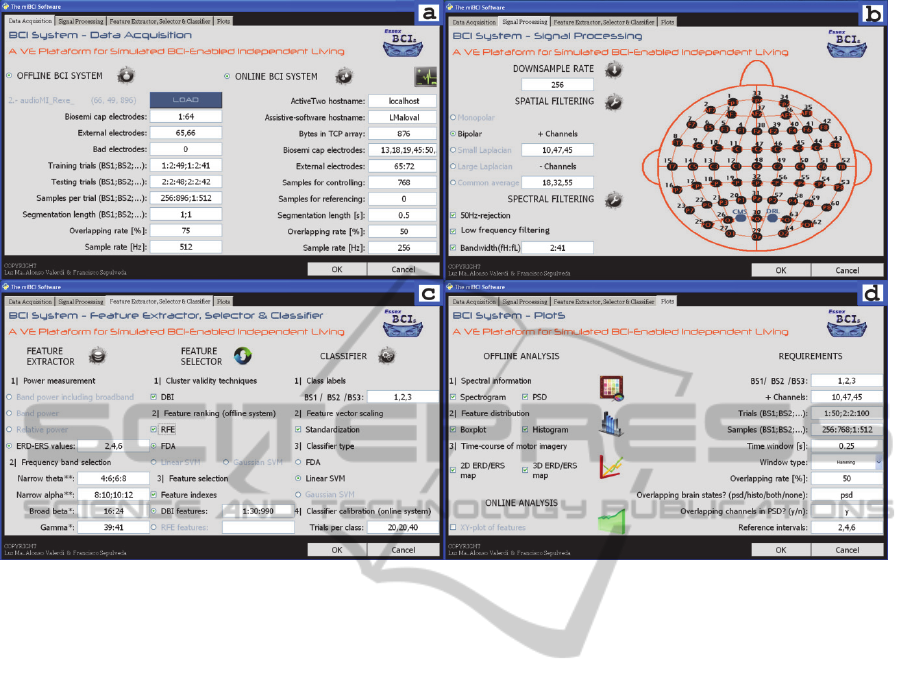
Figure 2.2: Graphical user interface of the miBCI software. The software was structured in four tabs. These are: (a) data
acquisition for offline and online analyses, (b) digital signal processing, (c) feature extraction, feature selection and
classification, and (d) plotting tools.
Second, the model is adapted to a training set by
minimizing the difference between a target vector
and the model output of the feature-vectors. This
step is called training phase and is executed through
10-fold cross-validation. In addition, a regularization
process is run during the training phase so as to
prevent over-fitting problems due to the
manipulation of numerous feature-vectors. Third, the
model with the lowest parameters and the highest
classification accuracy is selected. Finally, once the
model has been trained, its ability to categorize
correctly a testing set is evaluated (Bishop, 2006;
Hsu et al., 2003).
2.2.6 Plotting Tools
The miBCI software has six plotting tools (Figure
2.2d). Five of them are for offline analysis and the
remaining one is for online analysis. The offline
tools are divided into three categories: (1) graphical
representation of the EEG signals in the frequency
domain, (2) feature distribution, and (3) time course
of ERD-ERS (Pfurtscheller and Lopes da Silva,
1999). The online tool creates x-y plots of the
incoming features during the brain-computer
communication.
2.3 Evaluation of the System
Three naive participants (one female and two males)
took part in a pilot study. All of them consented to
take part in the study and none of them reported
neurological deficits. All the participants were aged
between 26 and 31 and were right-handed. The study
lasted around 50 minutes split in a 30-min session to
mount 61 electrodes, and a 20-min session to train
the participants. The 61 electrodes corresponded to
the EEG layout of 81 electrodes based on the 10/10
system, wherefrom the 20 ones localized along the
0% axial reference curve were discarded. The
participant training session was arranged in four
runs. Each run had 40 trials (20 left and 20 right
hand MIs) and each trial lasted between 10 and 11s
(Figure 2.3).
The miBCI software was applied to monitor the
behaviour of the EEG signals during the experiment
(online data analysis), and subsequently, was also
applied to analyse those EEG signals (offline data
analysis). In both analyses, the time windows taken
by the miBCI software were MI performance (from
3 to 7s) and relaxing period (only from 8 to 10s).
The relaxing period was used to characterize the no
control (NC) class in the online data analysis, while
ImplementationofaMotorImagerybasedBCISystemusingPythonProgrammingLanguage
39

it was used as RI in the offline data analysis.
2.3.1 Online Data Analysis
For the online data analysis, the miBCI software was
configured as follows. Two bipolar channels (FC3–
CP3 and FC4–CP4) were selected. The MI-related
signals were segmented using 1s time windows,
while those related to NC were segmented using
500ms time windows. In both cases, no overlapping
was applied. The feature extraction was based on
absolute power measurements within two narrow
frequency bands: upper alpha (
U, 10–12Hz) and
upper beta (
U, 20–24Hz). Given the configuration
described above, feature-vectors of 16 features were
obtained.
2.3.2 Offline Data Analysis
For the offline data analysis, the miBCI software was
configured as follows. Three central channels (C3,
Cz, and C4) were taken and spatially filtered via two
methods: small Laplacian and CAR. The channels
were segmented by using time windows of 1s length
with 50% overlapping rate. The feature extraction
was based on absolute power measurements within
four narrow frequency bands: lower alpha (
L, 8–
10Hz),
U, lower beta (L, 16–20Hz), and U. The
classification was executed through a Gaussian
SVM, which was trained with 40 trials per class and
tested with 40 trials per class as well. This
configuration resulted in vectors of 84 features.
2.4 Application of the System
To demonstrate the usability of the miBCI software,
the conduct of two independent studies, where the
software was applied, is hereunder outlined.
2.4.1 Analysis of the Cue Effects
The aim of this analysis was to investigate the cue
(audio, visual and bimodal stimuli) effects on left
and right hand imaginary movements.
Nine participants (four females and five males)
took part in this study and signed a consent form. All
of them were aged between 28 and 41 years. None
of them reported auditory impairments, seven of
them had normal vision, and two of them had
corrected-to-normal vision. Eight of the nine were
right-handed and only one was left-handed. The
participants attended two sessions, which lasted 48
minutes each and followed an identical procedure.
Every session consisted of six runs and one run had
50 trials. One trial took from 8500 to 9500ms. Each
trial consisted of three phases: movement
preparation (0-2500ms), MI (2500-6000ms) and
relaxation (6000-8500±1000ms). The timing
protocol is similar to that depicted in Figure 2.3.
For analysing the MI-related control tasks, the
miBCI software was configured as follows. Sixty
one electrodes were selected (note that the same
EEG layout used in the pilot study was employed).
Figure 2.3: Timing protocol for the pilot study. Each trial
comprised four phases: warning sign, cue onset plus a
beep, blank screen, and random inter-trial interval.
The EEG signals were referenced through the
large Laplacian method and segmented by using
time windows of 500ms length with 50%
overlapping rate. The feature extraction was based
on absolute power measurements within seven
narrow frequency bands: lower theta (
L
, 4–6Hz),
upper theta (
U
, 6–8Hz),
L
,
U
,
L
,
U
, and gamma
(, 39–41Hz). The resulting feature-vectors were
increasingly sorted by their DBI and classified via
FDA.
2.4.2 Study of the Workload Influence
The goal of this study was to investigate the
workload effects in BCI systems. For this purpose,
users were immersed into a simulated living-
environment with increasingly demanding scenarios.
In this study, three control tasks were used: left and
right hand MIs and non-MI.
Five women and six men took part in this study.
At the beginning of the study, all the participants
were informed about the experimental procedure and
signed a consent form. All of them were right-
handed and aged between 25 and 60 years. None of
them reported auditory impairments and/or
neurological disorders, nine of them had normal
vision, and two of them had corrected-to-normal
vision.
The experiment was divided into three sessions.
Every session lasted between 120 and 180 minutes.
All of the sessions followed three phases: (1) 61
electrode mounting, (2) determination of the
independent alpha frequency (IAF), and (3)
fulfilment of three scenarios per session. The timing
protocol for this experiment was based on trials that
lasted between 7000 and 8000ms. Each trial
PhyCS2015-2ndInternationalConferenceonPhysiologicalComputingSystems
40
included three phases: warning (0–1500ms), control
task (1500–5000ms), and blank screen (5000–
7000±1000ms). The trial configuration is similar to
that illustrated in Figure 2.3.
For this study, the miBCI software was
configured as the previous study. However, instead
of using predefined frequency bands to the feature
extraction process, theta and alpha bands were
adjusted to the IAF of each participant.
Note that the EEG analysis of the two
aforementioned studies was exclusively offline.
3 RESULTS
3.1 Evaluation of the System
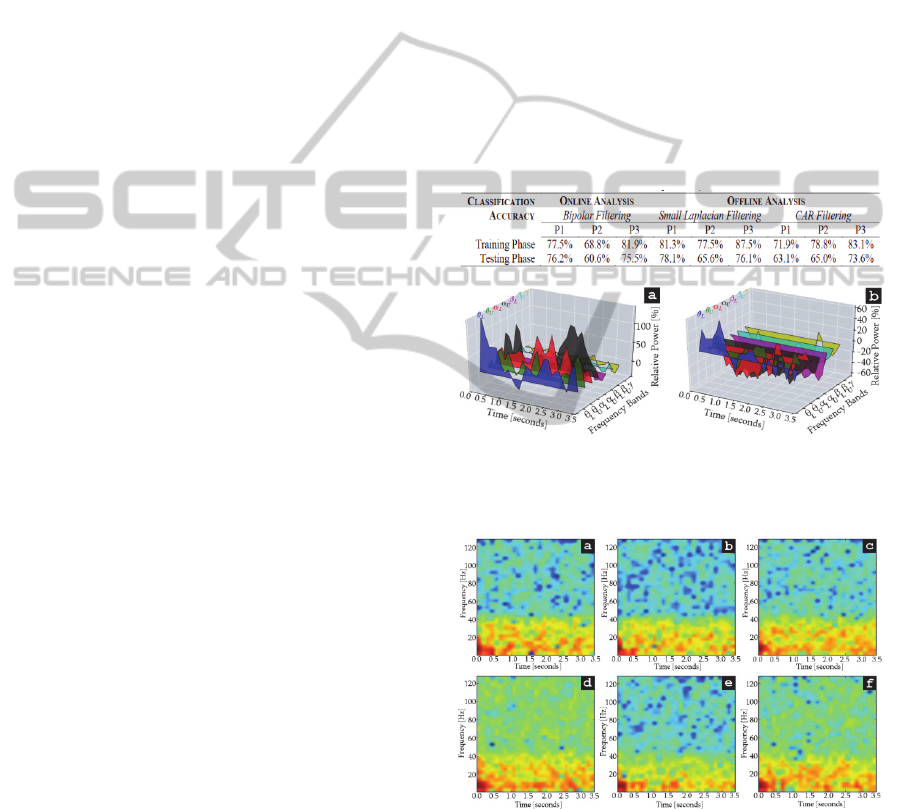
The results that were obtained from the pilot study
conducted to evaluate the miBCI software are
presented in Table 3.1. As can be seen from the
table, the system recognized at least 60% of the MI
patterns of three participants in both online and
offline analyses. The classification results showed
that the small Laplacian and the CAR methods were
more effective to discriminate MI patterns than the
bipolar method. Furthermore, the small Laplacian
method was more efficient than the CAR method.
The results are congruent with those reported in
(Ramoser et al., 2000), thereby demonstrating the
proper functionality of the miBCI software.
3.2 Application of the System
The utility of the miBCI software is illustrated by
presenting some preliminary results obtained from
two offline analyses. As will be described in the next
paragraphs, those preliminary results provided a
valuable insight into the EEG information at hand.
3.2.1 Analysis of the Cue Effects
To illustrate the application of the miBCI software,
feature-vectors proceeding from right hand MI cued
by audio stimuli were selected. As can be seen from
Figure 3.1, right hand MI produced EROs in
unexpected frequency bands such as theta and
gamma. Specifically, right hand MI produced
remarkable ERD on the contralateral hemisphere in
L
,
U
,
L
,
U
, and bands. Similarly, it caused
significant ERS on the ipsilateral hemisphere in
L
,
U
,
L
, and
U
bands. Refer to Figure 3.1.
3.2.2 Study of the Workload Influence
The main objective of this analysis was to observe
the control task changes throughout increasingly
demanding scenarios. In order to exemplify the
miBCI software application, spectral information of
the three control tasks from one of the participants is
presented. The spectrograms of the control tasks
obtained from the lowest and the highest demanding
scenarios are compared in Figure 3.2. It can be seen
that most of the spectral components are held within
0 and 40Hz when the control tasks were generated
under low demanding situations (a, b, and c). In
contrast, spectral components are spread over all the
frequencies when the control tasks were generated
under high demanding situations (d, e, and f).
Table 1: Results of the pilot study.
Figure 3.1: ERD-ERS maps of right hand MI cued by
audio stimuli. The MI activity on right and left hemisphere
is display in (a) and (b), respectively.
Figure 3.2: Spectrograms of left, right, and non-MI control
tasks extracted from the left hemisphere. The control tasks
coming from low demanding situations are display in (a),
(b), and (c) for left, right, and non-MI, respectively.
Likewise, those coming from high demanding situations
are presented in (d), (e), and (f).
ImplementationofaMotorImagerybasedBCISystemusingPythonProgrammingLanguage
41

4 DISCUSSION
At present, there is a wide variety of BCI software
that is very complete and free open-source.
However, most of the available BCI software runs
under a Matlab environment. This leads to purchase
a MathWorks license. The cost and restrictions of
such license is what hinders the use of BCI software
that requires Matlab programming language. In fact,
a common topic discussed in social networking
websites such as ResearchGate and LinkedIn is the
substitution of Matlab for biosignal processing.
Several scientific fields have been gradually
turning to Python programming language, which
offers all the benefits of Matlab, but under a free
open-source environment. Python is a functional and
object-oriented programming language, which
facilitates software development from scratch. With
regard to BCI research, Python has an extensive
variety of modules applicable to neurosciences,
pattern recognition, machine learning and others.
In the light of the above discussion, a MI-based
system was programmed through Python
programming language. The system was called
miBCI software and was based on online and offline
data analysis. In both analyses, the same EEG data
processing system was adopted. This data processing
system was created in line with six modules: data
acquisition, DSP, feature extraction, feature
selection, feature classification, and plotting tools.
The functionality of the miBCI software was tested
in a pilot study, and its utility was exemplified
through a miscellaneous collection of plots obtained
from two offline studies.
Although the miBCI software is terminated for
now, further work is required to increase the
versatility of the system. A number of future
improvements have been considered. First of all, the
online data analysis of the software can be
redesigned in order to detect non-control stages.
This will allow users to control the miBCI software
at any time. In other words, it is proposed to
transform the synchronous system into an
asynchronous one. Secondly, a larger number of
classes can be included so as to offer greater
freedom of manipulation to the users. Thirdly, it is
worth mentioning that the modules of the miBCI
software are subject to constant improvement.
Examples of such improvement are the following.
The mechanism for loading EEG data in the offline
analysis could be adapted to read BDF-files, and not
only mat-files. The feature selection may involve
other typical methods used in BCI research such as
principal component analysis. The variety of
classifiers can be enriched by including algorithms
such as neural networks.
REFERENCES
Albanese, D. et al., 2012. mlpy: Machine Learning
Python. New York: Cornell University.
Alonso-Valerdi, L. M. & Sepulveda, F., 2011.
Programming an offline-analyzer of motor imagery
signals via python language. Boston, pp. 7861-7864.
Alonso-Valerdi, L. M. & Sepulveda, F., 2011. Python in
Brain-Computer Interfaces (BCI): Development of a
BCI based on Motor Imagery. Colchester, pp. 74-79.
Bishop, C. M., 2006. Pattern Recognition and Machine
Learning. New York: Springer.
Center, O. S., 2006. Octave and Python: High-level
scripting languages productivity and performance
evaluation, Ohio: archive.osc.edu.
Chang, C.-C. & Chih-Jen, L., 2011. LIBSVM: a library for
support vector machines. ACM Transactions on
Intelligent Systems and Technology (TIST), 2(3), p. 27.
Delorme, A. et al., 2010. MATLAB-based tools for BCI
research. In: Brain-Computer Interfaces: Applying our
Minds to Human-Computer Interaction. London:
Springer-Verlag, pp. 241-260.
Delorme, A. & Makeig, S., 2004. EEGLAB: an open
source toolbox for analysis of single-trial EEG
dynamics including independent component analysis.
Journal of Neuroscience Methods, Volume 134, pp. 9-
21.
Fangohr, H., 2004. A comparison of C, MATLAB, and
Python as teaching languages in engineering.
Computational Science-ICCS, Springer Berlin
Heidelberg, pp. 1210-1217.
Hsu, C.-W., Chang, C.-C. & Lin, C.-J., 2003. A practical
guide to support vector classification.
Hunter, J. D., 2007. Matplotlib: A 2D graphics
environment. Computing in Science and Engineering,
9(3), pp. 0090-95.
Ishak, K. A., 2009. MATLAB tutorial of fundamental
programming, Malaysia: University Kebangsaan.
Klein, A. & Reilink, B., 2013. Pyzo, a free and open-
source computing environment based on Python, The
Netherlands: http://www.pyzo.org/about_pyzo.html.
Klimesch, W., 1999. EEG alpha and theta oscillations
reflect cognitive and memory performance: a review
and analysis. Brain Research Reviews, Volume 29, pp.
169-195.
Kothe, C. A. & Makeig, S., 2013. BCILAB: a platform for
brain–computer interface development. Journal of
Neural Engineering, 10(5), p. 056014.
Kropotov, J. D., 2009. Part I: EEG Rhythms. In:
Quantitative EEG, Event-Related Potentials and
Neurotherapy. 1st ed. San Diego(California):
Academic Press - Elsevier, pp. 1-180.
Leeb, R., Scherer, R., Keinrath, C. & Pfurtscheller, G.,
2007. Combining BCI and virtual reality: scouting
virtual worlds. In: Toward Brain-Computer
PhyCS2015-2ndInternationalConferenceonPhysiologicalComputingSystems
42

Interfacing. Cambridge: Massachusetts Institute of
Technology Press, pp. 393-408.
Lindstrom, G., 2005. Programming with python, IT
professional: IEEE Computer Society.
Mason, S. G. & Birch, G. E., 2003. A general framework
for brain-computer interface design. IEEE
Transactions on Neural Systems and Rehabilitation
Engineering, March, 11(1), pp. 70-85.
Mellinger, J. & Schalk, G., 2007. BCI2000: A general-
purpose software platform for BCI. In: Toward Brain-
Computer Interfacing. Cambridge: MIT Press, pp.
359-368.
Oliphant, T. E., 2007. Python for scientific computing.
Computing in Science and Engineering, 9(3), pp. 10-
20.
Perez, F., Granger, B. & Hunter, J., 2011. Python: an
ecosystem for scientific computing. Computing in
Science and Engineering, 13(2), pp. 13-21.
Pfurtcheller, G. et al., 2007. Graz-brain-computer inteface:
Sate of research. In: G. Dornhege, et al. eds. Toward
Brain-Computer Interfacing. Cambridge: The MIT
Press, pp. 65-84.
Pfurtscheller, G., Leeb, R., Faller, J. & Neuper, C., 2011.
Brain-computer interface systems used for virtual
reality control. In: Virtual Reality. InTech, pp. 4-20.
Pfurtscheller, G. & Lopes da Silva, F. H., 1999. Event-
related EEG/EMG synchronization and
desynchronization: basic principles. Clinical
Neurophysiology, 110(11), pp. 1842-1857.
Ramoser, H., Müller-Gerking, J. & Pfurtscheller, G., 2000.
Optimal spatial filtering of single trial EEG during
imagined hand movement. IEEE Transactions on
Neural Systems and Rehabilitation Engineering, 8(4),
pp. 441-446.
Renard, Y. et al., 2010. OpenViBE: An open-source
software platform to design, test, and use brain-
computer interfaces in real and virtual environments.
Presence: teleoperators and virtual environments,
19(1), pp. 35-53.
Schlogl, A. & Brunner, C., 2008. BioSig: a free and open
source software library for BCI research. Computer,
41(10), pp. 44-50.
Schlögl, A., Brunner, C., Scherer, R. & Glatz, A., 2007.
BioSig: An open-source software library for BCI
research. In: Toward Brain-Computer Interfacing.
Cambridge: MIT Press, pp. 347-358.
Sörnmo, L. & Laguna, P., 2005. Bioelectrical Processing
in Cardiac and Neurological Applications. New York:
Academic Press.
Spacek, M. & Swindale, N., 2009. Python in
neuroscience, Pyt DOI: http://dx.doi.org/10.2417/
1200907.1682: The Neuromorphic Engineer.
ImplementationofaMotorImagerybasedBCISystemusingPythonProgrammingLanguage
43
