
Identifying Aging Genes in the Aging Mouse Hypothalamus Using
Gateway Node Analysis of Correlation Networks
Kathryn M. Cooper
1
, Stephen Bonasera
2
and Hesham Ali
1
1
College of Information Science and Technology, University of Nebraska at Omaha, Nebraska, U.S.A.
2
Department of Internal Medicine, University of Nebraska Medical Center, Nebraska, U.S.A.
Keywords: Gateway Nodes, Correlation Networks, Graph Models, Aging.
Abstract: High-throughput studies continue to produce volumes of data, providing a wealth of information that can be
used to better guide biological research. However, models that can readily identify true biological signals
from this data have not been developed at the same rate, due in part to a lack of well-developed algorithms
that can handle the magnitude, variability and veracity of the data. One promising and effective solution to
this complex issue is network modeling, due to its capabilities for representing biological elements and
relationships en masse. In this research, we use correlation networks for analysis where genes are
represented as nodes and indirect relationships (derived from expression patterns) are represented as edges.
Here, we define “gateway” nodes as elements representing genes that change in co-expression and possibly
co-regulation between states. We use the gateway node approach to identify critical genes in the aging
mouse brain and perform a cursory investigation of the robustness of these gateway nodes according to
network structure. Our results highlight the power of the gateway nodes approach and show how it can be
used to limit search space and determine candidate genes for targeted studies. The novelty of this approach
lies in application of the gateway node approach on novel mouse datasets, and the investigation into
robustness of network structures.
1 INTRODUCTION
Recently, network analysis methods have been
developed to analyze and draw signal from large,
high-throughput datasets. These methods include the
use of correlation networks, protein-protein
interaction networks, genetic interaction networks,
metabolic networks, and more. Commonly used to
describe networks of co-expression, the correlation
network model uses nodes to represent genetic
probes and edges to represent a correlated pattern of
gene expression between samples, defined by
condition, time, or other environmentally
quantifiable criterion. This technique has been
proposed for identifying differentially expressed
genes where traditional methods (such as Gene Set
Enrichment Analysis) do not always return desirable
results(Benson, Breitling 2006, Reverter, Chan
2008, Horvath, Dong 2008). As such, correlation
networks also serve as a valuable supplement to
traditional approaches.
While typically used for studying one particular
state individually, the correlation network can also
be used for comparison of states. A recent study by
Dempsey and Ali(Dempsey, Ali 2014) uses
clustering in correlation networks, particularly
clustering that identifies small, densely coA nnected
groups of genes, to compare datasets from the same
cell lines under different conditions. This analysis
revealed that clusters between states typically do not
overlap except for at a limited number of genes.
These genes that connect differentially to two
different states are termed “gateway nodes.” It has
been proposed that these gateway nodes, which are
thought to represent genes that are co-expressed with
two different sets of genes at different states, can
reveal a small, finite set of genes related to the
phenotype under scrutiny, making this approach
appealing when using high-throughput data –
typically, in studies comparing 10,000 to 40,000
genes in two or more different states, typically only
20 to 100 gateway nodes result from analysis,
depending on parameterization. Further studies on
clusters in correlation networks have found that
almost all clusters contain predicted and actual
transcription factor binding sites for common
regulatory elements(Dempsey, Ali 2014). This
36
M. Cooper K., Bonasera S. and Ali H..
Identifying Aging Genes in the Aging Mouse Hypothalamus Using Gateway Node Analysis of Correlation Networks.
DOI: 10.5220/0005212600360043
In Proceedings of the International Conference on Bioinformatics Models, Methods and Algorithms (BIOINFORMATICS-2015), pages 36-43
ISBN: 978-989-758-070-3
Copyright
c
2015 SCITEPRESS (Science and Technology Publications, Lda.)
indicates that potentially, gene co-expression and
even possibly co-regulated could be mined from this
type of network, if such a relationship exists.
Since 1999, the network model that is
representative of biological data has found structure
and function to be related(Barabasi, Albert 1999),
particularly when the network is built using clean
data. In the protein-protein interaction networks,
high degree or hub nodes typically are more likely to
be lethal(Jeong et al. 2001, Barabasi, Oltvai 2004,
Albert 2005) clusters in these same networks
represent proteins that complex together for
functional purpose(Bader, Hogue 2003). In a genetic
interaction network, which represents the
relationships between genes when both are
simultaneously knocked out or down, the
relationship represents some measure of how
beneficial (or, more likely, detrimental) the duel
silencing is on the organism(Michaut et al. 2011).
Structures identified in these networks can lead to
identifying of genes with common pathways. The
correlation network is also known for these structure
function relationships – hubs, while not as obviously
lethal, can be enhanced to reveal lethal
properties(Dempsey et al. 2012), clusters have been
found to represent real sets of functionally related
genes(Horvath, Dong 2008), and gateway nodes
give insights into which genes play a pivotal role in
the changes in expressions from one environment to
another.
To investigate the novelty of gateway nodes in a
number of datasets with mediocre differential gene
analysis results, three datasets from varying brain
tissues of mice at 2 to 3 ages were analyzed using
the gateway nodes approach. It can be speculated
that cluster density has an impact on biological
function in correlation networks. The nature of
correlation network construction suggests that in a
network where genes are nodes and edges are
correlated patterns of expression, a clique (a network
where all nodes are connected to all other nodes) is
theoretically a more reliable or likely representation
of co-expression than a less connected cluster (also
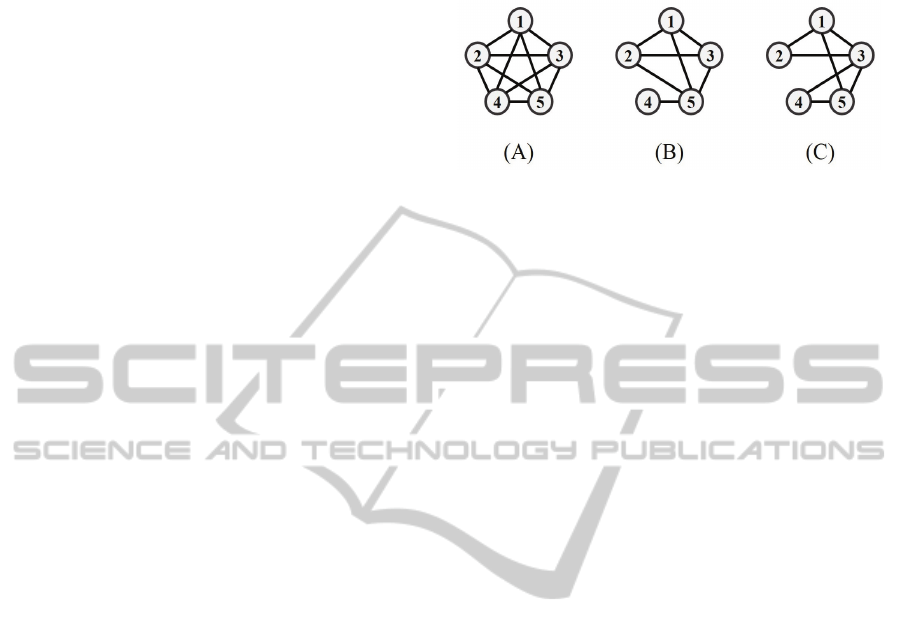
known as a semi-clique). Consider two “clusters” of
5 genes each, one where all 5 nodes are completely
connected (10 edges) and another where the cluster
is only semi-complete (say, having 7 edges or 70%
edge density). In the example 1 below, clusters A, B,
and C all contain 7 edges – in example B, it seems
likely that edge 4—5 is incorrect, and 1-2-3-4 are
likely co-expressed. In C, it seems likely by
examining K
3
s that 1-2-3, 1-3-5, and 3-4-5 are all
highly correlated, but if that were truly the case, it
would stand to reason that 2-5 and 2-4 should also
be connected.
The best evidence without examining cluster
substructure is example A in this case, the densest.
To investigate the influence of density related
cutoffs on the gateway node, clusters were analyzed
using a density filter of 65-100% (65%), 75-100%
(75%) and 85-100% (85%). The goal of this study
was to analyze aging in the brain and possibly
identify the pathway players with roles in neuronal
growth and differentiation. Gateway node analysis
was again used for its application to aging and for its
design for identifying temporal expression changes.
The beauty of this and other case studies is that they
satisfy a need for application of methods to real
world data and testing of hypotheses. The results of
this study reveal a number of genes that are known
players of change in aging in the mouse brain, and
highlights how gateway nodes can be used to
identify targets of further study in similar cases.
2 METHODS
The network model used was created using data
prepared and analyzed with pairwise Pearson
Correlation (see Network Creation & Enrichment
Analysis) and was then clustered and gateway nodes
were identified (see Gateway Node Analysis).
Targets were then identified via model creation.
2.1 Network Creation and Enrichment
Analysis
Data was drawn from three microarray expression
datasets for this analysis; three were prepared in
total: (1) Cerebellum from Balb/C mice at three time
points (Young, Middle-aged, and Aged), (2)
Striatum from Balb/C mice at three time points
(Young, Middle-aged, and Aged), and (3)
Hypothalamus from male C57 mice at two time
points (Young and Middle-aged). Correlation
networks were generated using probes and
expression values from using pairwise computation
of the Pearson Correlation Coefficient (ρ) and
IdentifyingAgingGenesintheAgingMouseHypothalamusUsingGatewayNodeAnalysisofCorrelationNetworks
37
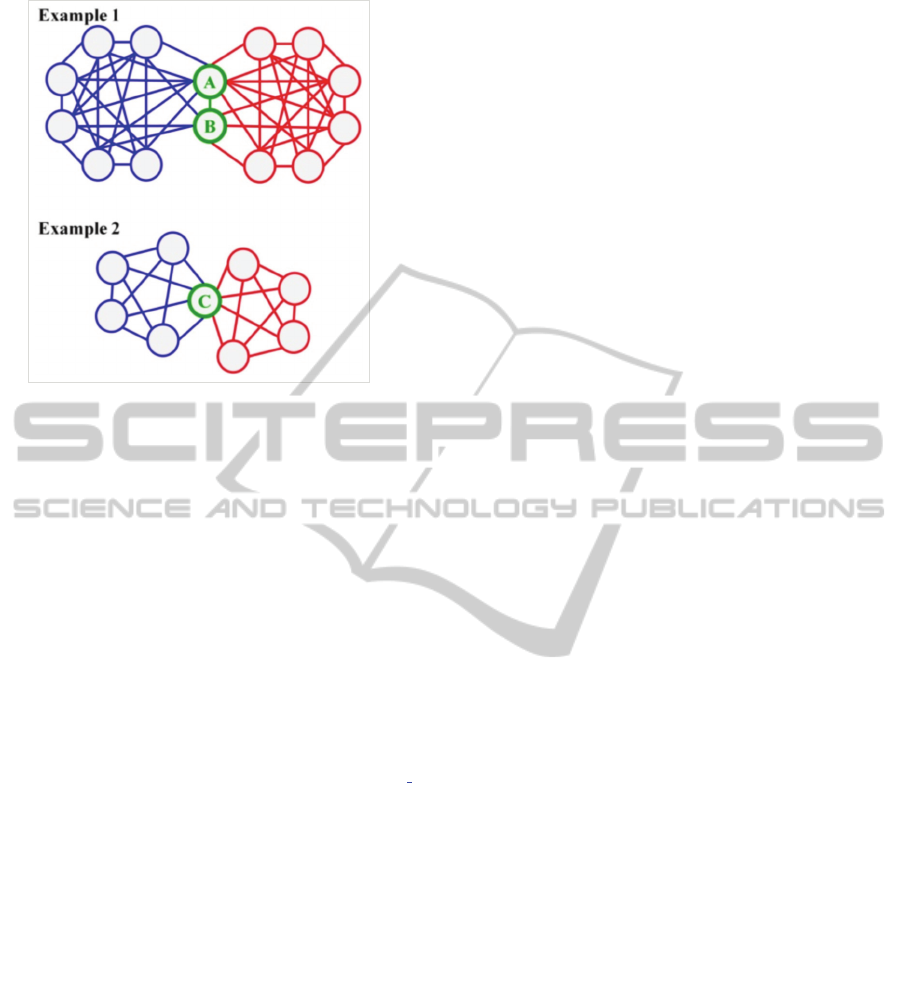
Figure 1: An example of how gateway nodes are scored.
In example 1, gateway nodes A and B are identified from
the overlap between network 1 (blue) and network 2 (red).
Node A has 6 edges in network 1 and 6 edges in network 2
(not including edge A-B). Node B has 3 edges in network
1 and 3 edges in network 2 (not including edge A-B).
Therefore, the total edge responsibility (total edges)
connecting gateway nodes is 18. A therefore has 12/18 or
66% gatewayness and B has 6/18 or 33% gatewayness. In
example 2, gateway node C has 4 edges in both network 1
and network 2, for a total of 8/8 or 100% gatewayness.
correlation threshold of 0.85≤ ρ ≤1.00. For each
pairwise correlation computation, hypothesis testing
using the Student’s T-test was performed; only
significant correlations (P-value <0.0005) were kept.
Gene Set Enrichment Analysis was performed using
the GeneTrail Analysis tool (http://genetrail.bioinf.
uni-sb.de/)(Backes et al. 2007). Parameters for each
analysis were set as follows:
• Organism: Mus musculus
• Analysis Type: KEGG, Gene Ontology
(manually curated only)
• P-value adjustment: FDR Adjustment
• P-value threshold: 0.05
• Minimum # categories: 2
2.2 Gateway Node Analysis
In brief, gateway nodes are identified by first
clustering networks, then networks are overlapped
and nodes that have edges in networks from both
conditions are iteratively identified. To perform
clustering, AllegroMCODE(Bader, Hogue 2003)
was used on each network under the following
parameters: Degree cutoff:10, Node Score: 0.2, K-
Core:10, MaxDepth: 10. Clustering time ranged
from 89.436 seconds (Male C57 young network) to
29,499.495 seconds (Cerebellum Balb/C young
network). Clustering correlation networks is known
to improve the lethality enrichment of high degree
nodes, largely because important hub nodes in
correlation networks are understood to be contained
within clusters. While the choice of clustering
method may vary, the lethality enrichment findings
were conducted using AllegroMCODE which
identifies many small, dense clusters. As such, this
work also includes a cursory review of how
clustering density impacts the robustness of the
gateway node. After clustering was performed,
clusters were filtered to three different arbitrarily
chosen density thresholds: clusters at or above 65%
density, at or above 75% density, and at or above
85% density. Density is defined as the number of
total edges in the network divided by the number of
possible edges – in a network with N nodes and no
duplicate edges or self-loops, the number of possible
edges is equal to [N*(N-1)]/2. As the density
threshold changes, the number of gateway nodes
present within the overlaid network changes, and as
such, it is important to consider numerous thresholds
to see if a gateway exists as an artifact of clustering
or it exists as a true gateway node, or gene that is co-
expressed with a unique group of genes in two or
more different states.
After the clustering step, networks are overlaid
on top of one another to identify gateway nodes. The
process used to identify these nodes in an automatic
way is extensively described in Dempsey and Ali
2014. Briefly, for each node in the clustered,
overlaid network, each node is first classified as
having edges in one or both networks. If the node
has edges in both networks, it is technically
considered a gateway. Scoring is then performed by
examining the number of edges per gateway per
cluster overlap versus the total number of gateway
edges (excluding intra-gateway edges). This ratio is
the gatewayness score, and reflects the
“responsibility” of each gateway in terms of how
many edges pass through that particular node from
one stage to another. An example of the difference is
shown in Figure 1. Gateway nodes were identified at
each density threshold, heretofore referenced as 65%
(at or above 65% cluster density), 75% (at or above
75% cluster density), and 85% (at or above 85%
cluster density).
After determination of gateway nodes at each
density threshold and Gene Ontology (GO)
enrichment of each gateway-connected cluster
(Ashburner et al. 2000), a model was drawn to
connect genes based on shared processes in which
BIOINFORMATICS2015-InternationalConferenceonBioinformaticsModels,MethodsandAlgorithms
38
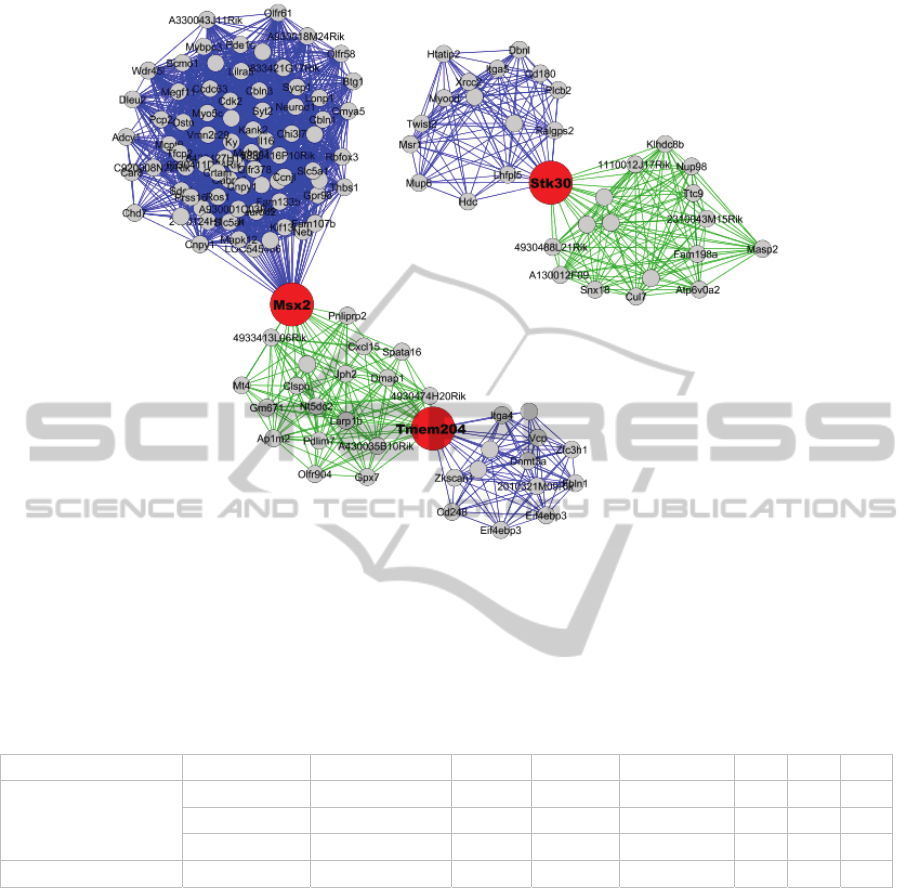
Figure 2: The 65% gateway clusters from Male c57 Hypothalamus networks. Gateway nodes are in red. These are the
clusters examined using Gene Ontology in Table 2.
Table 1: Gateways by dataset. Gateways not present at 1 density only not shown. Column 1: Dataset in which gateway was
found. Column 2: Array ID for the gateway. Column 3: Gene Symbol for the gateway. Column 4: Edges running through
the gateway. Column 5: Total edges running through gateways connecting the two clusters. Column 6: Gatewayness score.
Column 7: If the gateway was found using 65% edge density clustering, the box is marked. Column 8: If the gateway was
found using 75% edge density clustering, the box is marked. Column 9: If the gateway was found using 85% edge density
clustering, the box is marked.
Dataset Array ID Gene Symbol Edges Total Edges Gateway Score 65% 75% 85%
Male c57 Hypothalamus A_51_P493919 Stk30 31 31 100.00% X X
X
A_51_P478132 2210019G11Rik 205 205 100.00% X X
A_52_P78684 D330040H18Rik 174 174 100.00% X X
Balb/c Cerebellum A_51_P346893 Extl1 182 182 100.00% X X
the gateway nodes are involved, if known. This
model was manually curated using the following
resources: Literature via PubMed search and review,
KEGG pathway database (Aoki, Kanehisa 2005),
and NCBI, and included regulatory relationships,
inhibitory relationships, binding relationships, etc.
This section must be in one column.
3 RESULTS
Before clustering, network sizes ranged from
38k41k nodes and 312k-7,600k edges. After
clustering, node counts ranged from 30-8k and edges
from 300-86k. Thus, network sizes changed
depending on state and tissue. As described in Table
1, the Male c57 Hypothalamus dataset contained the
fewest gateway nodes (3), with only one gene
(Stk30) found to be robust to changes at 65%, 75%,
and 85% cluster densities. The other two gateway
nodes were only found at 65% density (Tmem204,
Msx2). All three gateway nodes in this case had
scores of 100% gatewayness. The Balb/c cerebellar
dataset contained 7 gateway nodes, none of which
were robust to all three thresholds. Three were
robust to two thresholds, but only one of these are
non-RIKEN probes (Extl1). Two gateways in this set
that did not have 100% gatewayness were found
only at 65% cluster density and were shared between
IdentifyingAgingGenesintheAgingMouseHypothalamusUsingGatewayNodeAnalysisofCorrelationNetworks
39

Table 2: Cluster Gene Ontology Set Enrichment Analysis for Male c57 Hypothalamus dataset. Column 1: The gateway
name. Column 2: The cluster connecting that gateway – young or mid (not both combined) and edge color. Gene Ontology
enrichment (GO) or KEGG enrichment (KEGG). Column 3: GO/KEGG annotation or pathway name. Column 4:
Annotation/pathway ID. Column 5: The number of genes in that annotation/pathway name. Column 6: The p-value
associated with that enrichment. Column 7: If “down”, the cluster has fewer genes in that annotation/pathway than expected
for random. If “up”, the cluster has more genes in that annotation/pathway than expected for random. *FDR Adjustment
was used, but if a * is included in the P-value column, this indicates the annotation did not survive P-value adjustment and
the noted P-value is the unadjusted value.
Gateway
Cluster
Description
GO/
Category ID
#
Genes
P-value
Enrich
.
KEGG
Tmem204 Aged-Blue G.O. Cell GO:0005623 4 0.04* down
G.O. cell part GO:0044464 4 0.04* down
Tmem204 Yng – Green G.O. membrane GO:0016020 2 0.044* down
G.O. multicellular organismal process GO:0032501 4 0.045* down
G.O. cytoplasm GO:0005737 5 0.048* down
Msx2 Yng – Green G.O. membrane GO:0016020 2 0.044* down
G.O. multicellular organismal process GO:0032501 4 0.045* down
G.O. cytoplasm GO:0005737 5 0.048* down
Msx2 Aged-Blue KEGG ECM-receptor interaction 4512 2 0.013* down
KEGG Malaria 5144 2 0.013* down
KEGG Olfactory transduction 4740 3 0.015* down
G.O. biological regulation GO:0065007 22 0.009* down
G.O. cell GO:0005623 24 0.012* down
G.O. cell part GO:0044464 24 0.012* down
G.O. regulation of biological quality GO:0065008 4 0.012* down
G.O. multicellular organismal process GO:0032501 19 0.012* down
G.O. cellular process GO:0009987 26 0.017* Down
G.O. membrane part GO:0044425 7 0.024* Down
G.O. regulation of biological process GO:0050789 21 0.026* Down
G.O. non-membrane-bounded organelle GO:0043228 6 0.034* Down
G.O.
intracellular non-membrane-bounded
organelle
GO:0043232 6 0.034* Down
G.O. regulation of localization GO:0032879 4 0.035* Down
G.O. cellular component assembly GO:0022607 7 0.035* Down
G.O. cellular component biogenesis GO:0044085 7 0.035* Down
G.O. negative regulation of biological process GO:0048519 7 0.041* Down
G.O. membrane GO:0016020 10 0.044* Down
G.O. system process GO:0003008 12 0.045* Down
G.O. regulation of cellular process GO:0050794 16 0.046* Down
G.O. molecular_function GO:0003674 51 0.046* Up
Stk30 Aged-Blue KEGG Phagosome 4145 2 0.038* Up
G.O. binding GO:0005488 8 0.021* Up
G.O. plasma membrane GO:0005886 4 0.031* Up
G.O. membrane GO:0016020 4 0.031* Up
G.O. cytosol GO:0005829 3 0.035* Up
G.O. regulation of localization GO:0032879 2 0.038* Up
Stk30 Yng – Green G.O. organelle GO:0043226 2 0.042 Up
G.O. membrane-bounded organelle GO:0043227 2 0.042 Up
G.O. intracellular organelle GO:0043229 2 0.042 Up
G.O.
intracellular membrane-bounded
organelle
GO:0043231 2 0.042 Up
G.O. intracellular part GO:0044424 2 0.042 Up
BIOINFORMATICS2015-InternationalConferenceonBioinformaticsModels,MethodsandAlgorithms
40
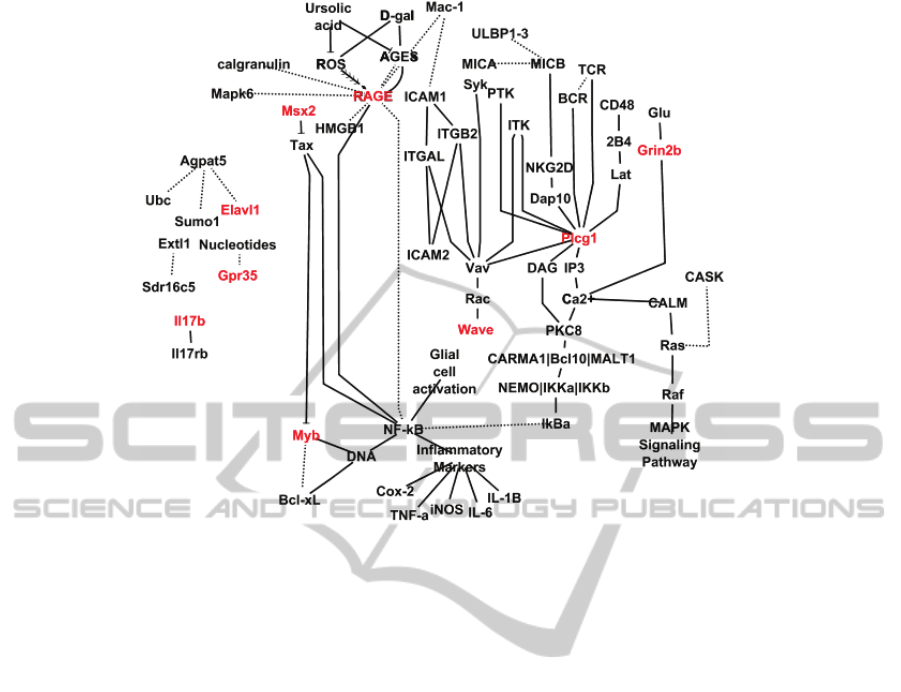
Figure 3: The curated gateway nodes model. Genes/proteins in red are gateway nodes as listed above. Not all nodes listed
above are in the model if they do not fit or pathway information is not available. This model is not comprehensive.
two clusters – Gm8221 at 48.63% gatewayness and
Apol7c at 51.37% gatewayness. The Balb/c striatum
dataset contained the most gateway nodes at 67;
however, 19 of these were RIKEN or
unknown/unnamed genes. All the gateway nodes in
this set were not robust past 65% cluster density.
The top gateway nodes identified from Table 1
that were robust to density changes were Stk30, two
RiKEN hypothetical genes, and Extl11. Gene
Ontology enrichment analysis was performed on all
three datasets; the enrichment data was not used
particularly for gateway analysis but for consistency
and integrity of analysis to ensure biological
functions were found, indicating cluster relevance.
Results for GO enrichment on Male C57/Bl/6 mice
clusters are shown in Table 2 (results for Balb/c
datasets not shown). Based on the gateway node
analysis, Stk30 (coding for the RAGE protein) and
Extl1 are the only gateways that are non-RIKEN
genes that are robust to multi-clustering thresholds.
Based on literature collection and model curation,
Stk30 (aka RAGE) is the most upstream target that
interacts with reactive oxygen species and is also
upstream of NF-kB. Gateway node Msx2 is also
upstream of the NF-kB pathway acting as an
inhibitor of Tax gene which induces NF-kB
enhancing transcription factors. Myb is a
downstream target gateway that has ties to the
apoptotic pathway and the NF-kB pathway. Plcg1 is
acted upon by multiple proteins and goes on to
influence DAG and IP3, both (way) upstream of NF-
kB. Upstream of the same route to NF-kB as Plcg1,
the gateway node Grin2b is influenced by glucose.
4 CONCLUSIONS
Based on the gateway node analysis, Stk30 (coding
for the RAGE protein) and Extl1 are the only
gateways that are non-RIKEN genes that are also
robust to multi-clustering thresholds. The literature
collected and resulting model reveal that Stk30 aka
RAGE is the most upstream target that interacts with
reactive oxygen species and is also upstream of NF-
kB. In entirety, the model proposed above points to
activation of inflammation via NF-kB and RAGE as
a map for aging in normal Balb/C and C57 mouse
brain. A 2009 review by Kriete and Mayo confirms
a link between NF-kB activation and aging, but calls
for further investigation of the role of NF-kB outside
its well-studied role in the innate immune system
(Kriete, Mayo 2009). In our model, gateway node
Msx2 is also upstream of the NF-kB pathway acting
as an inhibitor of Tax gene which induces NF-kB
enhancing transcription factors. Myb is a
downstream target gateway that has ties to the
IdentifyingAgingGenesintheAgingMouseHypothalamusUsingGatewayNodeAnalysisofCorrelationNetworks
41

apoptotic pathway and the NF-kB pathway. Plcg1 is
acted upon by multiple proteins and goes on to
influence DAG and IP3, both (way) upstream of NF-
kB. Upstream of the same route to NF-kB as Plcg1
is Grin2b, influenced by glucose. All of these genes
have potential as effectors for change in the NF-kB
pathway, either upstream or downstream, but
perhaps the most important element in the model
due to gateway robustness is the RAGE protein,
encoded by gateway node Stk30. A 2003 study by
Deane et al. revealed that RAGE is a mediator of
disease-causing amyloid-beta proteins into the
central nervous system, and even suggests it as a
target for potential future therapies for Alzheimer’s
disease (Deane et al. 2003). RAGE has been found
to be up-regulated in Alzheimer’s patients (Leclerc
et al. 2009).
A 2004 study of transgenic mice with
manipulated RAGE (mAPP
-
/RAGE
-
) expression by
Arancio et al. found that pups displayed issues with
spatial memory and the NF-kB pathway is activated,
and again find it a potential target for Alzheimer’s
intervention (Arancio et al. 2004). Multiple other
evidences exist to substantiate the speculation that
RAGE plays a role in normal aging; an October
2013 PubMed search of “RAGE” + “Aging” reveals
over 100 articles relating RAGE and aging dating
back to 1999.
Application of the gateway nodes approach
allows for the utilization of the gateway nodes
approach to determine better targets for study in the
aging mouse brain. The accompanying model
provides a roadmap that points us toward RAGE,
Msx2, and Plcg1 as upstream targets for
manipulation for manipulation of expression in the
mouse brain. These genes all have indirect roles in
the NF-kB pathway; it has recently been shown that
inhibition of NF-kB in the mouse hypothalamus
resulted in a 20% increase in lifespan, improved
cognition, and levels of muscle, bone, and skin
tissue typically observed in younger mice. This
suggests that the gateway nodes approach is able to
identify genes with major roles in aging, particularly
using a robust approach. This method is able to take
sets of 30,000+ genes or gene probes and narrow it
down to only a few targets of interest, and their
potential relationships based on network modeling
of expression correlation and integration of publicly
available databases. Particularly in areas of research
where little is understood, funding is not readily
available, or resources are tight, the gateway nodes
approach can provide a robust, reproducible, and
reliable way to identify targets of interest in further
research.
Certainly, current methods for analyzing gene
expression capture just a snapshot of cellular activity
at a given time, not a dynamic process. However, the
minimal overlap of co-expression relationships in
the network form confirm that the cellular
environment is dynamic and spontaneous. This begs
the question – does a snapshot of the cell, even in
multiple replicates – accurately capture the goings-
on of cellular activity? If we were able to understand
how we got from point A to point B, we would
better understand how these gateway nodes came
about. Surely on a short-term basis gateway nodes
could arise form differential regulation of
expression, but in the long term, the question is
whether the clusters captured are a result of a short-
term cellular change or a compensatory effect of loss
of previous gene function. To improve the
dimensionality of these analyses without vastly
increasing the data load, one might consider
modifying their gene expression research design to
include 3 or more time points and to include a high
number of replicates for each time point (ideally, 5
or more). While this is certainly not always feasible
due to cost, labor, or difficulty in sample
preparation, it could be considered to help
understanding of cellular dynamics using a network
model.
ACKNOWLEDGEMENTS
This publication was made possible by Grant
Number P20 RR16469 from the National Center for
Research Resources (NCRR), a component of the
National Institutes of Health (NIH) and it's contents
are the sole responsibility of the authors and do not
necessarily represent the official views of NCRR or
NIH.
REFERENCES
Albert, R. 2005, "Scale-free networks in cell biology",
Journal of cell science, vol. 118, no. Pt 21, pp. 4947-
4957.
Aoki, K.F. & Kanehisa, M. 2005, "Using the KEGG
database resource", Current protocols in
bioinformatics / editoral board, Andreas D.Baxevanis
[et al.], vol. Chapter 1, pp. Unit 1.12.
Arancio, O., Zhang, H.P., Chen, X., Lin, C., Trinchese, F.,
Puzzo, D., Liu, S., Hegde, A., Yan, S.F., Stern, A.,
Luddy, J.S., Lue, L.F., Walker, D.G., Roher, A.,
Buttini, M., Mucke, L., Li, W., Schmidt, A.M., Kindy,
M., Hyslop, P.A., Stern, D.M. & Du Yan, S.S. 2004,
"RAGE potentiates Abeta-induced perturbation of
BIOINFORMATICS2015-InternationalConferenceonBioinformaticsModels,MethodsandAlgorithms
42

neuronal function in transgenic mice", The EMBO
journal, vol. 23, no. 20, pp. 4096-4105.
Ashburner, M., Ball, C.A., Blake, J.A., Botstein, D.,
Butler, H., Cherry, J.M., Davis, A.P., Dolinski, K.,
Dwight, S.S., Eppig, J.T., Harris, M.A., Hill, D.P.,
Issel-Tarver, L., Kasarskis, A., Lewis, S., Matese, J.C.,
Richardson, J.E., Ringwald, M., Rubin, G.M. &
Sherlock, G. 2000, "Gene ontology: tool for the
unification of biology. The Gene Ontology
Consortium", Nature genetics, vol. 25, no. 1, pp. 25-
29.
Backes, C., Keller, A., Kuentzer, J., Kneissl, B.,
Comtesse, N., Elnakady, Y.A., Muller, R., Meese, E.
& Lenhof, H.P. 2007, "GeneTrail--advanced gene set
enrichment analysis", Nucleic acids research, vol. 35,
no. Web Server issue, pp. W186-92.
Bader, G.D. & Hogue, C.W. 2003, "An automated method
for finding molecular complexes in large protein
interaction networks", BMC bioinformatics, vol. 4, pp.
2.
Barabasi, A.L. & Albert, R. 1999, "Emergence of scaling
in random networks", Science (New York, N.Y.), vol.
286, no. 5439, pp. 509-512.
Barabasi, A.L. & Oltvai, Z.N. 2004, "Network biology:
understanding the cell's functional organization",
Nature reviews.Genetics, vol. 5, no. 2, pp. 101-113.
Benson, M. & Breitling, R. 2006, "Network theory to
understand microarray studies of complex diseases",
Current Molecular Medicine, vol. 6, no. 6, pp. 695-
701.
Deane, R., Du Yan, S., Submamaryan, R.K., LaRue, B.,
Jovanovic, S., Hogg, E., Welch, D., Manness, L., Lin,
C., Yu, J., Zhu, H., Ghiso, J., Frangione, B., Stern, A.,
Schmidt, A.M., Armstrong, D.L., Arnold, B.,
Liliensiek, B., Nawroth, P., Hofman, F., Kindy, M.,
Stern, D. & Zlokovic, B. 2003, "RAGE mediates
amyloid-beta peptide transport across the blood-brain
barrier and accumulation in brain", Nature medicine,
vol. 9, no. 7, pp. 907-913.
Dempsey, K., Thapa, I., Bastola, D. & Ali, H. 2012,
"Functional identification in correlation networks
using gene ontology edge annotation", International
journal of computational biology and drug design, vol.
5, no. 3-4, pp. 222-244.
Dempsey, K.M. & Ali, H.H. 2014, "Identifying aging-
related genes in mouse hippocampus using gateway
nodes", BMC systems biology, vol. 8, pp. 62-0509-8-
62.
Horvath, S. & Dong, J. 2008, "Geometric interpretation of
gene coexpression network analysis", PLoS
computational biology, vol. 4, no. 8, pp. e1000117.
Jeong, H., Mason, S.P., Barabasi, A.L. & Oltvai, Z.N.
2001, "Lethality and centrality in protein networks",
Nature, vol. 411, no. 6833, pp. 41-42.
Kriete, A. & Mayo, K.L. 2009, "Atypical pathways of NF-
kappaB activation and aging", Experimental
gerontology, vol. 44, no. 4, pp. 250-255.
Leclerc, E., Sturchler, E., Vetter, S.W. & Heizmann, C.W.
2009, "Crosstalk between calcium, amyloid beta and
the receptor for advanced glycation endproducts in
Alzheimer's disease", Reviews in the neurosciences,
vol. 20, no. 2, pp. 95-110.
Michaut, M., Baryshnikova, A., Costanzo, M., Myers,
C.L., Andrews, B.J., Boone, C. & Bader, G.D. 2011,
"Protein complexes are central in the yeast genetic
landscape", PLoS computational biology, vol. 7, no. 2,
pp. e1001092.
Reverter, A. & Chan, E.K. 2008, "Combining partial
correlation and an information theory approach to the
reversed engineering of gene co-expression networks",
Bioinformatics (Oxford, England), vol. 24, no. 21, pp.
2491-2497.
IdentifyingAgingGenesintheAgingMouseHypothalamusUsingGatewayNodeAnalysisofCorrelationNetworks
43
