
Detection of Drug Administration Behavior with Swallowing Sounds
Xiaolin Sang
1
, Shin’ichi Warisawa
1,2
, Hao Zhang
1
, Katsumi Abe
3
, Masahiro Kubo
3
,
Kenichiro Tsuda
3
and Ichiro Yamada
1,2
1
School of Engineering, The University of Tokyo, 7-3-1 Hongo, Bunkyo-ku, Tokyo, Japan
2
Graduate School of Frontier Sciences, The University of Tokyo, 5-1-5 Kashiwanoha, Kashiwa, Japan
3
Green Platform Research Laboratories, NEC Corporation, 1753 Shimonumabe, Nakahara-ku, Kawasaki, Japan
Keywords: Drug Administration, Wearable Sensing, Swallowing Sounds, Wavelet Transform, Classification.
Abstract: In recent years, chronic diseases have become the main causes of death around the world, and medication
non-adherence among patients with chronic diseases is a common problem. A system for detecting drug
administration behavior in daily life is strongly required. Currently, there is not a system for detecting this
behavior by using wearable sensors. In this paper, we propose a wearable sensing method for detecting drug
administration behavior in daily life by using swallowing sound, which is available and suitable for daily
monitoring. To recognize the behavior from swallowing activities, a classification methodology using
wavelet based features as feature vectors and artificial neural network as classifier is proposed. A high
classification accuracy of 85.4% was achieved in classifying two swallowing activities of drinking water
and taking a capsule with water. Furthermore, we also propose a compensation method for time-dependent
change based on the frequency characteristics of swallowing sound.
1 INTRODUCTION
In recent years, the number of chronic diseases has
been increasing, and these diseases have become the
main causes of death around the world. Here,
medication non-adherence is a common problem
among patients with chronic diseases, which can be
blamed on forgetfulness and the high cost of
medicine. According to the World Health
Organization, increasing the effectiveness of
medication adherence intervention may have a far
greater impact on health than any improvement in
specific medical treatment (Sabaté, 2003). Feedback
gained from monitoring patients’ medication
adherence by detecting drug administration behavior
in daily life is expected to be important health-care
information for physicians.
For this reason, some researchers and companies
have been developing systems to detect drug
administration behavior. For instance, a medicine-
taking support system on a smartphone was
developed to detect the behavior by judging whether
a cup with sensors is picked up (Y.Tanabe, 2012).
An edible sensor system is being developed in
order to electronically confirm medication
adherence. The system consists of an edible sensor
attached to a capsule and a wearable health monitor.
After the sensor is ingested together with the
capsule, a wearable health monitor worn on the body
records the information from the edible sensor (Au-
Yeung, 2010).
With the development of wearable sensing
technology, the automatic detection and recognition
of some activities have been realized and applied to
our daily lives. Detecting drug administration
behavior from human activity by using wearable
sensors can guarantee such behavior with less stress
for patients.
In this research, we aimed to develop a system
for detecting drug administration behavior by using
wearable sensors. A wearable sensing system that is
available and suitable to detect such behavior and a
methodology for the detection will be introduced.
2 WEARABLE SENSING
SYSTEM FOR DETECTING
DRUG ADMINISTRATION
BEHAVIOR
To detect drug administration behavior by using
367
Sang X., Warisawa S., Zhang H., Abe K., Kubo M., Tsuda K. and Yamada I..
Detection of Drug Administration Behavior with Swallowing Sounds.
DOI: 10.5220/0005212803670373
In Proceedings of the International Conference on Health Informatics (HEALTHINF-2015), pages 367-373
ISBN: 978-989-758-068-0
Copyright
c
2015 SCITEPRESS (Science and Technology Publications, Lda.)
wearable sensors, two possible ways are to analyze
upper body motions (hands, arms, and neck) with
accelerometer and gyroscope and to analyze
swallowing activity by using internal body
microphone or surface electromyography (EMG)
(Amft, O., 2009; Klahn, M. S., 1999). Compared
with analyzing upper body motions, analyzing
swallowing activity has less related activities to
classify.
Using internal body microphone and surface
EMG are two widely used sensing methods for
evaluating swallowing activities. In some researches,
these two methods both can be used to differentiate
between swallowing activities such as swallowing
different drinks and foods with different mass
(Sazonov, E. S, 2010; Ertekin, C., 1995). However,
considering difference of swallowing water
without/with capsules making different swallowing
sounds, an internal body microphone, which can
detect their swallowing sounds, is selected in our
research..
Among various internal body microphones, a
bone-conduction microphone was selected to record
swallowing sounds for the following reasons. As
Figure 1 shows, the microphone is integrated in an
earphone-like sensor to record internal body sound
easily by inserting it into the ear. Its high sensitivity
makes it possible to record swallowing sounds with
high quality. Additionally, the microphone consists
of a microphone for internal body sound and one for
outside sound in order to record internal body sound
with little influence from environmental sound,
making it suitable for daily monitoring.
In the meal-time related activity recognition
using sounds from the bone-conduction microphone,
a high accuracy of 87% was achieved for classifying
drinking, eating hard food, eating soft food, and
speaking (H. Zhang, 2011). Therefore, the
possibility of classifying drinking and taking
medicine as two kinds of swallowing sounds that
can be detected is hypothesized and verified in the
following.
Figure 1: Bone-conduction microphone.
3 SWALLOWING ACTIVITY
CLASSIFICATION
In this section, a swallowing sound collection, the
proposed classification methodology for swallowing
activities, classification results, and discussion are
introduced.
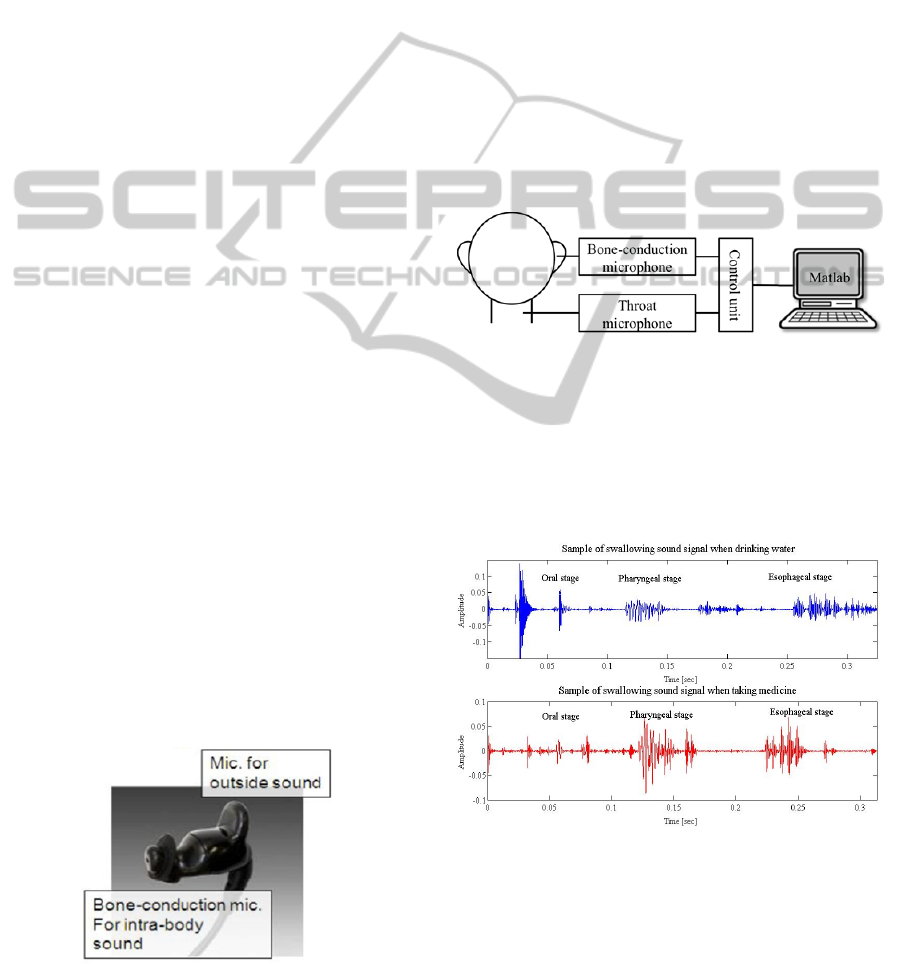
3.1 Swallowing Sound Collection
From 20 subjects, the swallowing sound signals of
drinking water (10 ml and 20 ml) and taking a
capsule with water (10 ml and 20 ml) were collected
by using the bone-conduction microphone and a
throat microphone as references, and then recorded
simultaneously with an IC recorder at a sampling
rate of 48 kHz as Figure 2 shows. The swallowing
sounds collected were analyzed with Matlab.
Figure 2: Swallowing sound collection system.
In the experiment, the substitute medicine is
prepared by putting powdered foodstuff into the
capsule shell. The subject drinks water that was
prepared and takes capsules with water at his space.
For each swallowing activity, five samples of sound
signals were recorded.
Figure 3: Swallowing sound signals when drinking water
and taking medicine.
An example of swallowing sound signals when
drinking and taking medicine is shown in Figure 3.
Swallowing sound is a non-stationary signal by
nature and can be divided into stationary segments
(Lazareck, L, 2002). About the components of
HEALTHINF2015-InternationalConferenceonHealthInformatics
368
swallowing sound, it is said that three main
components are respectively oral stage, pharyngeal
stage and esophageal stage with respect to the
position of bolus (Morinière, S, 2008).
From Figure 3, it is possible to differentiate
drinking water and taking medicine using
swallowing sounds.
3.2 Classification Methodology for
Swallowing Activities
The proposed classification method of swallowing
activities (drinking and taking medicine) can be
divided into four stages: pre-processing, feature
extraction, optimal feature selection, and
classification.
After inputting a swallowing sound segment, the
sound data is segmented and normalized. Then
features are extracted, selected and used in the
classification. Finally, whether the swallowing
activity was drinking or taking medicine is output.
3.2.1 Pre-processing
In the classification, data in the pharyngeal phase is
regarded as the target data. Raw signals are
segmented to each swallowing sound segment and
further segmented to the pharyngeal phase by
comparing the envelope calculated from a Hilbert
transform and the short-time energy of swallowing
segments (20-ms frames with a 0.2-ms shifting).
After the two-step segmentation, data in the
pharyngeal phase is normalized linearly to reduce
the individual differences and then resampled from
48 kHz to 4 kHz to obtain more detailed low-
frequency information in feature extraction.
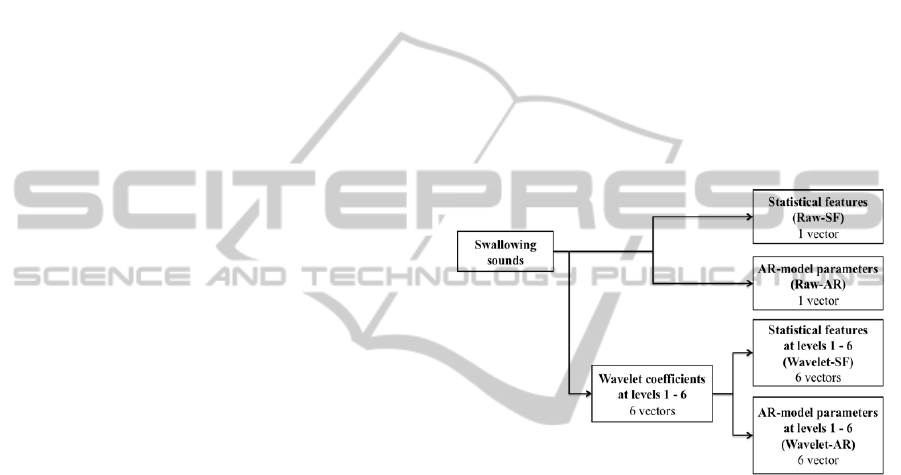
3.2.2 Feature Extraction
To differentiate the swallowing sounds made when
drinking and taking medicine, a discrete wavelet
transform is applied on data in the pharyngeal phase
of swallowing sounds. With the decomposition, six
levels of wavelet coefficients in different frequency
ranges are obtained from the raw data, and statistical
features (SF) and AR-model parameters of raw data
and wavelet coefficients at each level are then
extracted to represent the different characteristics of
swallowing sounds made when drinking and taking
medicine.
For the statistical features, six kinds of statistical
features including maximum, mean, standard
deviation, power, skewness, and kurtosis are
selected to characterize the wavelet coefficients at
each level.
For the AR-model parameters, an autoregressive
model (AR model) is used to forecast the variable of
interest by using a line combination of the past
values of the variables so that AR-model parameters
are extracted to describe the waveforms by
modelling time series information. The p-order AR
model is defined as Equation 1.
⋯
(1)
where
,
,⋯
are the AR-model parameters,
is a constant, and
is white noise.
In the feature extraction, the statistical features,
the 7-order AR-model parameter at each wavelet
level, and those from raw data are extracted
separately to classify drinking and taking medicine
(Figure 4).
Figure 4: Feature extraction.
3.2.3 Feature Selection
For each subject, the statistical features or the AR-
model parameters of a certain wavelet level were
selected as the optimal feature vectors from the six
levels of wavelet based features in Figure 4
depending on their performances for classification,
because there exist large individual differences in
swallowing sounds. Because there are only two
target activities, to avoid the case that the
classification accuracy of one activity becomes very
large and that of the other activity becomes very
low, we selected features not only regarding the
average accuracy of the two activities but also
considering the lower accuracy between them.
3.2.4 Classification
A neural network was selected as the classifier
because of its high performance and little training
time. In this research, a probabilistic neural network
DetectionofDrugAdministrationBehaviorwithSwallowingSounds
369
(PNN) and an artificial neural network (ANN) were
applied.
In the classification, because there exist large
individual differences, the smoothing parameter in a
PNN and the number of hidden layers in the
structure of an ANN were adjusted to maximize the
classification accuracy for each subject.
3.3 Classification Results
Leave-one-out cross validation was used to validate
the performance of the method for classifying
drinking and taking medicine, because it has an
advantage of maximal use of data when the number
of data is small. Figure 5 shows the average
classification accuracies of drinking and taking
medicine of 20 subjects with the raw data based
features and the wavelet based features for the two
classifiers.
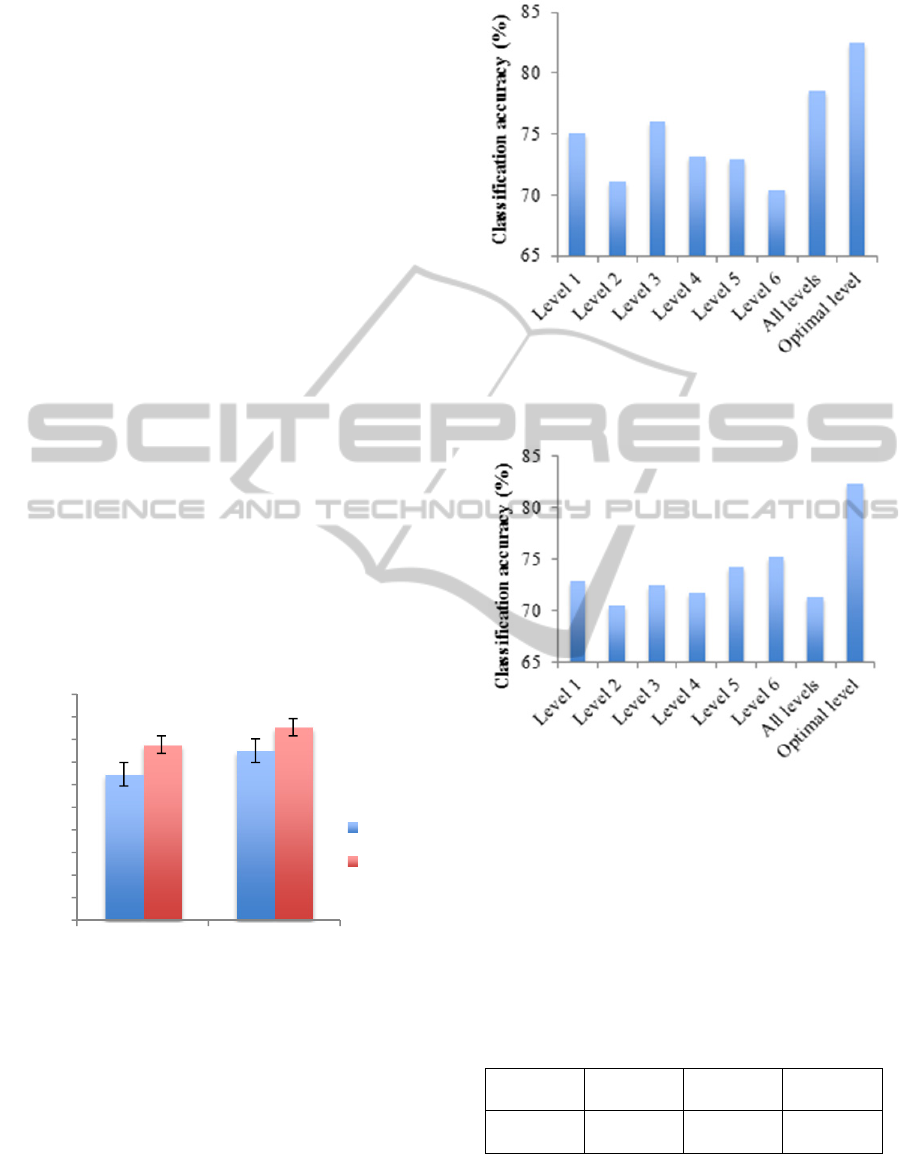
From the comparison of the classification
accuracies using different features and classifiers,
the combination of wavelet based features and ANN
classifier achieved the best performance (85.4%) for
the classification of drinking and taking medicine.
Compared with the raw data based features, the
wavelet based features proved to be more efficient at
differentiating between drinking and taking
medicine. ANN achieved more than 10% higher
classification accuracy than PNN did.
Figure 5: Comparison of classification methods.
The optimal feature selection for each subject is
an efficient way to improve classification accuracy.
For Wavelet-SF and Wavelet-AR, as the average
classification accuracy of 20 subjects is shown in
Figure 6 and Figure 7, the optimal level performed
best. Because there exist large individual
differences, the optimal level for classifying the two
swallowing activities was different in individuals.
Figure 6: Comparison of classification results (average of
20 subjects) using Wavelet-SF of levels 1 - 6, all levels,
and optimal level.
Figure 7: Comparison of classification results (average of
20 subjects) using Wavelet-AR of levels 1 - 6, all levels,
and the optimal level.
The detailed average classification accuracy of
20 subjects is shown in Table 1. An average
classification accuracy of 85.4% was achieved based
on swallowing sound signals of 20 subjects. The
classification accuracy of each subject ranges from
76.5% to 100%.
Table 1: Detailed classification accuracy (average of 20
subjects).
Activity Drinking
Taking
medicine
Overall
Average
accuracy
85.0% 85.8% 85.4%
3.4 Discussion
The swallowing sound consists of the sound of bolus
0
10
20
30
40
50
60
70
80
90
100
Raw data based
features
Wavelet based
features
Classification accuracy (%)
Feature
PNN
ANN
HEALTHINF2015-InternationalConferenceonHealthInformatics
370
flowing and that of throat movement with different
frequency ranges. Differences between drinking and
taking medicine possibly appear not only in the
bolus flowing sound but also the throat movement
sound. However, because of large individual
differences, subject-dependent database is adopted
in the classification and the most efficient frequency
level is selected for each subject. Further, at the
optimal frequency level, the statistical features such
as amplitude and variance related features and the
AR-model parameters for modelling time series also
compute different characteristics. Hence, the optimal
feature selection from the statistical features and the
AR-model parameters at the six wavelet levels can
maximize the classification accuracy for each
subject.
PNN and ANN, used as two kinds of classifiers,
were applied to classify drinking and taking
medicine. The reason that PNN is not efficient in the
classification of swallowing activities is that the
number of samples is limited and not enough to train
PNN.
4 VALIDATION OF TIME-
DEPENDENT CHANGE
For the classification of drinking and taking
medicine, a subject’s specific database is adopted so
that, in practical use, constructing a subject’s
specific database and training a neural network are
necessary. For long-term use, the validation of time-
dependent change is essential.
4.1 Validation Method and
Experiments
We collected swallowing sounds made when
drinking and taking medicine for three days with
one-week intervals to validate whether time-
dependent change exists in a short term.
The method for validating this change was
designed in accordance with recognition in practical
use. Data collected on the first day was regarded as a
training set to select the optimal feature vector and
to train a neural network, and data collected on the
second and third days were used as a testing set.
4.2 Validation Results of Time-
Dependent Change
Validation results for the time-dependent changes of
three subjects are shown in Table 2, from which
time-dependent change can be ignored in a short
term.
Table 2: Validation results for time-dependent change in a
short term.
Subject 1st day 2nd day 3rd day
A 79% 74% 79%
B 77% 72% 82%
C 75% 71% 83%
D 81% 81% 75%
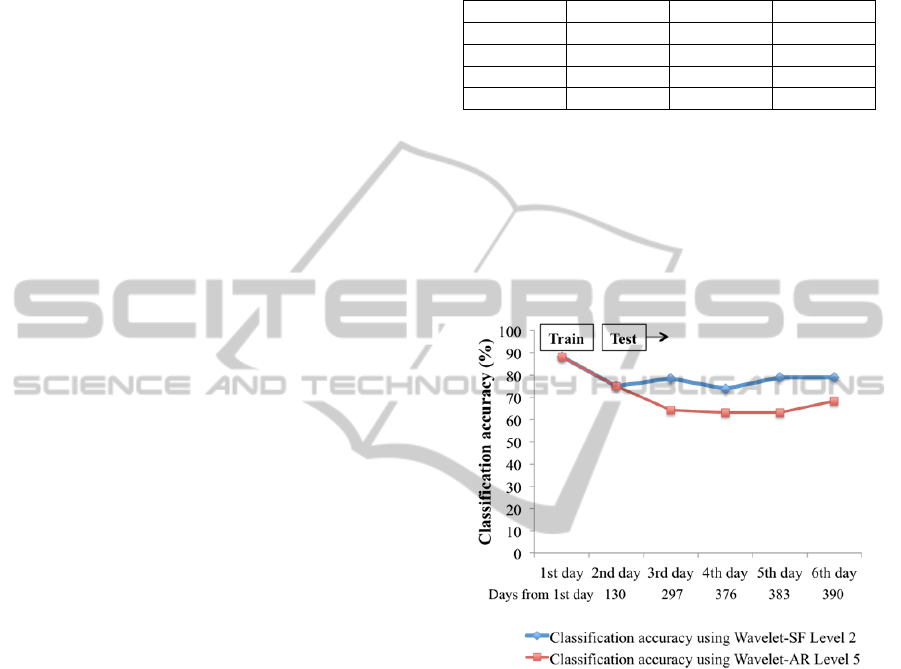
Furthermore, for Subject A, the time-dependent
change based on six days of swallowing sound data
taken over a one year interval was validated
separately by using two optimal feature vectors,
Wavelet-SF level 2 and Wavelet-AR level 5. As
Figure 8 shows, time-dependent change in a long
term can be ignored at level 2 (high frequencies) but
exists at level 5 (low frequencies).
Figure 8: Validation results for time-dependent change in
a long term for Subject A.
4.3 Discussion
The bolus flowing sound has frequency ranges
corresponding to wavelet levels 1 to 4, and the throat
movement sound has frequency ranges
corresponding to wavelet levels 5 and 6.
To determine why testing results are reduced at
the low frequency level (level 5), a sum of the
absolute value of wavelet coefficients at each level
defined as Equation 2 was calculated to describe the
frequency characteristics of the swallowing sound of
Subject A.
|
|
(2)
where represents the sum of the absolute
value, represents the wavelet coefficients or raw
DetectionofDrugAdministrationBehaviorwithSwallowingSounds
371

data, represents the wavelet level, and
represents the length of the wavelet coefficients or
raw data. After calculating at each wavelet
level, the ratio of at each level to that of raw
data is calculated as Equation 3.
(3)
The ratios of at wavelet levels 1 - 4,
which correspond to the frequency ranges of the
bolus flowing sound, and those at wavelet levels 5 -
6, which correspond to the frequency ranges of the
throat movement sound, are summed up separately
to describe the characteristics of high frequencies
and low frequencies, as shown in Table 3. The ratios
of in high frequencies to those in low
frequencies on six days are also calculated as the last
column in Table 3. As for the ratio of in high
frequencies to that in low frequencies, a large
increase appears between the second and third days.
Table 3: Ratio of in high frequencies and low
frequencies.
Day
SWLC in high
frequencies
(125 - 2000 Hz)
SWLC in low
frequencies
(32 - 125 Hz)
Ratio of high
to low
1st 17.50 1.09 16.0
2nd 18.47 1.12 16.5
3rd 16.20 0.77 21.1
4th 13.76 0.61 22.6
5th 13.93 0.70 19.9
6th 14.27 0.60 24.0
The ratio of the sum of the absolute values of
wavelet coefficients in the high frequency ranges
(levels 1 - 4) to that in the low frequency ranges
(levels 5 - 6) can be considered as the change in
swallowing sound as a possible reason for the time-
dependent change in low frequency ranges.
4.4 Novel Proposal for Compensation
for Time-dependent Change
On the basis of the acoustic characteristics of
swallowing sounds, it is possible that throat
movement sounds at low frequencies are affected
easily by changes in a person’s physical and mental
conditions such as the state of throat movement. In
comparison, the bolus flowing sound occurs by
bolus flowing through the throat with little influence
from a person’s physical and mental conditions.
Therefore, the bolus flowing sound at high
frequencies is robust to time-dependent change,
while some changes possibly occur in the throat
movement sound over a long period of time.
Use of the bolus flowing sound is proposed to
reduce time-dependent change. Therefore, the
optimal feature selection from wavelet based
features at high frequency levels (levels 1 - 4) can
be regarded as a compensation method for time-
dependent change.
5 CONCLUSIONS
In this research, an analysis method for detecting
drug administration behavior by using swallowing
sound was proposed, and a compensation method for
time-dependent change based on the frequency
characteristics of the sound was also proposed for
long-term use.
In the classification of swallowing activities, a
high classification accuracy of 85.4% was achieved
by using the optimal feature vector from six levels of
statistical features of wavelet coefficients and six
levels of AR-model parameter of wavelet
coefficients as features and an artificial neural
network as a classifier. Due to the large individual
differences, a subject-dependent database is adopted
in the classification.
Generally, time-dependent change can be
ignored in the classification of swallowing activities.
However, for a long-term use, as a compensation
method for time-dependent change, the use of
wavelet based features at high frequency levels is
proposed.
REFERENCES
Sabaté, E. (Ed.), 2003. Adherence to long-term therapies:
evidence for action. World Health Organization.
Y. Tanabe, H. Takahashi, T. Tomii, Y. Iiduka and K.
Yamasue, 2012. Design and an Experimental
Evaluation of Training Data Management Method for
Object-based ADL Recognition, DEIM Forum 2012
C6-1.
Au-Yeung, K. Y., Robertson, T., Hafezi, H., Moon, G.,
DiCarlo, L., Zdeblick, M., and Savage, G, 2010. A
networked system for self-management of drug
therapy and wellness. Wireless Health 2010. ACM,
2010, pages 1-9.
Amft, O., Tröster, G., 2009. On-body sensing solutions for
automatic dietary monitoring. IEEE pervasive
computing. 8(2), pages 62-70.
Klahn, M. S., Perlman, A. L., 1999. Temporal and
durational patterns associating respiration and
swallowing. Dysphagia, 14(3), pages 131-138.
Sazonov, E. S., Makeyev, O., Schuckers, S., Lopez-
Meyer, P., Melanson, E. L., and Neuman, M. R., 2010.
HEALTHINF2015-InternationalConferenceonHealthInformatics
372

Automatic detection of swallowing events by
acoustical means for applications of monitoring of
ingestive behavior.Biomedical Engineering, IEEE
Transactions on, 57(3), 626-633.
Ertekin, C., Pehlivan, M., Aydoǧdu, I., Ertaşl, M., Uludaǧ,
B., Çlelebi, G., ... and Yüceyar, N., 1995. An
electrophysiological investigation of deglutition in
man. Muscle & nerve, 18(10), 1177-1186.
H. Zhang, G. Lopez, M. Shuzo, J.J. Delaunay and I.
Yamada., 2011. Analysis of Eating Habits Using
sound information from a Bone-Conduction Sensor.
Proceedings of the IADIS International Conference 3-
health 2011.
Lazareck, L., Moussavi, Z., 2002. Adaptive swallowing
sound segmentation by variance dimension. In Proc
Eur Med Biol Eng Conf (EMBES).
Morinière, S., Boiron, M., Alison, D., Makris, P., Beutter,
P.,2008. Origin of the sound components during
pharyngeal swallowing in normal subjects. Dysphagia,
23(3), pages 267-273.
DetectionofDrugAdministrationBehaviorwithSwallowingSounds
373
