
Dismantling Composite Visualizations in the Scientific Literature
Po-Shen Lee
1
and Bill Howe
2
1
Department of Electrical Engineering, University of Washington, 185 Stevens Way, Seattle, U.S.A.
2
Department of Computer Science and Engineering, University of Washington, 185 Stevens Way, Seattle, U.S.A.
Keywords:
Visualization, Multi-chart Figure, Chart Segmentation, Chart Recognition and Understanding, Scientific
Literature Retrieval, Content-based Image Retrieval.
Abstract:
We are analyzing the visualizations in the scientific literature to enhance search services, detect plagiarism,
and study bibliometrics. An immediate problem is the ubiquitous use of multi-part figures: single images with
multiple embedded sub-visualizations. Such figures account for approximately 35% of the figures in the scien-
tific literature. Conventional image segmentation techniques and other existing approaches have been shown
to be ineffective for parsing visualizations. We propose an algorithm to automatically segment multi-chart vi-
sualizations into a set of single-chart visualizations, thereby enabling downstream analysis. Our approach first
splits an image into fragments based on background color and layout patterns. An SVM-based binary classi-
fier then distinguishes complete charts from auxiliary fragments such as labels, ticks, and legends, achieving
an average 98.1% accuracy. Next, we recursively merge fragments to reconstruct complete visualizations,
choosing between alternative merge trees using a novel scoring function. To evaluate our approach, we used
261 scientific multi-chart figures randomly selected from the Pubmed database. Our algorithm achieves 80%
recall and 85% precision of perfect extractions for the common case of eight or fewer sub-figures per figure.
Further, even imperfect extractions are shown to be sufficient for most chart classification and reasoning tasks
associated with bibliometrics and academic search applications.
1 INTRODUCTION
The information content of the scientific literature is
largely represented visually in the figures — charts,
diagrams, tables, photographs, etc. (Tufle, 1983).
However, this information remains largely inacces-
sible and unused for document analysis (Bergstrom
et al., 2008), (West et al., 2006) or in academic search
portals such as Google Scholar and Microsoft Aca-
demic Search. We posit that the structure and content
of the visual information in the figures closely relate
to its impact, that it can be analyzed to study how dif-
ferent fields of science organize and present data, and,
ultimately, that it can be used to improve search and
analytics tools (White, 2009), (Dean and Ghemawat,
2008). All of these applications share requirements
around the ability to extract, classify, manage, and
reason about the content of the figures in the papers
rather than just the text alone.
In an initial investigation of these hypotheses, we
extracted all figures from a corpus of PubMed papers
and developed a classifier to recognize them, build-
ing on the work of Savva et al. (Savva et al., 2011).
We quickly found that about 35% of all figures were
composite figures that contained multiple sub-figures,
and therefore could not be meaningfully classified di-
rectly. Finding it difficult to ignore 35% of the infor-
mation before we even began, we decided to tackle
the problem of “dismantling” these composite figures
automatically; our solution to the dismantling prob-
lem is described in this paper.
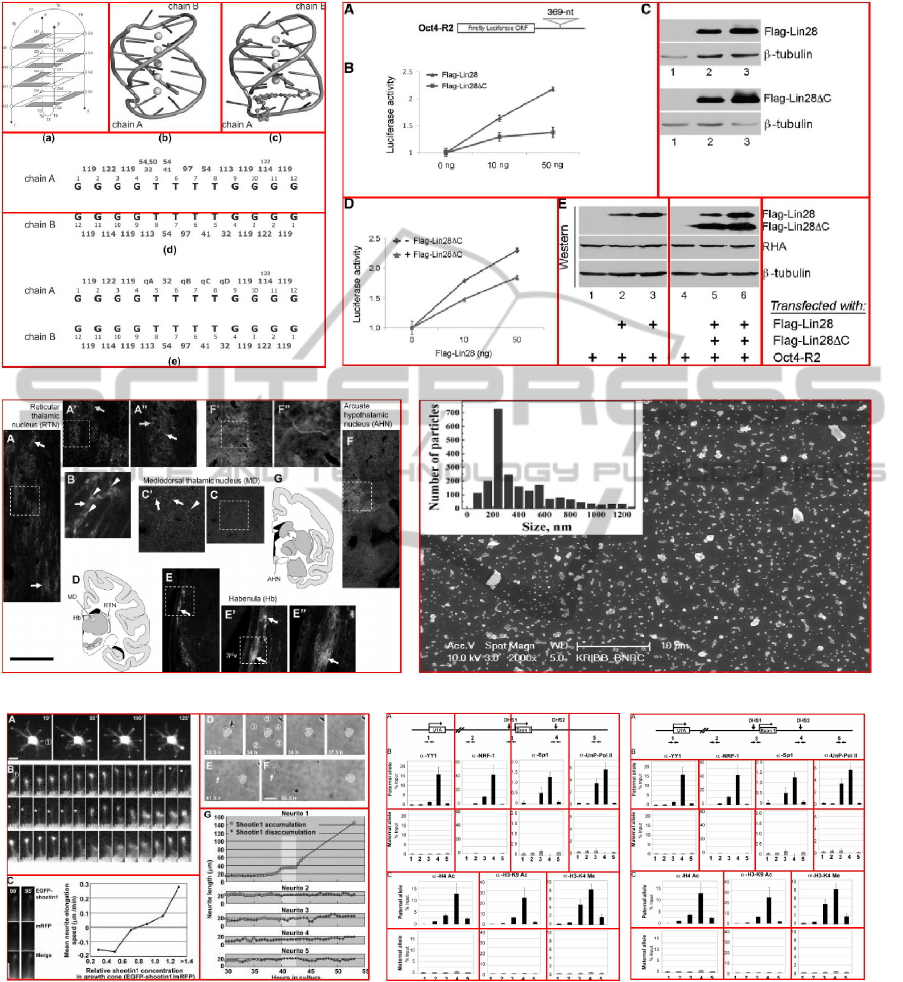
Figure 1(a) illustrates a simple example of a com-
posite figure. The figure includes a diagram of a
molecular sequence (A), a set of photographs of elec-
trophoresis gels (B), an accumulation of a specific
type of cells represented as a bar chart (C), and an
alternative visualization of molecular sequences (D).
Some sub-figures includes additional substructures:
Part A breaks the sequences into two zoom-in sec-
tions and part D includes four distinct (but related)
sub-diagrams. The task to extract the intended sub-
figures is hard: The diversity and complexity of the
hand-crafted visualizations that appear in the litera-
ture resist simple heuristic approaches. (The reader
is encouraged to browse some of the real examples in
this paper as an illustration of this diversity and com-
plexity.) Basic image segmentation techniques are in-
applicable; they cannot distinguish between meaning-
79
Lee P. and Howe B..
Dismantling Composite Visualizations in the Scientific Literature.
DOI: 10.5220/0005213100790091
In Proceedings of the International Conference on Pattern Recognition Applications and Methods (ICPRAM-2015), pages 79-91
ISBN: 978-989-758-077-2
Copyright
c
2015 SCITEPRESS (Science and Technology Publications, Lda.)

(a) (b) (c)
MergingSplitting
Figure 1: Dismantling a visualization from the scienctific literature. The original source image (a) is first segmented by a
spliting method relying on background and layout patterns (b), then the fragments are classified and recursively merged into
meaningful visualizations. Image source: (Boone et al., PLoS ONE, 5).
ful sub-figures and auxiliary fragments such as labels,
annotations, legends, ticks, titles, etc.
Aside from the applications in literature search
services, figure classification, and bibliometrics, ex-
posing these multi-part figures for analysis affords
new basic research into the role of visualization in sci-
ence. Consider the following questions:
1. What types of visualization are common in
each discipline, and how have these preferences
evolved over time?
2. How does the use of visualization in the literature
correlate with measures of impact?
3. Do certain disciplines tend to use specialized vi-
sualizations more often than others? Does the use
of specialized visualizations tend to be rewarded
in terms of impact?
4. Can we reverse engineer the data used in the paper
automatically by analyzing the text and visualiza-
tions of the paper alone?
As a first step toward answering these questions,
we present a decomposition algorithm to extract the
content of multi-part figures. This algorithm in-
volves three steps: First, we split a composite figure
into small components by reasoning about layout pat-
terns and the empty space between sub-figures (Fig-
ure 1(b)). Second, we merge the split fragments by
using an SVM-based classifier to distinguish auxiliary
elements such as ticks, labels and legends that can be
safely merged into standalone sub-figures that should
remain distinct (Figure 1(c)). Third, we assign a score
to alternative initial segmentation strategies and se-
lect the higher scoring decomposition as the final out-
put. To evaluate our method, we compiled a cor-
pus of 261 multi-chart figures chosen randomly from
the PubMed database. We manually decomposed
these multi-part figures and found that they were com-
prised of 1534 individual visualizations. Our algo-
rithm produced 1281 total sub-images, of which 1035
were perfect matches for a manually extracted sub-
figure. The remaining 246 incorrect pieces were ei-
ther multi-chart images that required further subdivi-
sion, or meaningless fragments that required further
merging. For the 85% of the images containing eight
or fewer sub-figures, we achieved 80.1% recall and
85.1% precision of correct sub-images. For the re-
maining 15% of densely packed and complex figures,
we achieved 42.1% recall and 68.3% precision for
correct sub-images. However, even in these cases, the
incorrect sub-images were typically either still rec-
ognizable (Figure 14(a)(b)(f)) or were obviously am-
biguous cases that were difficult to separate manually
(Figure 14(e)).
2 RELATED WORK
Content-based image retrieval (CBIR) organizes digi-
tal image archives by their visual content (Datta et al.,
2006), (Lew, 2006), (Smeulders et al., 2000), allow-
ing users to retrieve images sharing similar visual el-
ements with query images. This technology has been
widely deployed and is available in multiple online
applications. However, CBIR has not been used to
enhance scientific and technical document retrieval,
despite the importance of figures to the information
ICPRAM2015-InternationalConferenceonPatternRecognitionApplicationsandMethods
80

Block 1 Fire Lane Block 2
Figure 2: A figure containing two charts. Each chart can be
covered by one block. A blank stripe in the middle separates
them as a “fire lane”. Image source: (
˘
Cech et al., BMC
bioinformatics, 14:205).
content of a scientific paper. Current academic search
systems are based on annotations of titles, authors, ab-
stracts, key words and references, as well as the text
content.
Recognition of data visualizations is a different
problem than recognition of photographs or drawn
images. In early studies, Futrelle et al presented
a diagram-understanding system utilizing graphics
constraint grammars to recognize two-dimensional
graphs (Futrelle et al., 1992). Later, they proposed
a scheme to classify vector graphics in PDF docu-
ments via spatial analysis and graphemes (Futrelle
et al., 2003), (Shao and Futrelle, 2006). N. Yokokura
et al presented a layout-based approach to build a lay-
out network containing possible chart primitives for
recognition of bar charts (Yokokura and Watanabe,
1998). Y. Zhou et al used Hough-based techniques
(Zhou and Tan, 2000) and Hidden Markov Models
(Zhou and Tan, 2001) to approach bar chart detec-
tion and recognition. W. Huang et al proposed model-
based method to recognize several types of chart im-
ages (Huang et al., 2004). Later they also introduced
optical character recognition and question answering
for chart classification (Huang and Tan, 2007). In
2007, V. Prasad et al applied multiple computer vision
techniques including Histogram of Orientation Gradi-
ent, Scale Invariant Feature Transform, detection of
salient curves etc. as well as Support Vector Ma-
chine (SVM) to classified five commonly used charts
(Prasad et al., 2007). In 2011, Savva et al. proposed
an interesting application of chart recognition (Savva
et al., 2011). Their system classifies charts first, ex-
tracts data from charts second and then re-designs vi-
sualizations to improve graphical perception finally.
They achieved above 90% accuracy in chart classifi-
cation for ten commonly used charts. These works
focused on recognizing and understanding individual
chart images. None of these efforts worked with fig-
ures in the scientific literature, which are considerably
more complex than typical visualizations, and none
Fire Lane Locations
Column #
Fire Lane
0 50 100 150 200 250 300 350 400 450 500 550 600
0.0
0.5
1.0
0.0
0.5
1.0
Blank Coverage
Fire Lane
Blank Coverage
(a)
(b)
Figure 3: (a) Fire lanes. We locate the lanes by using
the histogram of columns. Orange dots represent qualified
columns that pass the thresholds. (b) Histogram of columns.
Image source: (Subramaniam et al., The Journal of cell bi-
ology, 165:357-369).
involved the use of multi-chart images.
3 DECOMPOSITION
ALGORITHM
Our algorithm is comprised of three steps: (1) split-
ting, (2) merging and (3) selecting. In first step, we
recursively segment an original images into separate
sub-images by analyzing empty space and applying
assumptions about layout. In the second step, we use
an SVM-based classifier to distinguish complete sub-
figures from auxiliary fragments (ticks, labels, leg-
ends, annotations) or empty regions. In the third step,
we compare the results produced by alternative initial
segmentation strategies by using a scoring function
and select the best choice as the final output.
3.1 Step 1: Splitting
The splitting algorithm recursively decomposes the
original figure into sub-images. Authors assemble
multiple visualizations together in a single figure to
accommodate a limited space budget or to relate mul-
tiple visualizations into a coherent argument. We
made a few observations about how these figures are
assembled that guide the design of our splitting al-
gorithm: First, the layout typically involves a hierar-
chical rectangular subdivision as opposed to an arbi-
trarily unstructured collage. Second, authors often in-
clude a narrow blank buffer between two sub-figures
as a “fire lane” to ensure that the overall layout is
readable (Figure 2). Third, paper-based figures are
typically set against a light-colored background. We
will discuss figures that violate these assumptions in
Section 4.
DismantlingCompositeVisualizationsintheScientificLiterature
81

Based on these assumptions, our splitting algo-
rithm recursively locates empty spaces and divide the
multi-chart figure into blocks. Based on our rect-
angularity assumption, we locate empty spaces by
seeking wholly blank rows or columns as opposed to
empty pixels. We first convert the color image into
grayscale, and then compute a histogram for rows
(and a second histogram for columns) by summing
the pixel values of each row (or column). Figure 3(b)
gives an example of a figure with its corresponding
histogram for the columns. Candidate fire lanes ap-
pear as peaks or plateaus in the histogram with a value
near the maximum, so we normalize the histogram
to its maximum value and apply a high-pass empty
threshold θ
e
to obtain a candidate set of “blank” rows
(or columns). The maximum value does not necessar-
ily indicate a blank row or column, because there may
be no entirely blank rows or columns. For example,
the green vertical line in Figure 4(a) is the maximum
pixel value sum, but is not blank and is not a good
choice as a fire lane. To address this issue, we ap-
ply a low-pass variance threshold θ
var1
to filter such
items by their relatively high variances (Figure 4(b)).
We use a second method to detect empty spaces by
applying another, stricter low-pass variance threshold
θ
var2
on rows or columns. The first method provides
a wider pass window and the second method is well-
suited to handle figures with a dark background.
To set the values of the three thresholds, we col-
lected 90 composite figures (avoiding figures with
photographs) and ran the splitting step with different
combinations of thresholds against this training set.
Since our goal is just to tune these parameters, we
make a simplifying assumption that finding the cor-
rect number of sub-images implies a perfect split; that
is, if the number of divided sub-images equals the
correct number of sub-figures determined manually,
we assume the division was perfect. The reason for
this simplifying assumption is to improve automation
for repeated experiments; we did not take the time
to manually extract perfect splits for each image with
which to compare. Under this analysis, the values
for the thresholds that produced the best results were
θ
e
= 0.999, θ
var1
= 100, and θ
var2
= 3.
We group neighboring empty pixel-rows or empty
pixel-columns to create empty “fire lanes” as shown
in Figure 3(a). The width of the fire lane is used in
the merge step to determine each sub-image’s near-
est neighbor. Half of each fire lane is assigned to
each of the two blocks; each block becomes a new
image input to be analyzed recursively. Row-oriented
splits and column-oriented splits are alternatively per-
formed, recursively, until no fire lane is found within
a block. The recursion occurs at least two times to
(a) (b)
Figure 4: The identification of fire lanes is non-trivial. (a)
Locating fire lanes without applying the variance threshold
θ
var1
leads to an error: Since there are no enitrely blank
columns, the maximum value (highlighted in green) is not
a qualified fire lane. (b) The disqualified column is filtered
by applying θ
var1
= 100. Image source: (Hong et al., BMC
Genetics, 13:78).
Table 1: The features used to classify sub-images as ei-
ther standalone sub-figures or auxiliary fragments. We used
k = 5 for our experiment; thus the feature vector consists of
15 elements. We achieved classification accuracy of 98.1%,
suggesting that these geometric and whitespace-oriented
features well describe the differences between the two cate-
gories.
Area Ratio =
Area
sub-image
Area
composite figure
Height Ratio =
Height
sub-image
Height
composite figure
Width Ratio =
Width
sub-image
Width
composite figure
Aspect Ratio =
Hight
sub-image
Width
sub-image
Blank Coverage =
sum of pixels in blank rows and columns
total number of pixels
for i 0..k:
Percent blank rows in horiz. section i =
num. of blank rows in i
Height
i
for j 0..k:
Percent blank columins in vert. section j =
num. of blank columns in j
Width
j
ensure both orientations are computed at least once.
Different initial splitting orientations can result
in different final divisions, so the splitting algorithm
is performed twice: once beginning vertically and
once beginning horizontally. We individually execute
merging for the two results and automatically evalu-
ate the merging results in step 3. The split with higher
score is taken as the final decomposition.
3.2 Step 2: Merging
The merging algorithm receives the splitting result
as input and then proceeds in two substeps: First,
we use an SVM-based classifier to distinguish stan-
dalone sub-figures representing meaningful visualiza-
ICPRAM2015-InternationalConferenceonPatternRecognitionApplicationsandMethods
82

tions from auxiliary blocks that are only present as
annotations for one or more standalone sub-figures.
Second, we recursively merge auxiliary blocks, as-
signing each to its nearest block, until all auxiliary
blocks are associated with one (or more) standalone
sub-figures. We refer to this process as hierarchical
merging. If two neighboring blocks have incongruent
edges, a non-convex shape may result. In this case,
we perform T-merging: we search nearby for sub-
figures that can fill the non-convexity in the shape.
We will discuss the details of the classifier, Hierarchi-
cal Merging, and T-Merging in this section.
3.2.1 Training SVM-based Binary Classifier
Figure 6 shows an example of an intermediate state
while merging, consisting of 18 sub-images from the
composite figure. Sub-images labeled (D, F, H, J, N,
O, Q, R) are classified as standalone blocks. All oth-
ers are classified as auxiliary blocks. The goal of the
merging algorithm is to remove auxiliary blocks by
assigning them to one or more standalone blocks. To
recognize auxiliary blocks, we extract a set of features
for each block and train an SVM-based classifier. The
features selected are based on the assumption that the
authors tend to follow implicit rules about balanc-
ing image dimensions and distributing empty space
within each figure, and that these rules are violated for
auxiliary annotations. To describe the dimensions of
the block, we compute proportional area, height and
width relative to that of the original image, as well as
the aspect ratio. To describe the distribution of empty
space, we use the same thresholds from the splitting
step to locate entirely blank rows or columns and then
compute the proportion of the total area covered by
the pixels of these blank elements. We do not con-
sider the overall proportion of empty pixels, because
many visualizations use an empty background — con-
sider a scatter plot, where the only non-empty pixels
are the axes, the labels, the legend, and the glyphs. As
a result, blank rows and columns should be penalized,
but blank pixels should not necessarily be penalized.
Blank coverage alone does not sufficiently penal-
ize sub-figures that have large blocks of contiguous
empty space; a pattern we see frequently in auxiliary
sub-images. For example, an auxiliary legend offset
in the upper right corner of a figure will have large
contiguous blocks of white space below and to the
left of it. To describe these cases where empty space
tends to be concentrated in particular areas, we divide
each sub-image into k equal-size sections via horizon-
tal cuts and another k sections via vertical cuts. We
then extract one feature for each horizontal and verti-
cal section; 2k features total. Each feature f
i
is com-
puted as the proportion of blank rows in section i. To
0.5217
0.0435
0.0943 0 0.5094 0.1321 0.1132
Blank Horizontal Section Percentage
Blank Vertical Section Percentage
0
0
0
Figure 5: Blank coverage according to blank rows (red)
and blank columns (green). We divided the image into 5
sections horizontally and vertically. In each section, we
{computed the percentage of blank-row or blank-column
respectively. The 10 vectors form a portion of image fea-
ture. Image source: (Kapina et al., PLoS ONE, 6).
determine a suitable k, we experimented with differ-
ent values from k = 0 to k = 10 on the training data
and set k = 5 based on the results. In this paper, we do
not consider further optimizing this parameter. With
the combination of the dimensional features and the
empty-space features, we obtain a 15-element feature
vector for each sub-image. These features are sum-
marized in Table 1.
As an example of how these features manifest in
practice, consider Figure 5. This image has 26.6%
blank coverage; blank columns are colored green and
blank rows are colored red. As with most visualiza-
tions in the literature, the overall percentage of blank
pixels is very high, but the percentage of blank rows
and columns is relatively low. We divide the image
into horizontal and vertical sections as indicated by
the green and red dashed lines. The decimals indicate
percentages of blank row or column of their nearby
sections.The complete 15-element feature vector of
this image is {1, 1, 1, 0.4272, 0.2656, 0.5217, 0, 0,
0, 0.0435, 0.0943, 0, 0.5094, 0.1321, 0.1132}.
To evaluate our classifier, we collected another
corpus containing 213 composite figures from the
same source for training independence. The splitting
algorithm was used to produce 7541 sub-images from
the corpus. For evaluation, we manually classified a
set of 6524 standalone sub-images and 1017 auxiliary
sub-images. We used LibSVM (Hsu et al., 2010) and
set all parameters as default to train the model. Ta-
ble 2 shows the performance of the image features for
merging determination by training an SVM-based bi-
nary classifier through 10-fold cross-validation on the
Table 2: Classification accuracy calculated by 10-fold
cross-validation.
Class Correct Incorrect Accuracy (%)
Auxiliary 6482 42 99.4
Standalone 917 100 90.2
Total 7399 142 98.1
DismantlingCompositeVisualizationsintheScientificLiterature
83
A(1,1)
C(2,1)
D(2,2)
F(2,4)
E(2,3)
B(1,2)
G(3,1)
H(3,2)
K(4,1)
M(5,1)
N(5,2)
Q(6,2)
P(6,1)
1
B(1,2)
A(1,1)
4
L(4,2)
K(4,1)
2
D(2,2)
C(2,1)
F(2,4)
E(2,3)
3
H(3,2)
G(3,1)
J(3,4)
I(3,3)
5
N(5,2)
M(5,1)
O(5,3)
6
Q(6,2)
P(6,1)
R(6,3)
I(3,3)
L(4,2)
J(3,4)
O(5,3)
R(6,3)
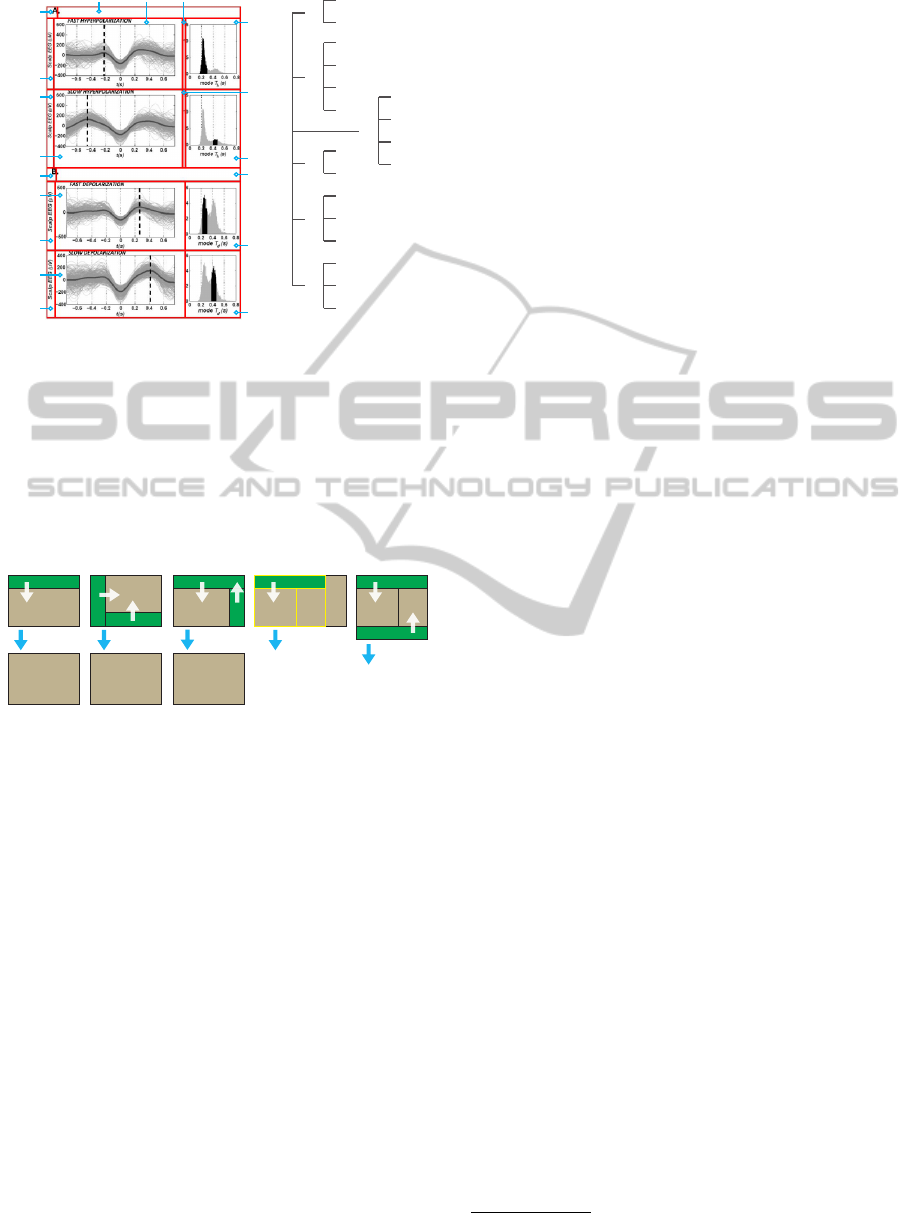
Figure 6: The tree structure of a decomposition. This multi-
chart image was split using column-orientation. The result
of the splitting step can form a tree structure. The numbers
in parentheses present the sections in each splitting level
that the block belongs to. For instance, H(3, 2) refers that
block H is in the third section when the original multi-chart
figure is split. Then it is the second sub-section when the
third section is split again. With the assistance of the classi-
fier, we color standalone blocks by blue and auxiliary blocks
by red. Image source: (Botella-Soler et al., PLoS ONE, 7).
Acceptable
S
A
Acceptable
S
AA
Acceptable
S A
A
Forbidden
To The Next Level
S S S
A
To T-Merging
Forbidden
S
S
A
A
(a) (b) (c) (d) (e)
Figure 7: Examples of Hierarchical Merging. In all cases,
the goal is to merge all auxiliary blocks, (labeled A) into
standalone blocks (labeled S). Each merge operation is in-
dicated by a white arrow. (a) An acceptable merge. The
new block is the smallest rectangle that covers both merging
blocks. (b) Two different merge paths that lead to the same
result. (c) Another case of acceptable multi-merging. (d)
This merging is forbidden because after merging the aux-
iliary into the standalone block the resulting shape is non-
rectangular. The operation only involves the blocks with
yellow outline. Once the local merging in this level is com-
pleted, it repeats again in the next level, which will involve
the very right standalone block. (e) Another case of forbid-
den merging because of the same reason. After completing
Hierarchical Merging, the residual auxiliary blocks will be
handled by T-Merging.
sub-image set. The classification accuracy is 98.1%.
3.2.2 Hierarchical Merging
The result of the splitting step forms a tree structure
as shown in Figure 6. Merging starts from the leaves
of the tree. All leaves can only merge with other
leaves in the same level. After completing all possible
merges among siblings, we transfer the newly merged
block to their parents’ level as new leaves. Hierarchi-
cal merging stops after it finishes merging in the top
level.
In each level, we re-run the classifier to determine
auxiliary blocks. We then induce a function on the
set of blocks, assigning each block to its nearest ad-
jacent neighbor called its merge target. A block and
its merge target are called a merge pair. Under the
assumption that the width of a fire lane indicates the
strength of relationship between the two blocks, the
merge target for a block is the adjacent neighbor with
the narrowest lane between them. Figure 7(a) shows
a combination of two blocks. The new block is the
smallest rectangle that covers both merging blocks.
Only adjacent blocks are allowed to merge together.
If there are two or more qualified blocks, we break
the tie by the shortest distance between centroids of
blocks.
If after merging all auxiliary blocks at one level
of the tree we find that the resulting shape is non-
rectangular, we attempt to apply T-merging or pass
the result on to the next higher level. For example,
Figures 7(b) and 7(c) can be merged since the result
is rectangular. Figures 7(d) and 7(e) are forbidden. In
this case, the merging of the block pair is skipped and
the auxiliary block is labeled as standalone and pro-
cessed using T-Merging, described next. We repeat
the local merging until the statuses of all blocks are
standalone. We then pass these blocks up to the next
level, reclassify them, and repeat the local merging
again.
3.2.3 T-Merging
T-Merging handles residual auxiliary blocks ignored
in Hierarchical Merging. These are usually shared ti-
tles, shared axes or text annotations that apply to mul-
tiple sub-figures; e.g., Figure 7(d) and Figure 7(e). As
shown in Figure 8, merging the auxiliary block 1 (“the
legacy”), to any adjacent standalone block generates a
non-rectangular shape. We define block 2 and block 3
as legatees
1
to proportionally share block 1. We find
the set of legatees by the following procedure: For
each edge e of the legacy, find all blocks that share
any part of e and construct a set. If merging this set
as a unit produces a rectangle, then it is a qualified
set. If multiple edges produce qualified sets, choose
the edge with t the narrowest fire lane. In Figure 8,
only the set consisting of block 2 and 3 satisfies the
above criteria; blocks 4, 5, 6 are not proper legatees.
Figure 9 illustrates the evolution from a source image
through Hierarchical Merging to its T-merged output.
1
meaning “those who will receive the legacy”
ICPRAM2015-InternationalConferenceonPatternRecognitionApplicationsandMethods
84

(a)
Splitting
Hierarchical Merging
(LV 2 to LV 1)
T-Merging
Hierarchical Merging
(LV 4 to LV 3)
(b) (c) (d) (e)
Figure 9: (a) Composite figure. (b) Splitting result. (c) Intermediate state of Hierarchical Merging after completing level 3.
(d) Hierarchical Merging result. The very-top block and the middle block require T-Merging. (e) T-Merging result. Image
source: (Botella-Soler et al., PLoS ONE, 7).
block 1
block 2
block 5 block 6
block 3
block 4
block 2
block 5
T-Merging
block 6
block 3 block 4
S
S
SSS
A
S
S
SSS
Figure 8: Examples of T-Merging. The legacy (block 1) is
marked by white color in text. According to our algorithm,
only block 2 and block 3 are qualified to share block 1.
3.3 Step 3: Selecting
The splitting and merging steps may produce differ-
ent results from different initial splitting orientations
(Figure 9). Step 3 scores the two different results
and selects the one with higher score as the final out-
put. Under the assumption that authors tend to follow
implicit rules about balancing image dimensions, the
decomposition that produces more sub-images with
similar dimensions is given a higher score. To cap-
ture this intuition, we define the scoring function as
S
decomposition
= 4
∑
i∈blocks
p
A
i
− 2α
∑
i, j∈Pairs
|l
t
op
i
− l
t
op
j
|+|l
l
e f t
i
− l
l
e f t
j
|,
where A
i
is the area of the corresponding block,
α is a penalty coefficient and l
t
op
i
is the length of
the top edge of block i (respectively, le f t). Each el-
ement of the set Pairs is a pair of blocks i, j, where
j is the block that has the most similar dimensions
to i for i 6= j. The two coefficients normalize the two
terms to the full perimeter. The formula enforces a ge-
ometric property of composite figures: The first term
obtains its maximum value when all blocks are equal
(b)
(a)
Figure 10: Results of different initial splitting orientations.
(a) Split begins from horizontal (initially row-oriented), and
a lower score due to mismatched elements. (b) Split begins
from vertical (initially column-oriented), and a higher score.
Image source: (T
¨
urumen et al. PLoS Genetics, 5).
in size. The second term subtracts the difference be-
tween each block and its most similar neighbor to re-
ward repeating patterns and penalize diversity in the
set. The penalty coefficient weights the importance
of dimensional difference. We assigned α = 1 in our
experiment.
DismantlingCompositeVisualizationsintheScientificLiterature
85

4 EXPERIMENTAL EVALUATION
In this section, we describe experiments designed to
answer the following questions: a) Can our algorithm
be used to estimate visualization diversity, a weaker
quality metric sufficient for many of our target appli-
cations? (Yes; Table 3) b) Can our algorithm effec-
tively extract correct sub-figures, a stronger quality
metric? (Yes; Table 3) c) Could a simpler method
work just as well as our algorithm? (No; Table 3) d)
Is step 3 of the algorithm (selection) necessary and ef-
fective? (Yes; Figure 11) e) Where does the algorithm
make mistakes? (Figure 14)
The corpus we used for our experiments was col-
lected from the PubMed database. We selected a ran-
dom subset of the PubMed database by collecting all
tar.gz files from 188 folders (from //pub/pmc/ee/00 to
//pub/pmc/ee/bb); these files contain the pdf files of
the papers as well as the source images of the figures,
so figure extraction was straightforward. In order to
filter non-figure images such as logos, banners, etc.,
we only used images of size greater than 8KB. We
manually identified the composite figures (we have a
classifier that can recognize multi-chart figures, but
for this experiment we wanted to avoid the additional
dependency) and divided them into a testing set and a
training set. We trained the classifier and performed
cross-evaluation with the training set, reserving the
test set for a final experimental evaluation. The test-
ing set S for the experiments contains 261 compos-
ite figures related to biology, biomedicine, or bio-
chemistry. Each figure contains at least two different
types of visualizations; e.g., a line plot and a scatter
plot, a photograph and a bar chart, etc. We ignored
multi-chart figures comprised of single-type figures
in this experiment for the convenience of evaluation,
described later in the first question. We evaluated per-
formance in two ways: (1) type-based evaluation, a
simpler metric in which we attempt to count the num-
ber of distinct types of visualizations within a single
figure, and (2) chart-based evaluation, a stronger met-
ric in which we attempt to perfectly recover all sub-
figures within a composite figure.
Can Our Algorithm Be Used to Estimate Visual-
ization Diversity? The motivation for type-based
evaluation is that some of our target applications in
bibliometrics and search services need only know the
presence or absence of particular types of visualiza-
tions in each figure to afford improved search or to
collect aggregate statistics — it is not always required
to precisely extract a perfect sub-figure, as long as we
can tell what type of figure it is. For example, the
presence or absence of an electrophoresis gel image
appears to be a strong predictor of whether the paper
is in the area of experiemental molecular biology; we
need not differentiate between a sub-figure with one
gel and a sub-figure with several gels. Moreover, it is
not always obvious what the correct answer should be
when decomposing collections of sub-figures of ho-
mogeneous type: Part of Figure 14(e) contains a num-
ber of repeated small multiples of the same type — it
is not clear that the correct answer is to subdivide all
of these individually. Intuitively, we are assessing the
algorithms’ ability to eliminate ambiguity about what
types of visualizations are being employed by a given
figure, since this task is a primitive in many of our
target applications.
To perform type-based evaluations we label a test
set by manually counting the number of distinct visu-
alization types in each composite figure. For exam-
ple, Figure 3 has two types of visualizations, a line
chart and a bar chart; Figure 6 also has two types of
visualizations, a line chart and an area chart; Figure
10(a) also has two types of visualizations, bar charts
and electrophoresis gels. We then run the decompo-
sition algorithm and manually distinguish correct ex-
tractions from incorrect extractions. Only homoge-
neous sub-images — those containing only one type
of visualization — are considered correct. For exam-
ple, the top block in Figure 10(a) is considered cor-
rect, because both sub-figures are the same type of vi-
sualization: an electrophoresis gel image. The bottom
two blocks of Figure 10(a) are considered incorrect,
since each contains both a bar chart and a gel.
Using only the homogeneous sub-images (the het-
erogeneous sub-images are considered incorrect), we
manually count the number of distinct visualization
types found for each figure. We compare this number
with the number of distinct visualization types found
by manual inspection of the original figure. For exam-
ple, in Figure 10(a), the algorithm produced one ho-
mogeneous sub-image (the top portion), so only one
visualization type was discovered. However, the orig-
inal image has two distinct visualization types. So our
result for this figure would be 50%.
To determine the overall accuracy we de-
fine a function diversity : Figure → Int as
diversity( f ) = |{type(s) | s ∈ decompose( f )}|,
where decompose returns the set of subfigures and
type classifies each subfigure as a scatterplot, line
plot, etc. The final return value is the number of
distinct types that appear in the figure. We then
sum the diversity scores for all figures in the cor-
pus. We compute this value twice: once using our
automatic version of the decompose function and
once using a manual process. Finally, we divide the
total diversity computed autoamtically by the total
ICPRAM2015-InternationalConferenceonPatternRecognitionApplicationsandMethods
86

diversity computed manually to determine the overall
quality metric. The automatic method is not generally
capable of finding more types than are present in the
figure, so this metric is bounded above by 1. In our
experiment, we obtained the diversity score of 591
and 640 respectively from automatic decomposition
and manual process. The accuracy by this metric is
therefore 92.3%.
Can Our Algorithm Effectively Extract Correct
Sub-figures? For chart-based evaluation, we at-
tempt to perfectly extract the exact subfigures found
by manual inspection, and measure precision and re-
call. For instance, Figure 3, Figure 6, and Figure
10(b) contain 5, 8, and 6 sub-figures respectively. To
obtain ground truth, we manually extracted 1534 vi-
sualizations from the entire image set S; about 5.88
visualizations per composite figure on average. In this
experiment, a sub-image that includes exactly one vi-
sualization is defined as correctly extracted; excep-
tions are described next. However, a sub-image that
crops a portion of a visualization (e.g., Figure 14(a),
bottom), or includes only auxiliary annotations (e.g.,
Figure 14(b), bottom right), or includes two or more
visualizations (e.g., Figure 14(b), top left) is consid-
ered incorrect. These criteria are more strict than
necessary for many applications of the algorithm; for
example, partial visualizations or visualizations with
sub-structure will often still be properly recognized
by a visualization-type classifier and can therefore be
used for analysis. However, this metric provides a
reasonable lower bound on quality.
We make an exception to these criteria: We con-
sider an array of photographic images to be one vi-
sualization. This exception is to ensure that we do
not artificially improve our results: The algorithm is
very effective at decomposing arrays of photos, but it
is not obvious that these arrays should always be de-
composed; the set is often treated as a unit. In this
analysis, we also ignore cases where an auxiliary an-
notation is incorrectly assigned to one owner instead
of another. The reason is that we find a number of
ambiguous cases where “ownership” of an auxiliary
annotation is not well-defined.
We define a notion of recall and precision based
on these correctness criteria. To compute recall, the
number of correct sub-images returned by the algo-
rithm is divided by the number of correct sub-figures
manually counted in the corpus using the same crite-
ria for correctness. To compute precision, we divide
the number of correct sub-images returned by the al-
gorithm by the total number of extracted sub-images.
Our algorithm achieves recall of 67.5% and precision
of 80.8%. In addition, the percentage of figures that
0.0 0.5 1.0 1.5 2.0 2.5 3.0 3.5 4.0
Final Score by Appying Initial Row-oriented Split
Final Score by Appying Initial Column-oriented Split
Select initial row-oriented split
Select initial column-oriented split
Imperfect Decomposition
Wrong Selection
Correct Selection
Same Result from Two
Initial Splitting Orientations
Perfect Decomposition
0.0
0.5
1.0
1.5
2.0
2.5
3.0
3.5
4.0
Figure 11: Step 3 of the algorithm, selection, makes correct
decisions. Circles represent perfectly decomposed figures
and crosses represent imperfectly decomposed figures. This
scatter plot illustrates that figures with perfect decomposi-
tion mostly distribute near the line of slope 1, indicating
similar solutions were found by our decomposition algo-
rithm regardless of the starting orientation. The selection
step deals with the the grey plots and the red plot, which are
composite figures that have different outputs from the two
initial splitting orientations. Only one mistaken selection
was made and 95.9% accuracy was achieved.
are perfectly decomposed — the right number of cor-
rect images and no incorrect images — is 57.9%. Ta-
ble 3 summarizes the chart-based evaluation in more
detail. Later in this section we will analyze the mis-
takes made by the algorithm.
Does a Simpler Method Work Just as Well? For
comparison, we measured the performance of our al-
gorithm relative to a simpler split-based algorithm.
Here, we modified our splitting step (Section 3.1) to
make it more viable as a complete algorithm. As pre-
sented, our splitting step may produce a large number
of auxiliary fragments that need to be merged (e.g.,
Figure 9(b)). But a reasonable approach would be to
cap the number of recursive steps and see if we could
avoid the need to merge altogether. We use two recur-
sive steps — once for vertical and once for horizontal.
Also, as a heuristic to try and improve the results, we
discarded fire lanes with width less than 4 pixels for
the same purpose because most lanes between aux-
iliary fragments or between auxiliary fragments and
effective sub-figures are relatively narrow.
Our results show that this splitting-only algorithm
extracted 833 correct sub-images and achieved 54.3%
recall and 53.1% precision. Only 16.1% of the orig-
inal composite figures were decomposed perfectly
into exact sub-figures without any errors. By both
DismantlingCompositeVisualizationsintheScientificLiterature
87

25
18
37
10
30
14
12
12
21
8
8
9
8
9 9
3
3
4 4 4 4
2 2
25%
82%
39%
76%
71%
50%50%
68%
0%0%0%0%0%0%0%0%0%0%
60%
0%
20%
40%
60%
80%
125
146
140
100
134
25
35
85
55
25
59
28
28
26
16
23
37
26
23
40
30
30
20
20
14
34
22
32
22
21
81
9
(a) (b)
Number of Sub-figures
Accuracy
Composite Figures
Number of Sub-figures
Overall Sub-Figures
2 3 4 5 6 7 8 9 10 11 12 13 14 15 16 17 20 21 34
0
10
20
30
40
2
3 4 5 6 7 8 9 10 11 12 13 14 15 16 17 20 21 34
0
50
100
150
Accuracy of Perfect Decomposition
Imperfect Decomposed Figures
Perfect Decomposed Figures
Unextracted Sub-figures
Extracted Sub-figures
Figure 12: (a) Histogram of perfectly decomposed and imperfectly decomposed figures. (b) Histogram of extracted sub-
figures. Our decomposition algorithm performed better for composite figures with lower number of sub-figures. Entanglement
and over-merging are common issues for images of densely packed sub-figures.
measures, this simpler method performs significantly
worse despite optimizations (Table 3).
Is Step 3 of the Algorithm (Selection) Useful and
Effective? To evaluate the utility of our selection
step, we manually compared the two outputs of dif-
ferent splitting orientations before our algorithm au-
tomatically chose one. There are 237 figures that
have the same results from the two initial splitting
orientations. For the remaining 24 figures that re-
quire selecting algorithm, our selection algorithm cor-
rectly chose the better output for 23 figures, 11 from
initial column-oriented split and 13 from initial row-
oriented split. Figure 11 shows an overview of all se-
lection scores as computed by the formula in Section
3.3. Each point denotes a composite figure. Circles
are figures decomposed perfectly and crosses are fig-
ures decomposed imperfectly. Figures with perfect
decomposition mostly appear near the line of slope
1, indicating that our decomposition algorithm often
finds similar solutions for regardless of the starting
orientation. However, for points where one score is
different than the other, we conclude that the selec-
tion step plays an important role.
Where Does the Algorithm Make Mistakes? To
understand the algorithm’s performance more deeply,
we considered whether the complexity of the initial
figure had any effect on the measured performance.
Figure 12(a) shows a histogram of composite figures,
where each category is a different number of sub-
figures. The dark portion of each bar indicates the
proportion of composite figures that were perfectly
decomposed. The curve, which shows the accuracy
of perfect decomposition, decays significantly as the
number of sub-figures increases; the algorithm tends
to perform significantly better on figures with eight or
fewer sub-figures.
Figure 12(b) is a histogram of the total number
of sub-figures extracted from each category, regard-
less of whether or not the entire figure was perfectly
decomposed. The black dotted line divides the cat-
egories into two subsets. The right subset, compris-
ing composite figures containing nine or more sub-
figures, includes only 15.0% source figures but con-
tributes 61.7% of the unextracted sub-figures (i.e., the
figures the algorithm failed to properly extract). Thus,
a relative low recall of 42.1% was obtained in this
subset (Table 3). In the left subset, comprising 222
composite figures with eight or fewer sub-figures, the
recall was greatly increased to 80.1% (Table 3). The
two bar charts both show a better performance on
composite figures with lower sub-figure populations.
Table 4 summarizes causes of decomposed er-
rors. Merging errors include over-merging (47), or-
phan fragment (27), and mistaken merging target
(11). Over-merging means that the algorithm mistak-
enly merges two or more sub-figures together, and or-
phan fragment implies a missed opportunity to merge
a block containing only auxiliary annotations to it’s
nearby sub-figure. The two causes are both due to the
misclassification by our classifier. Mistaken merging
target mostly occurs with tables, diagrams and photo
arrays with inner separation wider than nearby fire
lanes. Splitting errors are categorized into entangle-
ment (28), noisy fire lane (10), and insider (1). An
entangled figure violates our basic assumption of a
grid-based layout. Figure 14(c) shows an example of
entanglement. Noise made by image compression in
empty space causes the same issue. Embedded charts
are also not extractable by our algorithm. Figure 14
shows a collection of imperfectly decomposed exam-
ples.
5 LIMITATIONS AND FUTURE
WORK
The current decomposition algorithm is suitable for
grid-aligned multi-chart visualizations, where there
ICPRAM2015-InternationalConferenceonPatternRecognitionApplicationsandMethods
88

Table 3: Chart-based evaluation. Where S
all
denotes the en-
tire composite figure set, S
p≤8
denotes the subset of com-
posite figures containing eight or fewer sub-figures, and
S
p>8
denotes the subset of composite figures containing
nine or more sub-figures. We compared our main approach
to a splitting-only method based on our splitting algorithm.
The recall and the precision of correct sub-images, as well
as the accuracy of decomposition were significantly en-
hanced. Our technique achieved a better performance for
a subset of composite figures that contains eight or fewer
sub-figures.
Recall of Precision of Accuracy of
Correct Correct Perfect
Sub-images Sub-images Decomposition
Splitting-only
S
all
54.3% 53.1% 16.1%
Approach (833/1534) (833/1569) (42/261)
Main Approach
S
all
67.5% 80.8% 57.9%
(1035/1534) (1035/1281) (151/261)
S
p≤8
80.1% 85.1% 67.1%
(811/1002) (811/953) (149/222)
S
p>8
42.1% 68.3% 5.1%
(224/532) (224/328) (2/39)
Table 4: Causes of decomposition errors. We categorized
errors into three types and seven causes. An imperfect de-
composition can regard two or more causes.
Causes of Units
Merging errors
Over-merging 46
orphan fragment 27
Mistaken merging target 11
Splitting errors
Entanglement 28
Noisy fire lane 10
Insider 1
Selecting errors Mistaken selecting 1
exists at least one edge-to-edge fire lane that can boot-
strap the process. Figure 13 shows two examples that
do not satisfy this criterion, and for which our algo-
rithm does not produce a result. Our algorithm is also
ill-suited for arrays of similar sub-figures for which
it is ambiguous and subjective whether or not they
should be considered as one coherent unit. We chose
to maximally penalize our algorithm by assuming that
every individual element should be considered a sep-
arate sub-figure.
We are also working to make the classifier used
in the merging phase more robust. Although our cur-
rent binary classifier has achieved 90% recall to rec-
ognize standalone sub-figures, we still receive an ex-
ponential decay to perfectly divide figures. For our
corpus, 5.88 charts per image on average gave only
1 − 0.9
5.88
= 46.2% accuracy of perfect decomposi-
tion in expectation. The misclassification is mostly
on relatively small sub-figures. To improve the bi-
nary classifier, we need to consider more features de-
rived from the color information, and from text loca-
tion (via the use of character recognition algorithms).
For the future work, we are working to use the
decomposition algorithm with visualization classifi-
cation techniques to analyze the use of visualization
(a)
(b)
Figure 13: Cases for which the splitting algorithm is not
appropriate. (a) Irregular outer bound of sub-figures may
form a zigzag fire lane. (b) There is no end-to-end fire lane.
in the literature by domain, by impact, by year, and by
demography. We believe this effort represents a first
step toward a new field of visiometrics — the analy-
sis of how visualization techniques are used to convey
information in practice.
6 CONCLUSIONS
We have presented an algorithm that automatically
dismantles composite figures into sub-figures. The al-
gorithm first decomposes an image into several blocks
via spatial analysis. An SVM-based image classi-
fier with an accuracy of 98.1% is used to recognize
effective visualization and auxiliary fragments. For
type-based analysis, a weaker metric suitable for un-
derstanding the diversity of visualization used in the
literature, 78.1% of the composite figures in our cor-
pus were completely divided into homogeneous, rec-
ognizable visualizations. For chart-based analysis, a
stronger metric suitable for extracting the original vi-
sualizations exacty, we successfully extracted 67.5%
of the sub-images from 261 composite figures. For
the 85% of images in the corpus containing eight or
fewer sub-figures, a better performance of 80.1% re-
call was achieved. With this technique, we are now
poised to unlock the content of multi-part composite
figures in the literature and make it available for use in
advanced applications such as bibliometrics and aca-
demic search.
ACKNOWLEDGEMENTS
The authors wish to thank the authors of the papers
from which we drew the examples in this paper. This
work is sponsored in part by the National Science
Foundation through S2I2 award 1216879 and and
IIS award III-1064505, the University of Washington
eScience Institute, and an award from the Gordon and
Betty Moore Foundation and the Alred P. Sloan Foun-
dation.
DismantlingCompositeVisualizationsintheScientificLiterature
89
(c) (d)
(e) (f)
(a) (b)
Figure 14: Decomposition errors. (a) Mistaken merging target. The chain B in chart (d*) mistakenly merged to the chart (e*)
due to an inner wider stripe. (b) Over-merging and orphan fragment. Diagram A was misclassified to be auxiliary and caused a
merging error. Furthermore, the label of electrophoresis gels are separated. (c) Entanglement. (d) Insider. (e) Noisy between
the photo arrays is generated during image compression. (f) Our algorithm mistakenly chose the result derived by initial
column-oriented split (left) in selecting step. (* denotes original marks of assignment in the source image.) Image source:
(Toriyama et al., The Journal of cell biology, 175:147-157.), (Taneja et al., PLoS ONE, 5.), (Rodriguez-Jato et al., Nucleic
acids research, 33:4740-4753.), (Neddens and Buonanno, PLoS ONE, 6.), (Jin et al., Nucleic acids research, 39:3724-3734.),
(Gongalsky et al., Nanoscale Research Letters, 7:446).
ICPRAM2015-InternationalConferenceonPatternRecognitionApplicationsandMethods
90

REFERENCES
Bergstrom, C. T., West, J. D., and Wiseman, M. A. (2008).
The Eigenfactor metrics. The Journal of neuroscience
: the official journal of the Society for Neuroscience,
28:11433–11434.
Datta, R., Joshi, D., Li, J., and Wang, J. Z. (2006). Image
Retrieval : Ideas , Influences, and Trends of the New
Age. ACM Computing Surveys, pages 1–35.
Dean, J. and Ghemawat, S. (2008). Mapreduce: Simpli-
fied data processing on large clusters. Commun. ACM,
51(1):107–113.
Futrelle, R., Kakadiaris, I., Alexander, J., Carriero, C.,
Nikolakis, N., and Futrelle, J. (1992). Understanding
diagrams in technical documents. Computer, 25.
Futrelle, R., Shao, M., Cieslik, C., and Grimes, A. (2003).
Extraction,layout analysis and classification of dia-
grams in pdf documents. In Document Analysis
and Recognition, 2003. Proceedings. Seventh Interna-
tional Conference on, pages 1007–1013.
Hsu, C.-w., Chang, C.-c., and Lin, C.-j. (2010). A Practical
Guide to Support Vector Classification. Bioinformat-
ics, 1:1–16.
Huang, W., Tan, C., and Leow, W. (2004). Model-based
chart image recognition. In Llads, J. and Kwon, Y.-B.,
editors, Graphics Recognition. Recent Advances and
Perspectives, volume 3088 of Lecture Notes in Com-
puter Science, pages 87–99. Springer Berlin Heidel-
berg.
Huang, W. and Tan, C. L. (2007). A System for Under-
standing Imaged Infographics and Its Applications. In
DOCENG’07: Proceedings of the 2007 ACM Sympo-
sium on Document Engineering, pages 9–18.
Lew, M. S. (2006). Content-Based Multimedia Informa-
tion Retrieval : State of the Art and Challenges. ACM
Transactions on Multimedia Computing, Communica-
tions and Applications, 2:1–19.
Prasad, V., Siddiquie, B., Golbeck, J., and Davis, L. (2007).
Classifying Computer Generated Charts. 2007 Inter-
national Workshop on Content-Based Multimedia In-
dexing.
Savva, M., Kong, N., Chhajta, A., Fei-Fei, L., Agrawala,
M., and Heer, J. (2011). ReVision: Automated Clas-
sification, Analysis and Redesign of Chart Images. In
UIST ’11, pages 393–402.
Shao, M. and Futrelle, R. (2006). Recognition and clas-
sification of figures in pdf documents. In Liu, W. and
Llads, J., editors, Graphics Recognition. Ten Years Re-
view and Future Perspectives, volume 3926 of Lecture
Notes in Computer Science, pages 231–242. Springer
Berlin Heidelberg.
Smeulders, A. W. M., Worring, M., Santini, S., Gupta, A.,
and Jain, R. (2000). Content-based image retrieval at
the end of the early years. Pattern Analysis and Ma-
chine Intelligence, IEEE Transactions on, 22:1349–
1380.
Tufle, E. (1983). The visual display of quantitative infor-
mation. CT Graphics, Cheshire.
West, J. D., Bergstrom, T. C., and Bergstrom, C. T. (2006).
The Eigenfactor Metrics: A Network Approach to As-
sessing Scholarly Journals. College & Research Li-
braries, 71:236–244.
White, T. (2009). Hadoop: The Definitive Guide: The
Definitive Guide. O’Reilly Media.
Yokokura, N. and Watanabe, T. (1998). Layout-based ap-
proach for extracting constructive elements of bar-
charts. In Tombre, K. and Chhabra, A., editors,
Graphics Recognition Algorithms and Systems, vol-
ume 1389 of Lecture Notes in Computer Science,
pages 163–174. Springer Berlin Heidelberg.
Zhou, Y. and Tan, C. L. (2001). Learning-based scientific
chart recognition. In 4th IAPR International Work-
shop on Graphics Recognition, GREC2001, pages
482–492.
Zhou, Y. P. Z. Y. P. and Tan, C. L. T. C. L. (2000).
Hough technique for bar charts detection and recog-
nition in document images. Proceedings 2000 In-
ternational Conference on Image Processing (Cat.
No.00CH37101), 2.
DismantlingCompositeVisualizationsintheScientificLiterature
91
