
Human Activity Recognition Based on Novel Accelerometry Features and
Hidden Markov Models Application
Ana Lu
´
ısa Gomes
1
, V
´
ıtor Paix
˜
ao
3
and Hugo Gamboa
1,2
1
Universidade Nova de Lisboa Faculdade de Ci
ˆ
encias e Tecnologias, FCT-UNL, Lisbon, Portugal
2
PLUX - Wireless Biosignals, Lisbon, Portugal
3
Champalimaud Neuroscience Programme, Champalimaud Centre for the Unknown, Lisbon, Portugal
Keywords:
Human Activity Recognition, Forward Feature Selection, Hidden Markov Models, Clustering.
Abstract:
The Human Activity Recognition (HAR) systems require objective and reliable methods that can be used in
the daily routine and must offer consistent results according to the performed activities.
In this work, a framework for human activity recognition in accelerometry (ACC) based on our previous work
and with new features and techniques was developed. The new features set covered wavelets, the CUIDADO
features implementation and the Log Scale Power Bandwidth creation. The Hidden Markov Models were also
applied to the clustering output. The Forward Feature Selection chose the most suitable set from a 423
th
di-
mensional feature vector in order to improve the clustering performances and limit the computational demands.
K-means, Affinity Propagation, DBSCAN and Ward were applied to ACC databases and showed promising
results in activity recognition: from 73.20% ± 7.98% to 89.05% ± 7.43% and from 70.75% ± 10.09% to
83.89% ± 13.65% with the Hungarian accuracy (HA) for the FCHA and PAMAP databases, respectively. The
Adjust Rand Index (ARI) was also applied as clustering evaluation method. The developed algorithm consti-
tutes a contribution for the development of reliable evaluation methods of movement disorders for diagnosis
and treatment applications.
1 INTRODUCTION
Over time, the increasingly demand for objectiv-
ity in clinical diagnosis and the continuous pur-
suit for human wellbeing led to the development
of enginery for healthcare. The combined efforts
of medicine and engineering created and developed
techniques that provide large amounts of informa-
tion and simultaneously allow to interpret the gen-
erated data. According to different studies and our
previous work, accelerometry is a reliable system for
monitoring and evaluate daily physical activities over
time(In
ˆ
es Prata Machado, 2014), (Nishkam Ravi and
Littman, 2005), (A. M. Khan and Kim, 2010). In this
study, a framework for HAR systems was developed
and tested with different accelerometry databases ac-
quired with a triaxial accelerometer.
Biosignal processing requires an acquisition stage
and a transformation with conversion, filtering and
extraction of the useful features, which will depend
on the aim of the investigation. The feature extraction
step becomes very important for activity recognition
because it defines what information we will cluster
with. The selected features are directly related with
the information extracted from the ACC signals which
allows data organization inside each cluster by clus-
tering algorithms. The clustering organization must
show a lower variation between similar activities than
between different activities (Lin and Chen, 2005),
(Nishkam Ravi and Littman, 2005).
1.1 Unsupervised Learning Methods
Several techniques for data acquisition and process-
ing have been developed to improve the early di-
agnosis and to aid clinical treatment of various dis-
eases. ACC signals processing shows the importance
of objective monitoring human locomotion through
movement quantification when the medical diagno-
sis of pathologies is subjective and hard to trace such
as Parkinson’s disease and Cerebrovascular Accident
(CVA).
U. Maurer and coworkers (Uwe Maurer and
Deisher, 2006) and our group (In
ˆ
es Prata Machado,
2014) concluded that four features from time and fre-
quency domains can achieve high activity recogni-
76
Luísa Gomes A., Paixão V. and Gamboa H..
Human Activity Recognition Based on Novel Accelerometry Features and Hidden Markov Models Application.
DOI: 10.5220/0005215800760085
In Proceedings of the International Conference on Bio-inspired Systems and Signal Processing (BIOSIGNALS-2015), pages 76-85
ISBN: 978-989-758-069-7
Copyright
c
2015 SCITEPRESS (Science and Technology Publications, Lda.)

tion accuracy (about 99%). The work developed in
(In
ˆ
es Prata Machado, 2014) also contributed for the
physical activity (PA) recognition in accelerometry
with the K-means technique and also inferred that
one waist-worn accelerometer can identify the phys-
ical activities in an adequate manner. Furthermore,
(Adrian Ball and Velonaki, 2011) states that not only
k-means clustering has a good performance but also
the spectral clustering and the affinity propagation ap-
proaches show high accuracy results.
In the K-means method, the k value (number
of clusters) is defined and k points are chosen
randomly as cluster centers (Ittay Eyal and Rom,
2011),(Ghahramani, 2004), (Liao, 2005). Besides
the K-means method, other clustering methods were
applied in the present work such as Affinity Prop-
agation (Walter, 2007), DBSCAN and Ward (Liao,
2005). The Affinity Propagation clusters dataset
sending messages between pairs of samples until they
converge. These messages represent the suitability
for one data point to be the exemplar (similar) of the
other, which is updated in response to the values from
other pairs (Walter, 2007). In the DBSCAN method,
clusters are areas of high density, separated by regions
of low density, while the Ward method is based on
the minimal variance criterion where two clusters will
be agglomerated into one when a defined value is not
achieved. Otherwise, both clusters will be apart (Liao,
2005).
Clustering techniques applied to biosignals mor-
phology knowledge allows the detection and clas-
sification of different physical positions and every-
day movements. The clustering stage is crucial for
pathology detection and abnormal behavior evalua-
tion (Nunes, 2011) due to changes that can be de-
tected in the morphology of the accelerometry signal.
Therefore, it is mandatory to acquire enough knowl-
edge and data in order to be able to distinguish be-
tween normal movement patterns and those of certain
pathologies.
1.2 Hidden Markov Models
The Hidden Markov Models (HMM) are statistical
models where the observation is a probabilistic func-
tion of the state. In this case, the observation task is
made by inference and the training set will determine
the transition probabilities between the existing states
(Ping Guo and Wang, 2012),(Fosler-Lussier, 1998).
In (Trabelsi et al., 2013) the HMM were used to
identify the sequence corresponding to 12 physical
activities and the final results lead to 91.4 % as a mean
correct classification rate averaged over all observa-
tions. They also concluded that the HMM application
leads to a better classification rate (84 %) and with
k-means algorithm (60 %). This fact highlights the
potential benefit of automatic identification of human
activity with the HMM approach.
1.3 Clustering Performance Evaluation
After the clustering and HMM application, it is pos-
sible to assess if the separation of the data is similar
to the available ground truth set. In an unsupervised
learning context, it is important to create a data anno-
tation as a ground truth (A. M. Khan and Kim, 2010).
In the present work, two clustering performance
evaluation methods were used:
1. Hungarian Accuracy - With two solution sets, the
predicted labels and the ground truth set, it is pos-
sible to measure the distance between both sets.
The labeling of the predicted clusters must cor-
respond to the ground truth available. However,
if two partitions of the dataset are equivalent but
its labelings are represented with different labels,
there will be an ambiguity. To overcome this am-
biguity the labelled indices in one predicted so-
lution are permuted in order to increase the agree-
ment between the two solution sets under compar-
ison. This ambiguity can be minimized through
the Hungarian method with a matrix construction
based on the predicted labels and the ground truth
similarity. This performance evaluation method
measures the fraction of disagreement between
both labels sets through the diagonal of the result-
ing matrix (Kuhn, 2009).
2. Adjust Rand Index - No conjecture is performed
on the cluster arrangement and this technique
measures the similarity between the predicted la-
bels and the ground truth set, ignoring permuta-
tions. The ARI accuracy ranges from 0.0 (0%) to
1.0 (100%), for a perfect score (Clu, 2014).
It is proposed in the present work a framework
implementation for activity recognition through new
features and techniques application, presented in fig-
ure 1.
New features applied to accelerometry, instead of
audio signal alone, might contribute for the discovery
of important movement characteristics never detected
before, such as the CUIDADO features and wavelets.
A new feature inspired in the Mel scale is created and
implemented, called Log Scale Power Bandwidth.
The HMM are also applied to the clustering output
to improve the final results of the developed frame-
work.
Section 2 describes the materials and methods
adopted in this work to extract the ACC data for mo-
tion analysis. Section 3 describes the implementation
HumanActivityRecognitionBasedonNovelAccelerometryFeaturesandHiddenMarkovModelsApplication
77
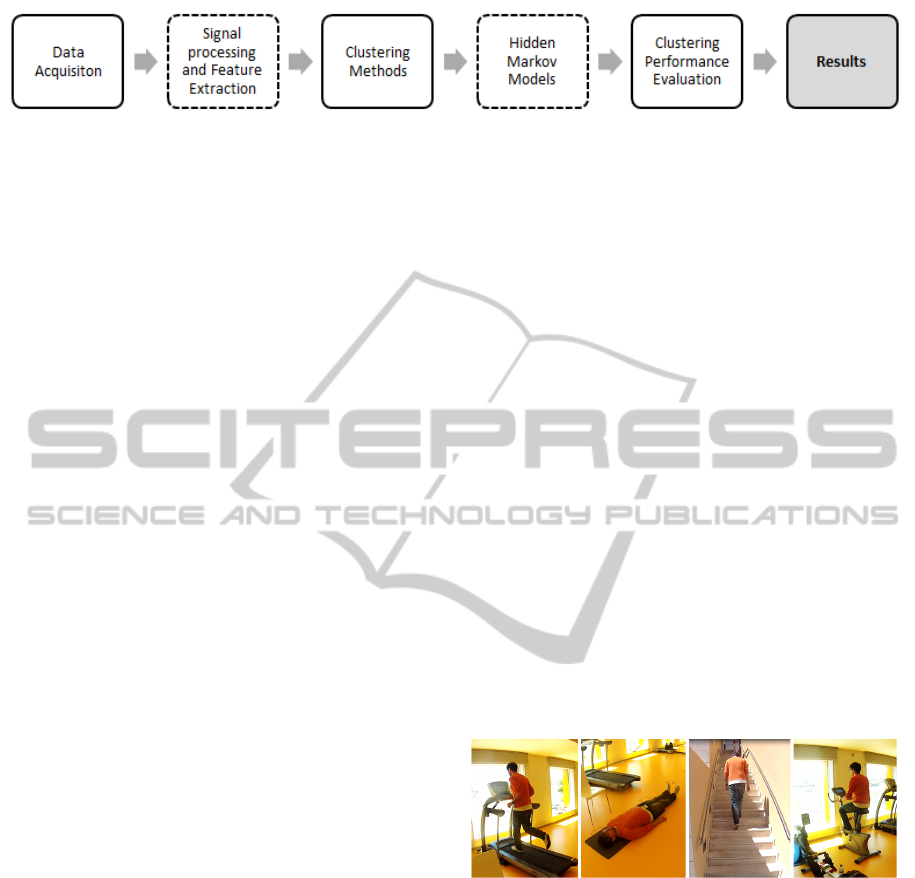
Figure 1: Overall structure of the framework developed for HAR systems. After the ACC data acquisition, the signal process-
ing and the feature extraction stages are carried out and its results are used in clustering methods and in the HMM application.
Finally, the clustering performance evaluation is applied. The hatched blocks show novel approaches for activity recognition.
of some algorithms that form the developed frame-
work, including the feature selection method and the
Log Scale Power Bandwidth implementation. Section
4 shows the results and respective discussion. Section
5 presents the main conclusions and the take home
message obtained with this work.
2 METHODOLOGY AND
MATERIALS
Two databases were analyzed in the present work:
the online available PAMAP database (PAM, 2014)
and the Foundation Champalimaud Human Activity
(FCHA) database, described in the following subsec-
tions.
2.1 FCHA Database
Seven tasks were carried out by 9 volunteers with an
age range from 23 to 44 years old: standing, sitting,
lying down, walking, running, and ascending and de-
scending stairs. All activities were performed with a
predefined order and time, excluding the ascending
and descending stairs tasks. The walking and run-
ning activities were carried out in a exercise treadmill
with predefined velocities (4 km/h and 10 km/h re-
spectively).
A triaxial accelerometry sensor was located on the
waist with an acquisition frequency sampling of 800
Hz and a resolution of 16 bits. The ACC data acquired
in this protocol formed the FCHA database. Data ac-
quisition was carried out in the Champalimaud Centre
for the Unknown with the OpenSignals software (Ri-
cardo Gomes and Gamboa, 2012).
2.2 PAMAP Database
The PAMAP database is available at (PAM, 2014)
and was also analyzed alongside the FCHA database
in order to verify that the framework created in this
work may suggest encouraging performances even
from acceleration data with different resolutions. The
PAMAP signals were acquired with a sampling fre-
quency of 100 Hz and a resolution of 13 bits. The
PAMAP signals show several physical activities and
nine were selected: standing, sitting, lying down,
walking, running, ascending and descending stairs,
jumping and cycling. The data was acquired from
8 volunteers within an age range 25-31 years and
the 3D-accelerometer sensor used was placed in the
chest. All movement tasks were performed at a vari-
able rhythm, according with each subject in order to
acquire data in the most realistic conditions as possi-
ble.
2.3 Annotation Stage
The annotation document concerns all the labels and
times of each activity performed by a given volunteer.
The initial and final time of each activity was anno-
tated in a JSON file created for each acquired sig-
nal. In addition to the annotation task adopted, the
present work added an extra stage where motion se-
ries of all volunteers were videotaped in order to avoid
erroneous times or labels and for ground truth valida-
tion (Figure 2).
Figure 2: Frames of the subject08’s videotape, performing
four tasks from the protocol: running, lying down, climbing
stairs and cycling.
3 PROPOSED FRAMEWORK
Several algorithms were implemented in this work,
including new previously unused features and the fea-
ture selection method. Algorithms such as the seg-
mentation process and the feature design stage, used
in the present work, were developed previously by our
group (In
ˆ
es Prata Machado, 2014).
BIOSIGNALS2015-InternationalConferenceonBio-inspiredSystemsandSignalProcessing
78

3.1 Feature Implementation
There are several features already suggested in other
studies and applied to accelerometry, such as the
Mean and Standard Deviation (Adrian Ball and
Velonaki, 2011),(Ittay Eyal and Rom, 2011), (God-
frey and
´
OLaighin, 2008), listed in Table 1 with
1
.
It is possible to group features according to dif-
ferent parameters, such as time, statistical and fre-
quency domains. However, in the frequency spec-
trum analysis, the FFT does not provide information
about the time at which these frequency components
occur, which leads to the need for a tool that allows
us to analyze the signal on both domains. A wavelet
is a specific technique for the time-frequency domain
and allows the visualization of the frequency content
over time and consequently a better transient event
description of an accelerometry signal (Godfrey and
´
OLaighin, 2008), (Jani Mantyjarvi and Seppanen.,
2001). The approximation coefficients from wavelets
decomposition reflect the main characteristics of the
signal and these values are used as feature coefficients
in this work (Demetrio Labate and Wilson, 2013),
(Galka and Zi
´
olko, 2008).
There are other features, called the ”CUIDADO
features”, applied for the first time for audio signals
by G. Peeters in (Peeters, 2004) and can be applied
and useful for accelerometry studies. Some from the
CUIDADO features, shown in the Table 1 with
2
,
were used in this work. For more information about
these, see (Peeters, 2004).
Table 1 shows all features from the four domains
analyzed in this work.
3.1.1 Log Scale Power Bandwidth
In the present work, the lower frequencies were stud-
ied in more detail than higher frequencies through
logarithmic scales in order to analyze meticulously
the frequency domain. This study was inspired by the
audio spectrum and the Mel scale which ultimately
lead to the feature Log Scale Power Bandwidth cre-
ation.
The Log Scale Power Bandwidth coefficients are
computed and its input is the motion data. This algo-
rithm concerned five stages:
1. The first stage was the pre-emphasizing of the sig-
nal in the time domain. This stage filters a data se-
quence (the input segment signal) using a digital
filter which emphasizes the energy of the signal
at high frequencies with a pre-emphasis factor of
0.97;
2. The second step refers to the framing which di-
vides the input data into a set of 3 (M) frames,
Table 1: List of all features used in the present work and
respective domains and number of output coefficients for
each acceleration component: x, y, z, and total accelera-
tion.
1
Refers to all traditional features already applied in
accelerometry (In
ˆ
es Prata Machado, 2014);
2
Refers to the
CUIDADO features used in audio recognition;
3
Refers to
the new feature type created and implemented in this work.
Feature Type Number of Output
Coefficients (for each
acceleration component)
Statistical
Skewness
1
1
Kurtosis
1
1
Histogram
1
10
Mean
1
1
Standard Deviation
1
1
Interquartile Range
1
1
Time
Root Mean Square
1
1
Median Absolute
Deviation
1
1
Zero Crossing Rate
1
1
Pairwise Correlation
1
3 (in total)
Autocorrelation
1
1
Temporal Centroid
2
1
Variance
2
1
Frequency
Maximum Frequency
1
1
Median Frequency
1
1
Power Spectrum
1
2
Fundamental
Frequency
1
1
Power Bandwidth
1
10
Log Scale Power
Bandwidth
3
40
Total Energy
2
1
Spectral Centroid
2
1
Spectral Spread
2
1
Spectral Skewness
2
1
Spectral Kurtosis
2
1
Spectral Slope
2
2
Spectral Decrease
2
1
Spectral Roll-off
2
1
Time-Frequency
Wavelets
2
20
each of these with 256 (N) samples;
3. Next, the conversion of the signal segment into the
frequency domain is carried out through the Fast
Fourier Transform application. However, when-
ever a finite Fourier Transform is applied and if
the start and end of the finite data do not match,
there will be a discontinuity in the signal. In this
case, there will show up nonsense and undesirable
high-frequencies in the Fourier transform. There-
fore, a windowing stage was computed to the data
sample with a Hamming window to make sure
HumanActivityRecognitionBasedonNovelAccelerometryFeaturesandHiddenMarkovModelsApplication
79

that the ends match up;
4. A set of triangular overlapping windows in the
range 133-3128 Hz was created. This set of tri-
angular filters was spaced linearly at lower fre-
quency, below 199 Hz, and logarithmic spaced
above 199 Hz;
5. The triangular filter bank was applied to the result-
ing data from the step 3 which gives the powers at
each frequency. Finally, the algorithm computes
the log (in base 10) of the powers at each fre-
quency and returned the Log Scale Power Band-
width coefficients as the amplitudes of the result-
ing spectrum.
3.2 Feature Selection
Feature normalization to zero mean and unit vari-
ance is adopted before creating any feature selection.
Next, the most suitable features for activity recogni-
tion were identified once the feature computation is a
time consuming and computationally heavy task.
The protocol for feature selection is based on the
Forward Feature Selection protocol and aims to select
10 features at most for each clustering method used.
This study may be described by the following steps:
1. Elimination of the redundant information: Corre-
lation between all features and removal of the re-
dundant features. The second feature is removed
when two features show correlation values greater
than or equal to 0.98. The resulting set from this
correlation and elimination stage is called A;
2. Selection of the best fitting features: 20 features
with the highest ARI value are chosen among the
set A, named set B. From the new set formed by
20 features types, B, the feature type with the
highest ARI performance is collected to the set
C, which leaves the original set B with only 19
features. Next, the algorithm combines the set C
with the existing feature types from the set B. The
combination with the highest ARI value and the
corresponding set are identified. The new feature
belonging to B and to the identified set is collected
by C. In each iteration, a new feature is deleted
from B and is collected to C. This iterative proce-
dure repeats until C shows the best combination
of 10 features;
3. Saving the final results: The algorithm finishes
the procedure and saves the name and ARI per-
formance of the 10 features set.
3.3 Hidden Markov Models Application
HMM were applied to the clustering results to achieve
higher ARI accuracies in activity recognition. Its
application was formed by the training and testing
stages.
The implemented algorithm uses the ground truth
(true labels) by collecting frequencies of the transi-
tions between all different activities/states and also
defines the initial state of a given sequence of ac-
tivities through the most frequent initial state. The
frequencies recorded are then converted to the prob-
abilities of the existing symbols and state sequences.
Finally, the testing stage estimates the most probable
sequence of hidden states based in the trained model
and with the Viterbi algorithm.
In the present work, the HMM topology is a com-
pletely connected structure of an ergodic model and
it uses the labels from the clustering methods as test
set and the annotation data (ground truth) as training
set. Finally, the HMM output is used in the clustering
performance evaluation stage.
4 RESULTS AND DISCUSSION
All studies here presented used defined parameters
according to the highest ARI accuracy for each of
these, such as: window segmentation, filtering stage
and wavelet level decomposition. Segments with time
duration of 5 seconds were used as window segmen-
tation. The 8
th
level was selected as the best level
decomposition for the wavelets algorithm and the fil-
tering stage was eliminated from the signal processing
stage. The referred parameters were used in all stud-
ies presented in the following sections, 4.1, 4.2 and
4.3.
Clustering methods were also selected according
to the ARI performances in order to improve the clus-
tering accuracy. The K-means, Affinity Propagation,
DBSCAN and Ward showed the highest ARI for ACC
data. In parallel to the unsupervised learning tech-
niques, three classification methods were used: K-
Nearest Neighbors, Random Forest and Linear Dis-
criminant Analysis (LDA).
4.1 Best set of Features
Feature selection is formed by two stages. The first
part aims to find the best number of feature types for
activity recognition and second stage aims to identify
which feature types must be used.
The best 10 features were computed from the For-
ward Feature Selection Algorithm, for each subject
BIOSIGNALS2015-InternationalConferenceonBio-inspiredSystemsandSignalProcessing
80

and clustering method. Figure 3 shows the ARI per-
formance (%) for each number of features and for
each clustering method in order to select the best
number of features to use in ACC recognition. This
study used as ACC data the FCHA database and all
implemented features from four domains: statistical,
time, frequency and time-frequency, presented in Ta-
ble 1.
Figure 3 suggests higher ARI percentages in 4 to
7 features. For a more detailed analysis, table 2 shows
the ARI performances achieved with different cluster-
ing methods when the framework uses the best 4 to 7
feature types (sets A, B, C and D respectively) and all
features.
From table 2, it can be concluded that the set B
is the best set for K-means and Ward performances
with 89.97% ± 9.97% and 88.56% ± 11.72%, respec-
tively. On the other hand, the set C showed higher per-
formance for the DBSCAN method with 80.43% ±
6.29% while the set D showed best performance for
the Affinity Propagation with 81.19% ± 5.99%. For
this reason, any choice from set B, C and D is ac-
ceptable. For K-means, Affinity Propagation, DB-
SCAN and Ward, the clustering performance values
are 84.54% ± 9.23% ,81.19% ± 5.99%, 79.84% ±
10.75% and 84.73% ± 9.00% for set D, 89.97% ±
9.97%, 76.85% ± 10.30%, 78.12% ± 10.95% and
88.56% ± 11.72% for set B. Overall, sets B and D
showed similar computing times (with difference of
approximately 13 seconds) and the best accuracy val-
ues. In the present study set D is the set of the best 7
features and it was chosen for the formed framework.
After selecting the best number as 7 features, the
best group of features was found through a histogram,
where the occurrences of each feature type were rep-
resented. The 10 most used features in each clustering
method were pooled, some of them belonging to the
same feature type, presented in the figure 4.
The histogram shown in figure 4 suggested that
the Forward Feature Selection algorithm used with
a higher frequency the Log Scale Power Bandwidth,
Root Mean Square, Total Energy, Autocorrelation,
Variance, Wavelet Coefficients and the Mean for HAR
systems. Therefore, these feature types are the most
used and promising features for the developed frame-
work.
Furthermore, figure 4 suggested that the Log Scale
Power Bandwidth occurs more frequently (over 20%)
than all the other types of features (with less than 20%
in all occurrences). The Log Scale Power Bandwidth
algorithm involved complex stages and offered a wide
number of coefficients as output. The resulting data
from those 40 output coefficients are complementary.
One particular coefficient tended to be more sensible
in activity distinction due to the variation in behav-
ior over time while the other coefficient may identify
better other different tasks. Thus, by using this type
of feature, all these coefficients are used together and
there will be more information related to the activity
distinction compared with other type of features with
fewer information and lower number of coefficients.
Moreover, the Log Scale Power Bandwidth fea-
ture considered data from the lower frequencies. A
detailed analysis in this frequency range suggested
that there was important information for activity
recognition in accelerometry.The information located
at low frequencies was preserved due to the elimina-
tion of the filtering step in the signal processing stage.
Therefore, no information was lost and the GA com-
ponent was maintained in the ACC data.
It was possible to observe from figure 5, and in op-
position to others features, that each Log Scale Power
Bandwidth coefficient showed an overall distinction
for all activities carried out by the volunteers. There-
fore the choice of this type of feature from the For-
ward Feature Selection as the best feature is justified
for its greater ability for activity recognition.
Some difficulties referred in (In
ˆ
es Prata Machado,
2014) such as the hard discrimination between sit-
ting and standing positions and between walking and
running activities were also identified in this work.
These difficulties were subdued due to the presence
of the GA component in the processed data and the
use of the Log Scale Power Bandwidth and Wavelet
coefficients as features. The Horizon Plot in figure 5
showed the variation of six Log Scale Power Band-
width coefficients, six Wavelet coefficients and one
coefficient of the Autocorrelation, Mean, Root Mean
Square, Total Energy and the Variance from the x-axis
component over time. It is possible to observe that
feature types such as Log Scale Power Bandwidth and
Wavelets are important for the standing and sitting po-
sitions distinction as well in many other tasks.
4.2 Hidden Markov Models Application
All the existing transitions in the test set (predicted la-
bels from the clustering algorithms) with lower prob-
ability of occurrence may be a consequence of clus-
ter miscalculation. These transition probabilities were
gathered from the ground truth (train data) and all
transitions with low probability of occurrence are
avoided and replaced by a more likely transition.
The influence of the Hidden Markov Model ap-
plication and its improvement (in %) is presented in
figure 6 and in table 3. All implemented features
were used in this study and only the FCHA database
was analyzed. The improvement values shown in the
HumanActivityRecognitionBasedonNovelAccelerometryFeaturesandHiddenMarkovModelsApplication
81
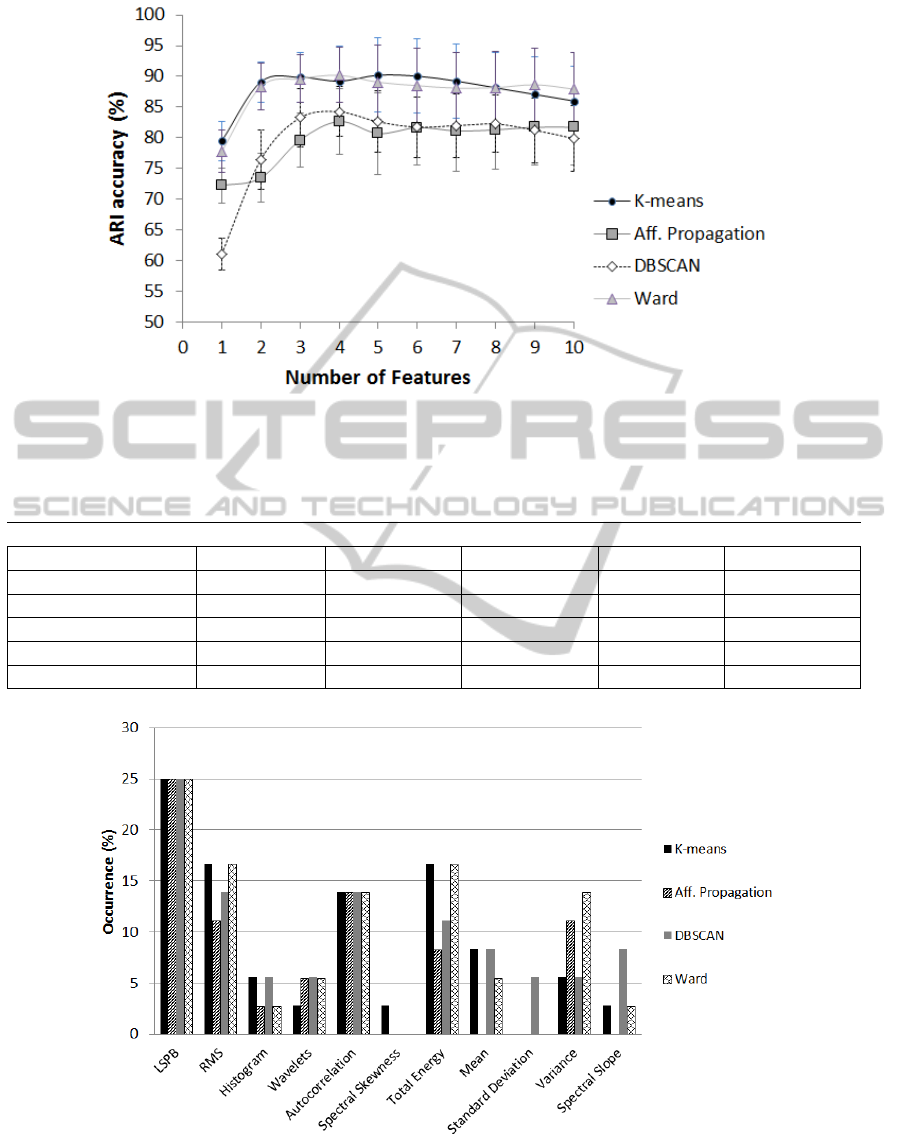
Figure 3: ARI performances (%) as a function of different numbers of features (from 1 to 10 features) and according to
different clustering techniques: K-means, Affinity Propagation, DBSCAN and Ward.
Table 2: ARI performances for all features (first column) and for the best 4 to 7 features (set A-second, set B-third, set
C-fourth and set D-fifth columns). The last row refers to the time interval used to compute each set of features.
ARI (%)
Clustering Methods All Features Set A Set B Set C Set D
K-means 87.69 ± 5.56 87.37 ± 12.78 89.97 ± 9.97 84.52 ± 7.56 84.54 ± 9.23
Affinity Propagation 78.41 ± 6, 86 76.85 ± 10.30 76.85 ± 10.30 78.33 ± 6.48 81.19 ± 5.99
DBSCAN 78.36 ± 6.96 74.18 ± 9.67 78.12 ± 10.95 80.43 ± 6.29 79.84 ± 10.75
Ward 86.31 ± 8.68 85.96 ± 13.93 88.56 ± 11.72 84.73 ± 9.00 84.73 ± 9.00
Time Response 347.16 107.46 132.13 142.25 145.05
Figure 4: Representation of the Forward Feature Selection results. The algorithm outputted the set of the best 10 features
for each clustering method. Each column corresponds to all occurrences of each feature type in all resulting sets for each
clustering method.
BIOSIGNALS2015-InternationalConferenceonBio-inspiredSystemsandSignalProcessing
82
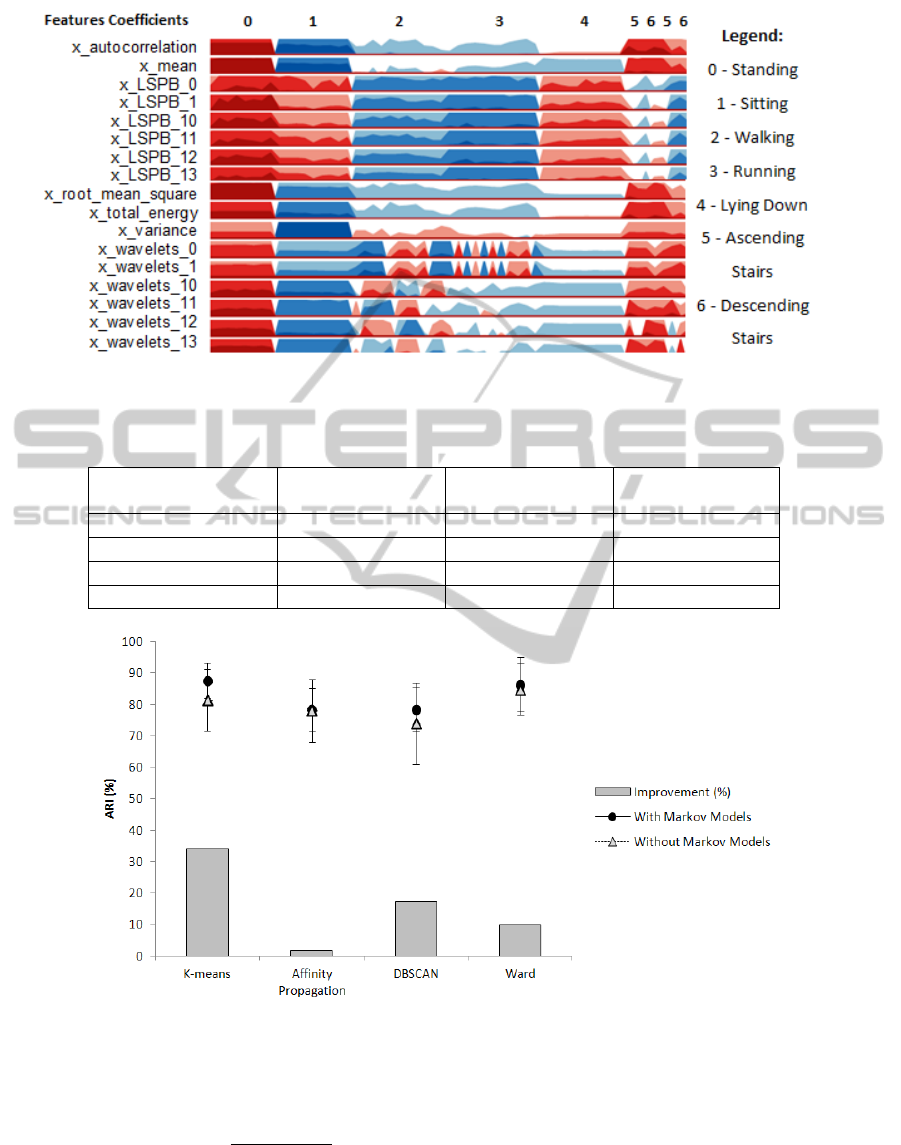
Figure 5: Horizon Plot with some feature coefficients from the X-axis acceleration component which vary over time according
to the activity type performed.
Table 3: Clustering performances through ARI without and with the HMM application and its improvement.
Clustering ARI(%) without ARI(%) with Improvement (%)
Methods HMM application HMM application
K-means 81.37 ± 9.83 87.69 ± 5.56 33.92
Affinity Propagation 78.02 ± 9.90 78.41 ± 6.86 1.76
DBSCAN 73.89 ± 12.98 78.36 ± 6.96 17.10
Ward 84.82 ± 8.17 86.31 ± 8.68 9.81
Figure 6: Clustering performances through ARI with and without the HMM application (%) and its performances improve-
ment (%) in bars shown in table 3.
present section is represented by:
Improvement(%) =
100(x
2
− x
1
)
100 − x
1
(1)
where:
x
1
- ARI accuracy value without HMM application
x
2
- ARI accuracy value with HMM application
The obtained improvement values were 33.92%,
1.76%, 17.10% and 9.81%, for K-means, Affinity
Propagation, DBSCAN and Ward method, respec-
tively. These results deserve a special attention be-
cause there is a significant improvement for certain
clustering methods such as the K-means. Thus, it
is important to take into account the HMM applica-
tion together with the adopted unsupervised learning
HumanActivityRecognitionBasedonNovelAccelerometryFeaturesandHiddenMarkovModelsApplication
83

method. All improvement values were positive and in
this case the HMM algorithm does not provide heavy
computational demands hence it may be applicable to
all demonstrated situations.
4.3 Evaluation of the Performance of
the Framework
After the framework construction, the FCHA
database and the PAMAP database were applied to
the developed algorithms set. In this study, unsuper-
vised and supervised learning approaches were ap-
plied. The tables 4 and 5 showed all results achieved
with the ARI and the HA application and with classifi-
cation methods: Random forest, LDA and K-Nearest
Neighbors, which K value equals the number of activ-
ities carried out. The accuracy score method was used
in classification techniques in which the ground truth
was used as training set and the clustering output as
test set.
The PAMAP signals were acquired with a fre-
quency sampling of 100 Hz while the FCHA database
is formed by ACC signals acquired with 800 Hz.
Thus, this data showed different resolutions which in-
fluence the amount of information available for the
clustering and classification methods.
Table 4: Clustering evaluation with the ARI and the HA (in
%) for K-means, Affinity Propagation, DBSCAN and Ward.
Clustering (ARI %)
Databases FCHA PAMAP
K-means 84.54 ± 9.23 61.56 ± 13.93
Affinity Propagation 81.19 ± 5.99 63.00 ± 0.19
DBSCAN 79.84 ± 10.75 74.26 ± 16.06
Ward 84.73 ± 9.00 60.53 ± 13.70
Clustering (HA %)
Databases FCHA PAMAP
K-means 89.05 ± 7.43 74.47 ± 8.35
Affinity Propagation 73.20 ± 7.98 83.89 ± 13.65
DBSCAN 76.62 ± 9.68 70.75 ± 10.09
Ward 87.10 ± 8.87 71.13 ± 10.37
Table 5: Classification accuracy (in %) with K-Nearest
Neighbors, Random Forest and LDA methods.
Classification (Accuracy %)
Databases FCHA PAMAP
K-Nearest Neighbors 97.78 ± 6.67 99.40 ± 1.19
Random Forest 95.39 ± 12.64 97.89 ± 3.89
LDA 98.57 ± 4.30 98.03 ± 2.37
The results obtained within the ARI accuracy
ranged from 79.84% ± 10.75% to 84.73% ± 9.00%
and from 60.53% ± 13.70% to 74.26% ± 16.06% for
the FCHA and PAMAP databases, respectively. On
the other hand, the Hungarian accuracy results ranged
from 73.20% ± 7.98% to 89.05% ± 7.43% and from
70.75% ± 10.09% to 83.89% ± 13.65% for the same
databases. The main cause of the difference between
the two databases may be related to the large differ-
ence in resolution, since the sampling frequencies for
the FCHA base and the PAMAP database are 800 and
100 Hz, respectively. The FCHA data shows eight
times more information than PAMAP data, which
leads to a higher accuracy values. Unlike clustering,
classification uses the ground truth for training and
also showed high results: from 95.39% ± 12.64% to
99.40% ± 1.19% for both databases.
More than 85% of the presented results showed an
accuracy higher than 70% which revealed the frame-
works robustness and versatility for activity recogni-
tion with ACC signals, acquired with different sensors
and different resolutions.
4.4 Conclusions
This work aimed to create and develop a novel ges-
ture recognition system based on the consulted litera-
tures concepts and presented in (In
ˆ
es Prata Machado,
2014).
In the present work and in addition to those used
in our previous work new features were implemented,
such as the Log Scale Power Bandwidth coefficients.
Other features previously used in audio recognition
were also used in ACC data such as the CUIDADO
features and wavelets coefficients. This work offered
a set of 423 feature types for machine learning tech-
niques which provide more and new information re-
garding the performed movement tasks compared to
the literature (Ghahramani, 2004),(Jani Mantyjarvi
and Seppanen., 2001), (Nishkam Ravi and Littman,
2005).
The Forward Feature Selection aimed to reduce
the undesirable redundancy between features and to
select the set of features that may lead to the best
frameworks performance. The chosen features se-
lected as the most suitable feature types for HAR
systems are the Log Scale Power Bandwidth, Root
Mean Square, Total Energy, Autocorrelation, Vari-
ance, Wavelet Coefficients and Mean coefficients.
The achieved results also suggested that it is im-
portant not to waste any information regarding to
movement. The presence of the information located
in lower frequencies, such as the GA component, and
the Log Scale Power Bandwidth implementation may
lead to better static activity distinction.
The obtained results with the FCHA database and
PAMAP database showed that the developed frame-
work is suitable for activity recognition even for ACC
data with a large difference in resolution.
The major achievements of the current work al-
BIOSIGNALS2015-InternationalConferenceonBio-inspiredSystemsandSignalProcessing
84

lowed to construct a novel HAR system with HMM
which may lead to better performances in activity
recognition. The created framework with a small
number of feature types also ensure high machine
learning results without heavy computational de-
mands. Therefore, as expected accelerometry is a
suitable technique for monitoring movement patterns
in free-living subjects over long periods of time. The
knowledge acquired over this thesis may be applied
into the clinical setting for the diagnosis and physio-
therapy fields.
REFERENCES
(January 2014). Pamap, http://www.pamap.org/demo.html.
(September 2014). Clustering, http://scikit-
learn.org/stable/modules/clustering.html.
A. M. Khan, Y.-K. Lee, S. Y. L. and Kim, T.-S. (2010).
a triaxial accelerometer-based physical-activity recog-
nition via augmented-signal features and a hierarchi-
cal recognizer. 14(4):11661172.
Adrian Ball, David Rye, F. R. and Velonaki, M. (2011). A
comparison of unsupervised learning algorithms for
gesture clustering. pages 111–112.
Demetrio Labate, G. W. and Wilson, E. (2013). Wavelets.
60(1):66–76.
Fosler-Lussier, E. (1998). Markov models and hidden
markov models - a brief tutorial.
Galka, J. and Zi
´
olko, M. (2008). Wavelets in speech seg-
mentation.
Ghahramani, Z. (2004). Unsupervised learning. pages 3–4.
Godfrey, R. Conway, D. M. and
´
OLaighin, G. (2008). Di-
rect measurement of human movement by accelerom-
etry. Elsevier, 30(10):1364–1386.
In
ˆ
es Prata Machado, Ricardo Gomes, H. G. V. P. a. (2014).
Human activity recognition from triaxial accelerome-
ter data feature extraction and selection methods for
clustering of physical activities.
Ittay Eyal, I. K. and Rom, R. (2011). Distributed data clus-
tering in sensor networks. 24(5):207222.
Jani Mantyjarvi, J. H. and Seppanen., T. (2001). Recogniz-
ing human motion with multiple acceleration sensors.
2:747 – 752.
Kuhn, H. W. (2009). the hungarian method for the assign-
ment problem. 2:83–97.
Liao, T. (2005). Clustering of time series data - a survey.
38(11):1857 – 1874.
Lin, R.-S. and Chen, L.-H. (2005). A new approach
for audio classification and segmentation using gabor
wavelets and fisher linear discriminator. 19(6):807–
822.
Nishkam Ravi, Nikhil Dandekar, P. M. and Littman, M. L.
(2005). Activity recognition from accelerometer data.
3:1541–1546.
Nunes, N. F. M. (2011). Algorithms for time series cluster-
ing. Master’s thesis, Physics Department, Faculty of
Sciences and Technology, New University of Lisbon
and Plux, Wireless Biosignals, Portugal.
Peeters, G. (2004). A large set of audio features for
sound description (similarity and classification) in the
cuidado project.
Ping Guo, Zhenjiang Miao, X.-P. Z. Y. S. and Wang, S.
(2012). Coupled observation decomposed hidden
markov model for multiperson activity recognition.
22(9):1306 – 1320.
Ricardo Gomes, Neuza Nunes, J. S. and Gamboa, H.
(2012). Long term biosignals visualization and pro-
cessing.
Trabelsi, D., Samer Mohammed, Faicel Chamroukhi, L. O.,
and Amirat, Y. (2013). An unsupervised approach
for automatic activity recognition based on hidden
markov model regression. 10(3):829 – 835.
Uwe Maurer, Asim Smailagic, D. P. S. and Deisher, M.
(2006). Activity recognition and monitoring using
multiple sensors on different body positions. pages
113–116.
Walter, S. F. (2007). Clustering by affinity propagation.
Master’s thesis, Department of Physics, ETH Zurich,
Switzerland.
HumanActivityRecognitionBasedonNovelAccelerometryFeaturesandHiddenMarkovModelsApplication
85
