
Heart Disease Diagnosis Using C4.5 Algorithms
A Case Study
Ali Idri
1
, Ilham Kadi
1
and Halima Benjelloun
2
1
ENSIAS, University Mohammed V of Rabat, Rabat, Morocco
2
Cardiology Department, University Hospital Avicenne, Rabat, Morocco
Keywords: Data Mining, Decision Tree, C4.5 Algorithm, Autonomic Nervous System.
Abstract: Data mining (DM) is a powerful process to extract knowledge and discover new patterns embedded in large
data sets. DM has been increasingly used in medicine, particularly in cardiology. In fact, data mining
applications can greatly benefits all parts involved in cardiology such as patients, cardiologists and nurses.
Among the various units of a cardiology department, Autonomic Nervous System (ANS) is one of the most
important and active unit. Thus, the aim of this study is to build a decision tree-based classifier using a data
set collected from an ANS unit of the Moroccan university hospital Avicenne. The decision tree
construction algorithm used in this study is C4.5. The classifier obtained presented a high level of accuracy
measured in terms of error rate.
1 INTRODUCTION
The autonomic nervous system (ANS) is the
designation applied by John Langley (Langley,
1921) to a complex network of peripheral nerves and
ganglia. It is often considered as a motor system for
control of autonomic (visceral) effectors. These
effectors include smooth muscle, glands, and the
heart. Furthermore, the ANS uses sensory inputs as
part of visceral reflexes and independently as part of
broader control mechanisms (Kreibig, 2010).
However, the ANS is frequently subject to
malfunctions Thereby, several dynamic tests are
used to evaluate the cardiovascular malfunctions in
different pathological contexts (diabetes, Parkinson
syndromes, etc) (Grubb and Karas, 1999). During
these dynamic tests, the changes in blood pressure
and heart rate continuously were recorded and
analyzed. Thereby, several data are recorded for
each patient who in turn generates big amounts of
data. These increasing volumes of data are very well
suited to be processed using data mining techniques
that can handle them with efficiency.
Classification is one of the main tasks of DM. In
fact, classification techniques are capable of
processing a large amount of data. They may predict
categorical class labels and classifies data based on a
training set (Aparna et al., 2012). Classification
techniques used various algorithms namely: decision
tree (DT), support vector machine (SVM), K nearest
neighbors (K-NN) classifier and others (Esfandiari
et al.
, 2014). These algorithms and others are used in
cardiology. (Kumari and Godara, 2011) reviewed in
her study four classification techniques used in
cardiology: Ripper classifier, DT, ANN (artificial
neural networks) and SVM. This research work
provided an analysis of the four techniques on the
basis of their structure and efficiency. DT algorithms
are considered as one of the popular classification
and regression techniques. They are produced by
algorithms that identify various ways of splitting a
data set into branch-like segments. In fact, decision
tree algorithms break down a dataset into smaller
and smaller subsets while at the same time an
associated decision tree is incrementally developed.
The final result is a tree with decision nodes and leaf
nodes (Apté and Weiss, 1997). There is several
decision tree algorithms including ID3 and C4.5
developed by Quinlan (Quinlan, 1979), and CART
developed by Breiman (Breiman et al., 1984). The
C4.5 algorithm used in this study is an improved
extension of ID3 algorithm allowing handling
continuous values, missing values and pruning trees
after creation.
In this paper, a case study is carried out with the
ANS unit of university hospital Avicenne. Indeed, in
this unit, ANS tests are performed for several
patients. However, the test results are measured and
397
Idri A., Kadi I. and Benjelloun H..
Heart Disease Diagnosis Using C4.5 Algorithms - A Case Study.
DOI: 10.5220/0005216403970404
In Proceedings of the International Conference on Health Informatics (HEALTHINF-2015), pages 397-404
ISBN: 978-989-758-068-0
Copyright
c
2015 SCITEPRESS (Science and Technology Publications, Lda.)

analyzed manually by the specialists. This manual
procedure makes the task more difficult for the
specialists. Thus, in order to help those specialists,
the aim of this study is to build a classifier by
applying C4.5 decision tree algorithm to a data set of
the hospital Avicenne ANS unit. This data set
contains the records heart rate and blood pressure of
the ANS unit’s patients during the several dynamics
tests. The tests that are adopted by specialists in this
case study are: deep breathing (Shields, 2009), hand
grip (Coghlan, 1996), (Johansen et al., 1997), mental
Stress (Coghlan, 1996), (Johansen et al., 1997), and
orthostatic test (Mejía-Rodríguez et al., 2009). For
each test, several measurements are recorded and
analyzed in a relevant and efficient manner to
produce an accurate diagnosis. However, until now,
the analysis process in the Avicenne ANS unit is
done manually by the specialists which can be hard
and challenging, especially in the presence of
several cases at one time. Hence, we used the C4.5
algorithm to develop a classifier as a decision
support system to help cardiologists when analyzing
patient records.
The structure of this paper is organized as
follows: Section 2 presents an overview of the
existing studies in literature applying C4.5 decision
tree algorithm in cardiac data sets. Section 3
provides some details about the different tools used
in this study. Section 4 describes the experimental
design. Section 5 presents and discusses the results
obtained. Finally, conclusion and future work are
presented in Section 6.
2 RELATED WORK
Decision trees are known as one of the most popular
methods for classification in medical data mining
due to their high frequency in literature (Witten and
Frank, 2005) (Esfandiari et al., 2014). Thereby, C4.5
algorithm is one of the well-known decision tree
algorithms because of its efficiency and
comprehensive features (Quinlan, 1993, 1996). As a
result, data miners have used this algorithm in
different disciplines of medical field including
cardiology (Esfandiari et al., 2014 ). However, to the
best of our knowledge, there is no existing study that
applies data mining techniques and particularly C4.5
algorithm in an ANS unit. Thereby, since ANS tests
are mainly based on the operational observation of
the cardiovascular system and measuring heart rate
and blood pressure, a summary of some studies
conducted in cardiology using C4.5 algorithm is
presented in this Section. Mašetić and Subasi have
evaluated the effect of C4.5 decision tree in creating
a model that will detect and separate normal and
congestive heart failures (CHF) on the long-term
ECG time series. Experimental results showed that
C4.5 algorithm has significant role in identification
and classification of ECG heartbeat signals with an
accuracy of 99.86% (Mašetić and Subasi, 2013).
Zheng et al. (Zheng et al., 2005) applied a new
model called R-C4.5 which is based on C4.5 and
improved the efficiency of attribution selection and
partitioning models. An experiment showed that the
rules created by R-C4.5s can give health care experts
clear and useful explanations. Karaolis et al.
developed a data mining system based on decision
trees for the assessment of Coronary heart disease
(CHD) related risk factors targeting in the reduction
of CHD events. Five different splitting criteria were
used by C4.5 for extracting rules based on the risk
factors. The system was applied on a dataset
collected from a hospital including 528 cases and
has proved good and promising accuracy rates
(Karaolis et al., 2010). Moreover, Pavlopoulos et al.
(Pavlopoulos et al, 2004) used the C4.5 algorithm to
analyze different heart sound features, which assist
clinicians to make a better diagnosis in CHD.
Overall, the results obtained by studies applying
C4.5 algorithm in cardiology were satisfactory and
in some cases they were reached an accuracy of
99.86% (Mašetić and Subasi, 2013).
3 BACKGROUND
In this section, a detailed description of the ANS is
presented. Thereafter, a brief presentation of C4.5
decision tree algorithm is introduced.
3.1 Autonomic Nervous System
The autonomic nervous system is the part of the
nervous system that is involved in homeostasis by
coordinating internal functions of the body and
regulating unintentionally and automatically
different organs including the cardiovascular system.
It controls, in particular, smooth muscle (digestion,
blood, etc), heart muscle, some endocrine glands and
the majority of exocrine glands (digestion, sweating,
etc). The ANS is the motor time (innervations of
smooth muscle fibers) and sensory (pain in tension,
compression, repletion) (Kreibig, 2010).
The ANS is composed of two complementary
systems anatomically and physiologically
distinguishable: the sympathetic nervous system
(SNS) and the parasympathetic nervous system
HEALTHINF2015-InternationalConferenceonHealthInformatics
398

(PNS). The balance of these two systems provides
the balance of physiological functions (Benarroch,
1993). The SNS is associated to the action: it acts as
a defense and put the body on alert in order to
prepare it for the activity. However, the PNS aims to
slow the body functions and thereby conserve
energy. It promotes the internal working of the body
by putting it to rest.
The ANS is frequently subject to malfunctions
that are called dysautonomias. The use of dynamic
tests allows the evaluation of cardiovascular
dysautonomias in various pathological contexts such
as diabetes and Parkinson syndromes (Grubb and
Karas, 1999). These dynamic tests consist in the
analysis of changes in blood pressure and heart rate
continuously recorded at rest and during the several
tests including deep breathing test, stand test,
Valsalva maneuver, tilt test and hand-grip test.
In this paper, a case study is conducted by means
of applying C4.5 decision tree algorithm on a data
set of the ANS unit of university hospital Avicenne.
This unit is specialized on conducting the ANS tests
to diagnose cardiovascular dysautonomias patients
and provide them the appropriate treatment. The
tests conducted by this unit are:
Deep breathing (DB) (Shields, 2009): it has a
major interest in the determination of the vagal
response (VR). It assesses autonomic function by
measuring changes in heart rate (HR) in response
to a deep breath. The calculation of (VR) is
obtained by means of Eq. 1.
VR=100*(HRmax - HRmin)/HRmin
(1)
Hand Grip (HG) (Coghlan, 1996), (Johansen et
al., 1997): This is a manual effort contraction
performed to determine changes in the blood
pressure (BP) in static effort. In normal
condition, muscle contraction causes a rise in HR
and BP. In this test, two values are measured:
VR, by the same method as Deep breathing test,
and Peripheral sympathetic alpha activity by
means of Eq. 2.
PSR α=100*(BPmax–BPmin)/BPmin (2)
Mental Stress (MS) (Coghlan, 1996), (Johansen
et al., 1997): The patient performs mental
arithmetic calculations. The result is an increase
in BP and in HR by activation of the central
sympathetic nerve (Low, 1997). In mental stress,
the central sympathetic nerves activities “α” was
evaluated by measuring the variations of BP
using Eq. 3 (Coghlan, 1996), (Johansen, 1997):
CSR α=100*(BPmax– BPmin)/BPmin
(3)
The central sympathetic nerves activities “β” was
evaluated by measuring the variations of HR
using Eq. 4 (Coghlan, 1996), (Johansen, 1997):
CSR β=100* (HRmax - HRmin)/HRmin (4)
Orthostatic test (Ort) (Mejía-Rodríguez et al.,
2009): it aims at measuring HR and BP
variations in different positions: stand up and
rest. In fact, the transition from rest position to a
standing position causes a variety of
physiological processes of adaptation in normal
subjects and a variation in HR and BP. Thereby,
several measures of HR and BP are taken in
orthostatic test including: VR, basal state and
supine position.
In this paper, a case study is conducted by means
of applying C4.5 decision tree algorithm on a data
set of the ANS unit. According to the results of these
tests, a set of preliminary conclusions is deducted.
These conclusions are analyzed by the specialists to
provide a global synthesis and diagnosis of the
patient’s state. Subsequently, an appropriate
treatment is prescribed by the cardiologist in order to
be respected by the patient.
3.2. C4.5 Decision Tree Algorithm: an
Overview
C4.5 is a decision tree generating algorithm
introduced by Quinlan for inducing Classification
Models (Quinlan, 1993). It is an extension of the
basic ID3 algorithm used to overcome its
disadvantages. C4.5 algorithm made several
improvements in order to enhance the ID3
algorithm. Some of these are:
Choosing an appropriate attribute selection
measure.
Handling training data with missing attribute
values.
Handling attributes with differing costs.
Pruning the decision tree after its creation.
Handling continuous attributes.
C4.5 algorithm builds a decision tree from a set
of training data similar to the ID3 algorithm, using
the concept of information entropy. In fact, C4.5
conducts a recursive partition of observations in
branches to construct a tree for the purpose of
improving the prediction accuracy. In order to do so,
mathematical algorithms are used to identify a
variable and corresponding threshold for the variable
that splits the input observations into two or more
subgroups. This step is repeated at each leaf node
until the complete tree is constructed (Han and
Kamber, 2001). In addition, C4.5 algorithm uses
HeartDiseaseDiagnosisUsingC4.5Algorithms-ACaseStudy
399

heuristics for pruning derived based on the statistical
significance of splits. Figure 1 presents a description
of a C4.5 algorithm.
4 EXPERIMENTAL DESIGN
In this section, the dataset used in this study is
described. Besides, a description of how the
preprocessing and the generation of decision trees
phases were carried out is provided.
Figure 1: C4.5 algorithm.
4.1 Medical Dataset Description
The dataset used in this study was collected from the
ANS unit belonging to cardiology department of
university hospital Avicenne in Morocco. This
dataset contains the records of 178 patients, each of
which have 66 features. Some of these features
provide general and administrative information
about the patient and do not affect their diagnosis
such as: name of patient, file reference, date of
consultation and the attending physician. This is
why they were discarded. Only the attributes judged
by the specialist to be necessary for the diagnosis of
patients were selected. Table 1 provides a brief
description of each attribute as well as some
statistics such as mean, max, and the min of each
selected attribute. Thereby, according to Table 1, the
patients diagnosed by ANS units are from all
generations including the children and the oldest
persons. For the VR_DB attribute, a normal value
should be near to 30%. However, we notice that the
average value is 46.23% which shows that a lot of
patients suffer from difficulties in case of breathing
efforts. The same case was noticed for VR_HG, PSR
α, CSR α, CSR β and VR_Ort attributes. In fact, a
normal value of these attributes should be near to
10% but the mean value of these attributes exceeded
Table 1: Description and statistics of selected attributes.
Input
attributes
Description Mean Min Max
Age Age of the patient 42.35 7 84
VR_DB Vagal response measured
using HR values in DB
test
46.23 4 155
VR_HG Vagal response measured
using HR values in HG
test
19.95 0 66
PSR α Peripheral sympathetic
response α measured
using BP values in HG
test
23.35 1 72
CSR α Central sympathetic
response α measured
using BP values in MS
test
17.13 2 67
CSR β Central sympathetic
response β measured
using BP values in MS
test
18.60 1 95
VR_Ort Vagal response measured
using HR values in Ort
test
21.24 1 80
HR
min
Minimum heart rate
measured in Ort test
61.51 17 104
HR
max
Maximum heart rate
measured in Ort test
70.25 38 165
BP
min
Minimum blood pressure
measured in Ort test
114.45 84 185
BP
max
Maximum blood pressure
measured in Ort test
125.94 89 193
Input:
1) Training dataset S: a set of training
observations and their associated class value.
2) Attribute list A: a set of candidate attributes.
3) Selected splitting criteria method.
Output: A decision tree.
Method:
a. Create a node Nd.
b. If all observations in the training dataset
have the same class output value C, then
return Nd as a leaf node labeled with C.
c. If attribute list is empty, then return Nd as
leaf node labeled with majority class output
value in training dataset.
d. Apply selected splitting criteria method to
training dataset in order to find the ‘‘best”
splitting criterion attribute.
e. Label node Nd with the splitting criterion
attribute.
f. Remove the splitting criterion attribute
from the attribute list.
g. For each value j in the splitting criterion
attributes.
Let Dj be the observations in training
dataset satisfying attribute value j.
If Dj is empty (no observations), then
attach a leaf node labeled with the majority
class output value to node Nd.
Else attach the node returned by
generate decision tree (Dj, attribute list,
selected splitting criteria method) to node
Nd.
h. End for.
i. Return node Nd.
HEALTHINF2015-InternationalConferenceonHealthInformatics
400

the normal value. In general, a normal HR value
should be between 60 beats/min and 80 beats/min,
and a normal value of BD should be between 100
and 140 for systolic values. However, according to
Table 1, the min and max values detected have far
exceeded the normal one for both HR and BP which
shows that there are some patients that are suffering
from serious problems that need to be treated
urgently.
4.2 Preprocessing
Data preprocessing is a very important step in a data
mining process. It is a critical step which deals with
the preparation and transformation of the initial data.
In fact, analyzing data that has not been carefully
screened can produce misleading in results. Thereby,
the quality and representation of data is first and
foremost before running an analysis (Han et al.,
2011). An initial dataset can generally gather several
problems such as: missing values, noisy data and
inconsistency (
Witten and Frank, 1999). For this
reason, several methods were developed to solve
these problems in order to improve the data quality.
These methods can be divided in (
Familia et al.
1997):
Data cleaning: Fill in missing values, smooth
noisy data, identify or remove outliers, and
resolve inconsistencies.
Data integration: Integration of multiple
databases, data cubes, or files.
Data transformation: Normalization and
aggregation.
Data reduction: reduces representation in
volume but produces the same or similar
analytical results.
4.3 Classifier Modeling
As we have explained in Section 3, a patient’s
diagnosis is based on several preliminary
conclusions of ANS’s tests. In order to provide a
decision support system for cardiologists and
automate the obtaining of preliminary conclusions, a
deep analysis was carried out to determine the input
data needed for each conclusion and identify the
predefined classes. This information was required to
apply C4.5 algorithm and generate the decision tree
that will be adopted to produce a decision support
system for cardiologist. In fact, to identify the input
attributes for this case study, we integrated the ANS
unit and attended the elaboration phase of diagnosis
and treatment. Thus, through several observations
and based on the specialists guidelines, the input
attributes were identified and used by C4.5
algorithm. Table 2 shows in details all information
extracted in order to carry out a classification with
C4.5 algorithm. Table 2 was designed by analyzing
each test separately and identifies all the necessary
attributes based on the empirical knowledge of ANS
experts. As an example, in hand grip test two
important values need to be measured: VR and PSR
α by means of formulas 1 and 2. These measures are
used to provide preliminary conclusions for this test.
In fact, the specialists analyze the VR and PSR α
values separately and take into consideration the age
as factor to be able to produce an efficient synthesis.
Thereby, two preliminary conclusions are identified
for the hand grip test, one concerning the VR value,
and the other the PSR α value. These conclusions
identify whether the VR and PSR α values
depending on the age are high, normal or low;
consequently, two decision trees were generated for
this test. For the other tests, one or more decision
trees were generated. The classes that were
identified to be used by C4.5 algorithm are high,
normal or low for all tests. As a result, eight decision
trees were generated and tested.
5 RESULTS AND DISCUSSION
In order to test the efficiency of the generated
decision trees, the data set was divided into two sets
training (123 records) and testing set (55 records).
The decision trees were generated using the training
set and validated using the testing set. In fact, C4.5
algorithm was executed under the Ubuntu
distribution of Linux operating system using a C4.5
software release 8. More details about this C4.5
software are available in the following website
1
where the download link and the instructions for use
are provided. The names, data and test files required
for the execution of C4.5 algorithm were
constructed. Then, the decision trees were generated
through several commands. 10 trials were carried
out in this experimentation. Data and test files were
changed in each trial. Figure 2 presents an example
of a generated decision tree. This latter concern the
records of HR values in the orthostatic test and
especially in supine position stage.
Table 3 presents the performance results in terms
of error rate on the training set for each ANS test.
These results were obtained by carrying out 10 trials
for each decision tree. Class distribution for the all
ANS tests was evaluated and recorded; thus, the
approximate rate of each class in the different tests
was provided as follow: 41% of the data were
HeartDiseaseDiagnosisUsingC4.5Algorithms-ACaseStudy
401
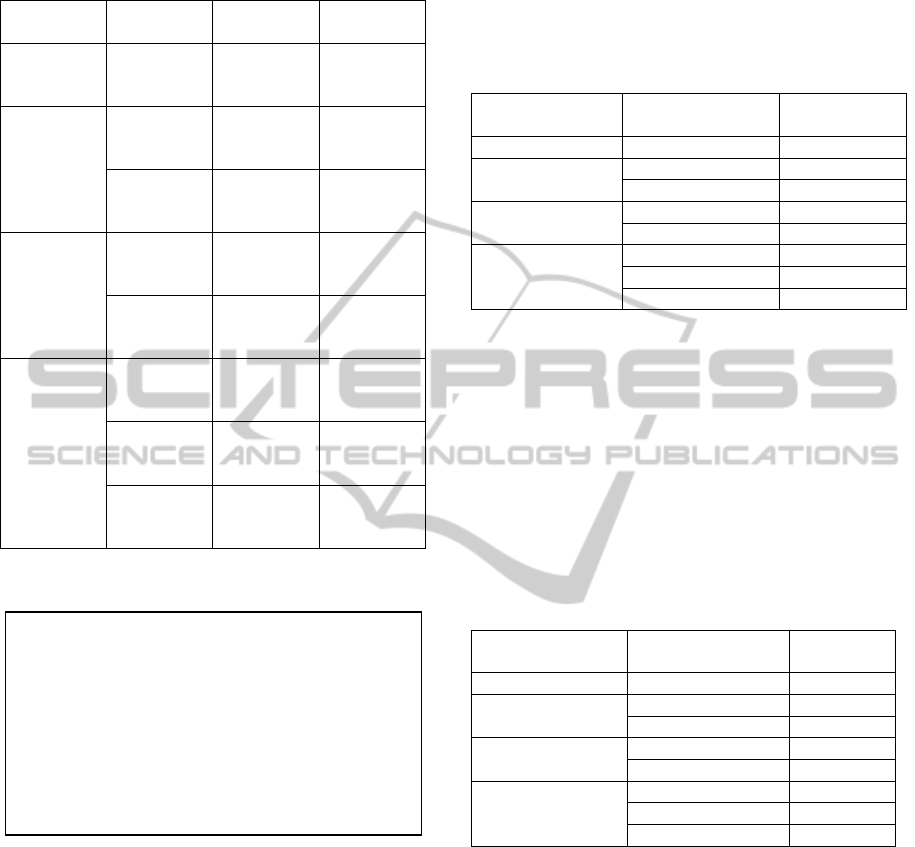
Table 2: Details about input data and classes for each ANS
tests.
ANS tests Measured
values
Input
attributes
Class
Deep
Breathing
Vagal
response
Age
VR
High
Normal
Low
Hand Grip Vagal
response
Age
VR
High
Normal
Low
PSR α Age
PSR
High
Normal
Low
Mental
stress test
CSR α Age
CSR α
High
Normal
Low
CSR β Age
CSR β
High
Normal
Low
Orthostatic
test
Vagal
response
Age
VR
High
Normal
Low
SP_FC Age
HR
min
HR
max
High
Normal
Low
SP_TA Age
BP
min
BP
max
High
Normal
Low
1
http://www2.cs.uregina.ca/~dbd/cs831/notes/ml/dtdtre/c4.5/tutori
al.html.
Figure 2: An example of a generated decision tree.
identified as high class, 31% as normal class and
28% as low class. According to these results, we can
notice that there is no a majority class and all results
were close. The values of Table 3 are the mean of
error rate values obtained in the 10 trials for each
generated decision tree. According to the results of
Table 3, the mean values of the error rate are low,
which contributes to the increase of the accuracy
rate up to 98.54%. These results may be explained
by the fact that input features required for the
construction of each decision tree did not include a
lot of input attributes. In fact, as shown in Section 4,
the number of input attributes did not exceed four
attributes which help to produce classifiers with high
accuracy rates (
Quinlan, 1993), (Han and Kamber,
2001
).
Table 3: Error rates of the generated classifiers in training
set.
ANS tests Phase Mean error
rate
Deep Breathing Vagal response 2.15%
Hand Grip Vagal response 3.99%
PSR α 0.81%
Mental stress CSR α 0.85%
CSR β 0%
Orthostatic Vagal response 0%
SP_FC 1.28%
SP_TA 2.54%
The generated decision trees were tested using
testing sets which are different of training set. The
results obtained are presented in Table 4. Table 4
shows the mean value of error rate obtained in the
10 trials for each generated decision tree. The results
obtained in the testing phase were also satisfactory
and the values of the error rates recorded were low.
Thereby, the classifiers of this study achieved high
accuracy rates up to 98.54% for training set and
97.76% for testing set respectively.
Table 4: Error rates of the generated classifiers in testing
set.
ANS tests Phase Mean error
rate
Deep Breathing Vagal response 0.38%
Hand Grip Vagal response 2.15%
PSR α 3.01%
Mental stress CSR α 0%
CSR β 1.72%
Orthostatic Vagal response 0%
SP_FC 8.96%
SP_TA 1.66%
In order to evaluate the performance of our
system, a comparison between the accuracy rates
obtained using C4.5 algorithm, K-NN and Naïve
Bayes (NB) classifiers was carried out. The K-NN
and NB classifiers were performed using the
Tanagra 1.4 software. Table 5 shows the results
obtained when applying K-NN and Naïve Bayes
classifiers on our data set. These classifiers were
applied on training and test sets. The max and min
values of accuracy rates for each classifier were
recorded. In fact, when running the predefined
classifiers, several trials were conducted for each
ANS test to identify the appropriate neighborhood
size for K-NN and the Lambda parameter for Naïve
Bayes. Thus, the best results were obtained using a
o HR
min
< 58: low
o HR
min
>= 59:
HR
max
< 81
HR
max
< 63
Age < 38: low
Age >= 38: normal
HR
max
>= 63: normal
HR
max
>= 81: High
HEALTHINF2015-InternationalConferenceonHealthInformatics
402

neighborhood size between 3 and 10, and a default
Lambda parameter equals to 1.0. According to Table
5, C4.5 have presented the best accuracy rates
comparing to K-NN and Naïve Bayes that did not
exceed 97.56% and 93.18% respectively for training
sets and 92.73% and 89.79% respectively for test
sets. These classifiers have achieved good
performance but still lower comparing to the
performance of C4.5 algorithm.
Table 5: Comparison of accuracy rates obtained using
C4.5, K-NN and Naive Bayes classifiers.
Classification
techniques
Training sets Test sets
Min
(%)
Max
(%)
Min
(%)
Max
(%)
C4.5 96.01 100 91.04 100
K-NN 95.12 97.56 83.33 92.73
Naïve Bayes 85.25 93.18 83.82 89.79
By applying C4.5 decision tree algorithm in this
study, a promising and satisfying accuracy rates
were achieved. In fact, the deep analysis of the
initial data set enabled to identify the input attributes
for each decision tree. This procedure allowed to
simplify the model generation phase and produce
decision trees achieving low error rates which
contributes to the production of accurate and
efficient preliminary conclusions.
6 CONCLUSIONS
In this paper, a case study about the application of
C4.5 decision tree algorithm was conducted using a
data set extracted from the ANS unit of university
hospital Avicenne in Morocco. The objective of this
study was to produce a decision support system to
automate the analysis procedure of the ANS's test
results and make it easier for specialists. Thereby, as
a first step, C4.5 algorithm was used to generate a
set of classifiers that enable to generate the
preliminary conclusions needed to produce the
appropriate diagnosis. The classifiers were evaluated
and the results obtained achieved high accuracy rates
which were very promising. However, as a
limitation of this study, we may mention the small
size of the data set used. Thus, more validation tests
over bigger data sets should be conducted.
As mentioned in Section 3, The ANS unit is
specialized on conducting the ANS tests in order to
analyze the preliminary conclusions deducted from
the classifiers. These conclusions are analyzed by
the specialists to provide a global synthesis,
diagnosis of the patient’s state and prescribe the
appropriate treatment. In this study, we worked on
the first phase of the procedure and using the C4.5
algorithm, we were able to define a set of rules
helping to generate the preliminary conclusions. For
future work, a validation of the generated classifiers
by cardiologists on new patients needs to be carried
out. Besides, classification and association
techniques will be used to produce a complete
decision support system that provide a diagnosis for
patients and suggest the appropriate treatment.
REFERENCES
Aparna, R.. Bincy, G., Mathu, T., 2012. Survey on
common data mining classification Technique. In
International Journal of Wisdom Based Computing, 2.
Apté, C., Weiss, S., 1997. Data mining with decision trees
and decision rules. In Future Generation Computer
Systems.
Benarroch, E., 1993. The central autonomic network:
Functional organization, dysfunction and perspective.
In Mayo Clinic Proceedings.
Breiman, L., Friedman, J., Olshen, R. A., Stone, C. J.
(1984). Classification and regression trees, Chapman
and Hall/CRC, 1
st
edition.
Coghlan, H. C., 1996. Orthostatic intolerance: mitral valve
prolapse. In Primer on the Autonomic Nervous System,
D. Robertson, P. A. Low, and J. Polinsky, Eds.,
Academic Press, San Diego, Calif, USA.
Esfandiari, N., Babavalian, M. R., Moghadam, A. E.,
Tabar, V. 2014. Knowledge discovery in medicine:
Current issue and future trend. In Expert Systems with
Applications.
Familia, A., Shenb, W. M., Weberc, R., Simoudis, E.,
(1997). Data preprocessing and intelligent data
analysis. In Intelligent Data Analysis.
Grubb, B. P., Karas, B., 1999. Clinical Disorders of the
Autonomic Nervous System Associated With
Orthostatic Intolerance: An Overview of
Classification, Clinical Evaluation and Management.
In Pacing and Clinical Electrophysiology.
Han, J., Kamber, M. 2001. Data Mining, Concepts and
Techniques, Morgan Kaufmann publisher.
Han, J., Kamber, M., Pei, P., 2011. Data preprocessing. In
The Morgan Kaufmann Series in “Data Management
Systems”, Morgan Kaufmann Publishers.
Johansen, T. L., Kambskar, G., Mehlsen, J., 1997. Heart
rate variability in evaluation of the autonomic nervous
system. In Ugeskr Laeger.
Karaolis, M. A., Moutiris, J. A., Hadjipanayi, D., Pattichis,
C. S., 2010. Assessment of the Risk Factors of
Coronary Heart Events Based on Data Mining With
Decision Trees. In IEEE Transactions on Information
Technology in Biomedicine.
Kreibig, S. D., 2010. Autonomic nervous system activity
in emotion: A review. In Biological Psychology.
HeartDiseaseDiagnosisUsingC4.5Algorithms-ACaseStudy
403

Kumari, M., Godara, S., 2011. Review of Data Mining
Classification Models in Cardiovascular Disease
Diagnosis. In Proceedings published in International
Journal of Computer Applications.
Langley J. N., 1921. The Autonomic Nervous System.,
Cambridge Heffer.
Low P. A., 1997. Laboratory evaluation of autonomic
function. In Clinical Autonomic Disorders. Evaluation
and Managment.
Mašetić, Z., Subasi, A. 2013. Detection of congestive
heart failures using C4.5 Decision Tree. In Southeast
Europe Journal of Soft Computing.
Mejía-Rodríguez, A. R., Gaitán-González, M. J.,
Carrasco-Sosa, J., Guillén-Mandujano, A., 2009. Time
Varying Heart Rate Variability Analysis of Active
Orthostatic and Cold Face Tests Applied Both
Independently and Simultaneously. In Computers in
Cardiology.
Pavlopoulos, S. A., Stasis, A. C., Loukis, E. N., 2004. A
decision treebased method for the differential
diagnosis of aortic stenosis from mitral regurgitation
using heart sounds. In Biomed. Eng. OnLine.
Quinlan, J. R. 1979. Discovering rules by induction from
large collections of examples. In Expert systems in the
micro electronic age. Edinburgh University Press.
Quinlan, J. R. 1993. C4.5 Programs for Machine
Learning, Morgan Kaufmann publisher.
Quinlan, J. R. 1996. Improved use of continuous attributes
in C4.5. In Journal of Artificial Intelligence Research.
Shields R. W., 2009. Heart rate variability with deep
breathing as a clinical test of cardiovagal function. In
Cleveland Clinic Journal of Medicine.
Witten, H. I., Frank, E. 1999. Data Mining: Practical
Machine Learning Tools and Techniques with Java
Implementations, Morgan Kaufmann publisher. 1
st
edition.
Witten, H. I., Frank, E. 2005. Data Mining: Practical
machine learning tools and techniques, Morgan
Kaufmann publisher. 2
nd
edition.
Zheng, Y., Peng, L., Lei, L., Junjie, Y., 2005. R-C4.5
Decision tree model and its applications to health care
dataset. In Proc of International Conference on
Services Systems and Services Management.
HEALTHINF2015-InternationalConferenceonHealthInformatics
404
