
Optical Imaging for Diagnosis of Rheumatoid Arthritis
Automatic Versus Human Evaluation
Pouyan Mohajerani
1
, Reinhard Meier
2
, Ernst J. Rummeny
2
and Vasilis Ntziachristos
1
1
Institute for Biological and Medical Imaging, Technische Universität München and Helmholtz Zentrum München,
Ingolstädter Landstrasse 1, Neuherberg 85764, Germany
2
Department of Radiology, Klinikum Rechts der Isar, Technische Universität München, München, Germany
Keywords: Optical Imaging, Fluorescence, Rheumatoid Arthritis (RA), Inflammation, Indocynine Green (ICG), Planar
Illumination, Near-Infrared Dyes, Spatiotemporal Analysis, Principal Component Analysis (PCA).
Abstract: Successful detection of rheumatoid arthritis (RA) at the early stages of development can significantly
enhance the chances of effective therapy. The early onset of RA is often marked with inflammation of the
synovial lining of the joint, a condition known as synovitis. Effective imaging of synovitis is therefore of
critical importance. While dynamic, contrast-enhanced magnetic resonance imaging (MRI) is capable of
effective imaging of synovitis, it is a costly modality. As an alternative, inexpensive approach, optical
imaging post injection of the near-infrared fluorescent dye indocynine green (ICG) has been recently
proposed for imaging RA. Evaluation of the obtained optical images is performed via examination by
trained human readers. However, optical imaging has yet to achieve the diagnostic accuracy of MRI. In this
paper we present a method for automatic evaluation of the fluorescence images and compare its
performance with the human-based evaluation. Our method relies on our previous work on spatiotemporal
analysis of image sequence with principal component analysis (PCA) to seek synovitis signal components
with the help of a segmentation method. The results for a group of 600 joints, obtained from 20 patients,
suggest improved diagnostic performance using the automatic approach in comparison to human-based
evaluation.
1 INTRODUCTION
Imaging can play a critical role in developing
effectively and timely therapeutic approaches for
treating rheumatoid arthritis (RA) by the way of
early detection of synovitis (Emery and Quinn,
2003, Ostergaard et al., 2005). Synovitis is the
condition of the inflammation of the synovial lining
surrounding the joint and marks the onset of RA.
Conventionally, X-ray computed tomography (CT)
has been employed to image bone and joint damage
resulting from joint inflammation (Backhaus et al.,
1999). In this sense CT is often applicable in the
later stages of RA development. Other anatomical
modalities, particularly magnetic resonance imaging
(MRI) in conjunction with MR contrast agents and
ultrasound have been employed for early detection
of RA (Emery et al., 2007). Nevertheless, such
methods are often limited by factors such as operator
dependency for ultrasound (Delle Sedie et al., 2008)
and high costs for the MRI, (Emery et al., 2007)).
As an alternative, cost-effective approach,
optical imaging (OI) has been proposed for imaging
RA (Chen et al., 2005, Hielscher et al., 2004, Fischer
et al., 2010, Mohajerani et al., 2013, Mohajerani et
al., 2014, Meier et al., 2012, Gompels et al., 2010).
Several planar and tomographic approaches have
been proposed, relying on the physiological changes
in joint tissue as a source of optical contrast
(Hielscher et al., 2011, Klose et al., 1999).
The application of fluorescence has been also
recently proposed for imaging RA in both planar
(Meier et al., 2012, Werner et al., 2012) and
tomographic (Mohajerani et al., 2014) modes. These
approaches use the organic, near-infrared
fluorescence dye indocynine green (ICG) to create
optical contrast in affected tissue. Specifically, the
intravenously injected ICG tends to accumulate in
inflamed synovial tissue, a feature which enables
differentiation of the inflamed joints from healthy
joints using measured fluorescence signals. In
particular, planar imaging operating in epi-
illumination mode offers the ability to image all
hand joints in both hands simultaneously (Meier et
al., 2012, Meier et al., 2014, Werner et al., 2012).
36
Mohajerani P., Meier R., Rummeny E. and Ntziachristos V..
Optical Imaging for Diagnosis of Rheumatoid Arthritis - Automatic Versus Human Evaluation.
DOI: 10.5220/0005217200360043
In Proceedings of the International Conference on Bioimaging (BIOIMAGING-2015), pages 36-43
ISBN: 978-989-758-072-7
Copyright
c
2015 SCITEPRESS (Science and Technology Publications, Lda.)
The acquired fluorescence images are examined
by a trained human reader, who assigns semi-
quantitative inflammation scores to different joints
upon examining the entire acquired image sequence.
An example an acquired fluorescence image in
comparison to the corresponding MRI scan is
presented in Figure 1.
Planar, ICG-enhanced imaging of RA is a
promising approach which has been applied for both
diagnostic (Thomas Dziekan et al., 2011, Meier et
al., 2012) as well as therapy monitoring purposes
(Meier et al., 2014). While offering a cost-effective
and rapid imaging alternative, the diagnostic
accuracy of the method is compromised, in
particular in comparison with contrast-enhanced
MRI, which serves as the gold standard in evaluation
studies (Meier et al., 2012).
One reason for the relatively (compared to MRI)
low diagnostic accuracy of OI, is the presence of
strong signal interference (Meier et al., 2012).
Specifically, the fluorescence signal emanating from
the underlying synovitis is strongly coupled to other
signals originating from the dorsal veins as well as
other tissues. This interference occurs in both spatial
and temporal dimensions and complicates the
inference process as performed by a human reader.
We have previously reported a spatiotemporal
analysis approach for decoupling the signal
components in the acquired image sequence using
principal component analysis (PCA) (Mohajerani et
al., 2013).
In this paper, we present automatic detection of
the synovitis, as an alternative to the human-based
detection. We further evaluate and compare the
automatic detection method with the human-based
detection for a cohort consisting of 20 patients.
2 IMAGING METHODOLOGY
Fluorescence imaging was performed with a planar,
near-infrared fluorescence imaging system (Xiralite
X4, Mivenion GmbH, Berlin, Germany. This system
enables real-time image acquisition at the
fluorescence wavelength of ICG (around 830 nm)
simultaneously from both of the hands after epi-
illumination excitation applied to the dorsal hand
sides. The patients received a bolus injection pf ICG
at a dosage of 0.1 mg per kg body weight. A total of
360 images were obtained at the fluorescence
wavelength of ICG, with a frame rate of 1 fps.
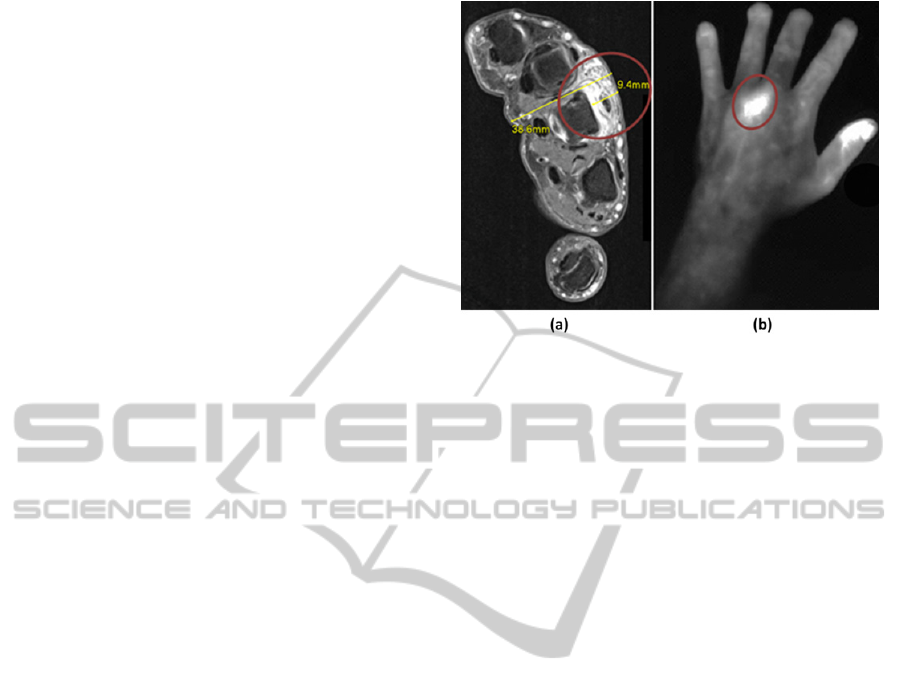
Figure 1: Optical imaging of rheumatoid arthritis shown in
the left panel for the left hand of a 42 year old male
patient. This patient exhibited severe arthritis in the 3rd
metacarpophalangeal (MCP) joint. The right panel depicts
the corresponding transversal slice of the T1-weighted fat-
saturated contrast-enhanced MRI image in the MCP
region. The higher accumulation of the contrast agents in
the MCP 3 joint have resulted in higher signal intensities
in both MRI and optical images.
3 SPATIOTEMPORAL ANALYSIS
Non-specific fluorescence signal interfering with the
target fluorescence emanating from synovitis
complicated the diagnosis. The interference takes
place both in the intra-frame domain (spatial
interference) as well as in the inter-frame domain
(temporal interference). Decoupling such signal
components in both spatial and temporal domains
might therefore help with more accurate diagnosis.
We have recently presented spatiotemporal
analysis for decomposing the signal components in
the fluorescence image sequences (Mohajerani et al.,
2013). This method makes use of the principal
component analysis (PCA) (Jolliffe, 2002), as an
orthogonal de-correlating transformation, to covert
the original sequence into a group of sequences,
each bearing distinct spatiotemporal components.
Herein we briefly review this approach.
Specifically, consider a set of fluorescence
images I
p
for p = 1 … P, where each image has a
size of M
1
× M
2
pixel size (P was equal to 360).
Prior to the PCA analysis, two levels of localization
were performed on the raw image sequence I
p
. The
first step limits the processing to a specific region
within each image, achieved via a region of interest
defined accordingly for each of the joints, as shown
in Figure 2. The second localization step confines he
PCA processing to windowed subsequence of the
OpticalImagingforDiagnosisofRheumatoidArthritis-AutomaticVersusHumanEvaluation
37
Figure 2: The proposed methodology of automatic detection of rheumatoid arthritis (a) partitioning the fluorescence image
into 7 regions for the carpus, MCP region and each of the fingers. (b) PCA-based processing and segmentation-based
detection within each ROI (here, the carpus ROI). The results of the PCA processing are to then fed to the segmentation
approach. The metric values assigned by the segmentation method to different signal components are then classified to
achieve diagnostic information regarding each joint.
images within each ROI. These two localization
steps were performed to improve the performance of
PCA in decoupling image components, as the signal
dynamics change significantly across time and
space. For each of the 7 ROIs shown, a 2-D
subsequence of images J
p
is defined from the
original sequence. Next, K successive images were
taken from the subsequence J
p
. This subsequence is
defined as H
i
, i = 1 to K. The PCA was then applied
to this image sequence by first vectorising and
stacking the images H
i
, to achieve a K × M
1
M
2
matrix X
. Next, singular value decomposition
(SVD) of the covariance matrix of X was obtained.
and the resulting unitary matrix of its eigenvectors
was applied as the PCA transformation matrix. The
3 components with the largest singular values were
then retained and the rest of modes were discarded.
These 3 retained components were then mapped to
the blue, red and green channels of an output color
sequence, according to their descending singular
values. Further details of the PCA processing can be
found in (Mohajerani et al., 2013). A summary of
the steps involved can be further seen in figure 2.
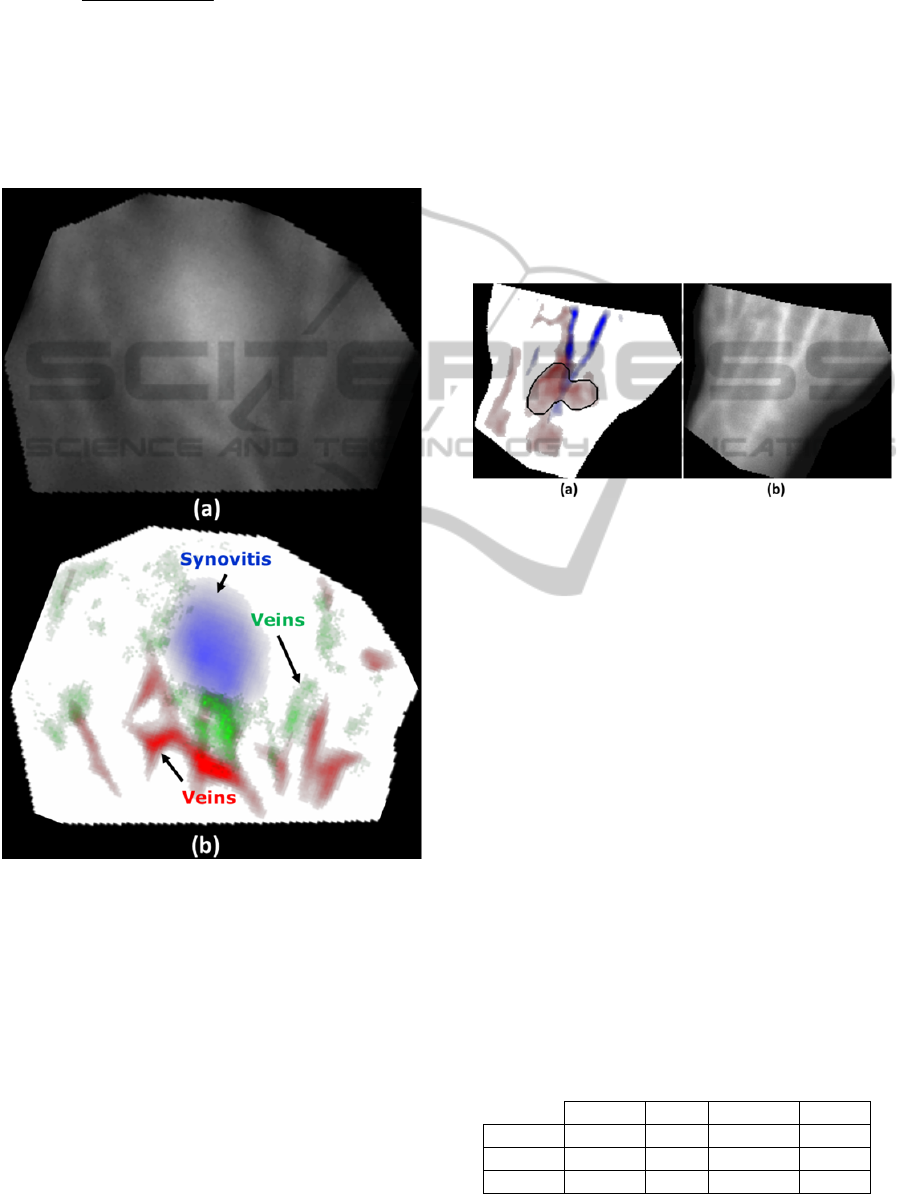
The results of the spatiotemporal analysis for a
specific joint of patient suffering severe
inflammation in the 3
rd
MCP joint are presented in
figure 3. As observed, the PCA-based method has
successfully separated the synovitis signal from the
background and vein signals into distinct PCA
channels.
4 AUTOMATIC DETECTION OF
RHEUMATOID ARTHRITIS
As previously noted, the synovitis signal is often
coupled in time and space to interfering signals
emanating from background tissue or dorsal veins.
However, the synovitis signal is likely to appear as a
distinct component in one of the PCA channels.
Here, we propose automatic detection of
synovitis by searching through the PCA channels for
a signal component attributable to synovitis. To this
end, we use a segmentation approach previously
proposed in (Mohajerani et al., 2013).
Specifically, for a specific joint, first an elliptical
ROI is defined surrounding this joint. This ROI is
denoted by the binary image R. The segmentation
approach then applies a threshold to each PCA
image. The thresholding results in a binary image J.
Within the image J, the connected component with
the largest overlap with R is found and denoted by
K. A metric is defined then to quantify the likelihood
of the signal in the region K to be due to synovitis.
Specifically, S(K,R) is defined as
BIOIMAGING2015-InternationalConferenceonBioimaging
38
()
(,) 3
max ( , ),
1max ,(,),1 () ,
SKR
dKR r
JKR EK
r
=×
−−
(1)
where J(K, R) and d(K, R) denote respectively the
Jaccard (Michael Levandowsky and Winter, 1971)
and Hausdorff (Huttenlocher et al., 1993) distances
between K and R and E(K) is the energy of the
image I within the label in K (Mohajerani et al.,
2013).
Figure 3: An example of the PCA-based spatiotemporal
processing applied to the MCP-region of a patient with
severe synovitis in the MCP 3 joint of the right hand. (a)
Shows the measured raw fluorescence image, where the
synovitis signal is coupled with background and dorsal
vein signals. (b) The decomposed image obtained using
the PCA-based approach, where the synovitis signal is
mapped to the blue channel and is clearly distinct from the
vein signals mapped to the green and red channels.
The metric S(K,R) has a value between 0 and 3,
where a higher value denotes a higher likelihood that
the contours of K delineate the synovitis signal in the
corresponding PCA channel.
The automatic detection of the synovitis then
operates as follows. All PCA images for all the blue,
red and green channels are then processed with the
segmentation method presented and the
corresponding metric values are found. The
component K with the highest value of S(K,R) across
all channels in then designated as the synovitis
signal. A summary of this approach is presented in
figure 2. Figure 4 shows the results of the automatic
detection method for a specific case of a patient with
moderate synovitis in the left carpus. In this specific
case, the component with the highest metric value
appeared in the red channels, as shown by the black
contour in figure 4(b).
Figure 4: Case study of the automatic detection method
proposed herein for the left carpus joint of a 49 year old
female patient with moderate synovitis. (a) The blue and
red PCA components for the carpus ROI, where the black
contours denotes the detected synovitis signal in the red
channel. The vein signal was mapped to the blue channel
and there was no conspicuous signal in the green channel.
(b) The corresponding raw fluorescence image. The scores
assigned by the 4 human readers to this joint consisted of
0, 0, 0 and 1.
5 CLINICAL EXAMINATION
AND COHORT INFORMATION
The development presented and performed in this
paper have been conducted in the context of a recent
study carried out at the Klinikum rechts der Isar,
Munich, Germany, which aimed at of evaluating the
diagnostic performance of ICG-aided imaging of RA
(Meier et al., 2012).
The automatic detection method proposed herein
was applied to fluorescence image sequences
Table 1: Distribution of inflammation severity among the
600 hand joints of the 20 patients recruited in this study.
Healthy Mild Moderate Severe
Carpus 16 16 5 3
MCP 93 90 16 1
PIP/DIP 326 28 5 1
OpticalImagingforDiagnosisofRheumatoidArthritis-AutomaticVersusHumanEvaluation
39
obtained from a group of 20 patients (14 females, 6
males, aged 41±16). The patients were examined
and imaged with contrast-enhanced MRI using a 3T
MR machine (Verio, Siemens Erlangen, Germany)
and a protocol described in (Meier et al., 2012). MR-
based synovitis scores of 0 to 3 (healthy to severe)
were assigned to each of the 600 joints.
Three radiologists scored the degree of
inflammation in a total of 30 joints of both hands
using the MR scans. Synovitis scores on a 4-point-
ordinate scale (0: no inflammation, 1: mild, 2:
moderate, 3: severe) were assigned to each joint
according to the semi-quantitative assessment
system suggested by the OMERACT MRI group
(Ostergaard et al., 2003). The MR scores constitute
the true diagnostic information, as explained in the
next section.
Similarly, the fluorescence images were scores
by the 3 radiologists, with a repeated 4
th
scoring
performed after 4 weeks, as explained in (Meier et
al., 2012). As such, 4 scores between 0 and 3, are
obtained for each of the 30 hand joints for each
patient. These scores are then used to evaluate
human-based evaluation of the optical images, in
comparison to the proposed, automatic method. The
distributions of synovitis severity within different
joint groups (interphalangeal, metacarpophalangeal
and carpal) are shown in Table 1, according to the
examination results of the MR scans.
6 EVALUATION METHODOLOGY
The localization metric devised in Section 4 yields a
value between 0 and 100 (with 100 designating
highly likelihood of being an inflammation signal) to
each signal component. A threshold can be applied
to this localization metric toward making a decision
about synovitis severity of a given joint. The results
can be demonstrated using the so-called receiver
operating characteristic (ROC) curves, denoting as
sensitivity vs specificity.
ROC curves denote the classification
performance of a binary classifier (Zou et al., 2007).
It should be noted that the x = y on the ROC plane
corresponds to random classification. Therefore, any
curve above this line is desirable. The optimal
performance corresponds to the upper-left corner
(sensitivity = specificity = 100%). One way to
compare different ROC curves is to compare the
area under curve (AUC). The AUC is a measure of a
classifier’s quality (Fawcett, 2006). The optimal
classifier has an AUC of 1.
To achieve a binary classifier, we consider two
modes of classification. In classification 1, the
threshold is applied to the segmentation metric to
make a decision between healthy and affected (mild,
moderate or severe synovitis) joints. In classification
II, a decision was made between joints with “no or
mild synovitis” and joints with “moderate or severe
synovitis”.
Three diagnosis methods are examined and
evaluated in this work:
• Method A: Human evaluation of raw images
• Method B: Automatic evaluation of raw images
• Method C: Automatic evaluation of PCA images
Method A is the conventional method used
currently in the clinic (Meier et al., 2012). Method C
constitutes the proposed method. We have already
shown using a cohort of 15 patients that the method
C outperforms method B (Mohajerani et al., 2013).
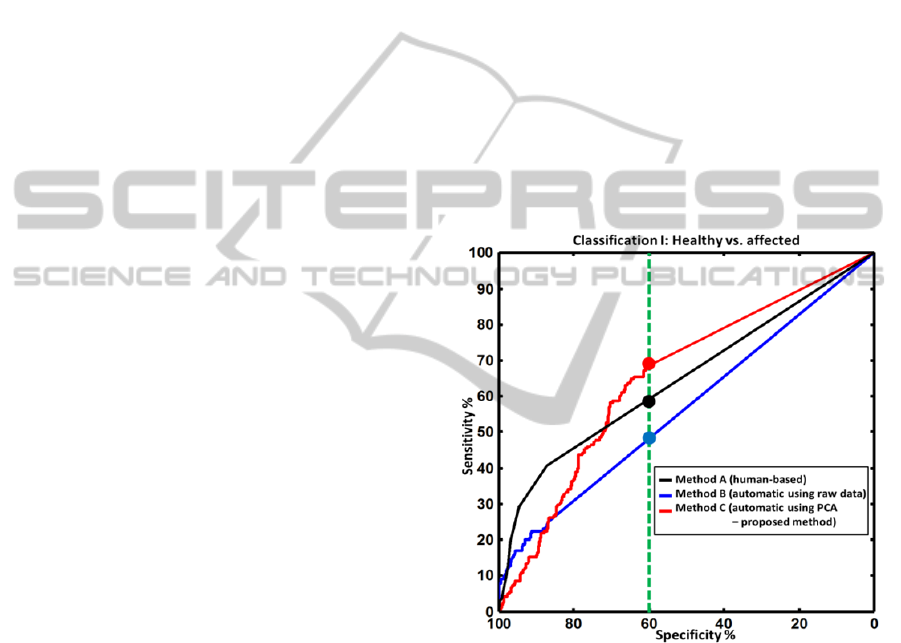
Figure 5: Receiver operator characteristic (ROC) curves
for classification I: healthy joints versus affected joints
(mild, moderate or severe synovitis). The ROC curves are
shown using three methods: segmentation of the raw
images (blue curve), segmentation of the PCA components
(red curve, the proposed method) and the human-based
evaluation (black curve). The green, dotted vertical line
denotes a detection specificity of 60%. For this value, the
proposed approach outperforms the human evaluation by
achieving a sensitivity of more than 70% (human
evaluation had a sensitivity of around 55%). For higher
values of specificity (more than 70%), all methods showed
poor sensitivity of less than 50%.
In this paper, we examine the performance of the
proposed method (method C), in comparison with
the human-based read (method A), for the first time.
BIOIMAGING2015-InternationalConferenceonBioimaging
40
The results are presented in the next section. For
method A, the synovitis score was taken as the
medium of the 4 scores obtained by the 4 readers (as
explained in Section 2). For methods B and C, the
synovitis score was the metric S, shown in Eq. 1.
7 DIAGNOSTIC PERFORMANCE
RESUTLS
Figure 5 shows the ROC curves for classification I,
as defined in the previous section. The proposed
method (method C, red curve) showed slightly better
performance than the other two methods for the
specificity value of 60% (marked with filled circles).
Over all, both automatic and human-based detection
had an equal performance in terms of the AUC
values, as shown in Table 2.
Table 2: Area under curve (AUC) values for the three
detection methods for classification I (healthy vs. affected)
and for classification II (healthy or mild synovitis vs.
moderate or severe synovitis).
Method A Method B Method C
Classification I 0.65 0.57 0.65
Classification II 0.77 0.73 0.82
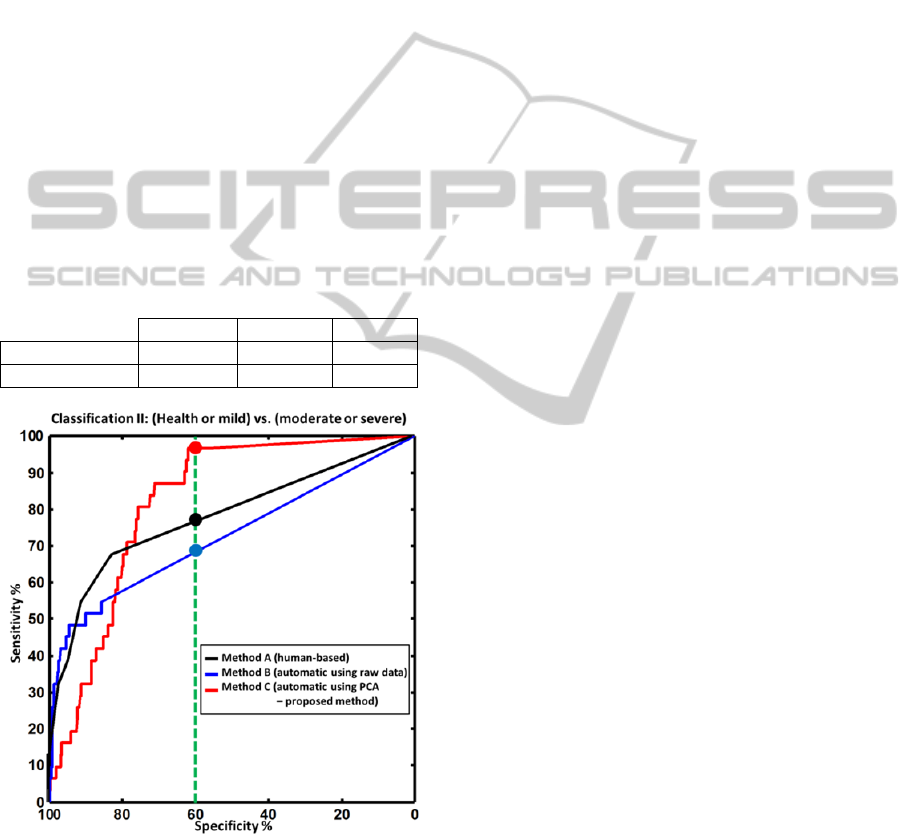
Figure 6: ROC curves for classification II: (healthy joint
or mild synovitis) versus (moderate or severe synovitis),
presented similar to the results presented for classification
I in Figure 5. The green, dotted vertical line denotes a
detection specificity of 60%. For this value, the proposed
approach outperforms the human evaluation by achieving
a sensitivity of more than 95% (human evaluation had a
sensitivity of around 75%).
Figure 6 presents similar results for classification
II. In this case, all methods perform better than the
corresponding curves in classification I. This is
justified as the signal difference between moderate
synovitis and healthy or mild synovitis is generally
larger than between healthy and mild synovitis. The
proposed method C in this case has a markedly
better performance than human reading. This
improved performance can be seen examining the
sensitivity values for a medium specificity value of
60% (as marked with filled circles on figure 6) or
examining the AUC values, presented in Table 2.
8 DISCUSSION AND
CONCLUSION
In this paper we presented automatic detection and
characterization of synovitis in human hand joints
using fluorescence images obtained in epi-
illumination geometry post intravenous injection of
ICG. The proposed method scores the principal
components obtained from spatiotemporal analysis
of the raw image sequences. The scores are then
used to classify the synovitis in a binary fashion.
Two classification modes were examined:
classification I (differentiating between healthy and
affected joints) and classification II (differentiating
between healthy or mild synovitis vs. moderate or
severe synovitis). The automatic evaluation of
fluorescence images was compared with the current
methodology of human-based evaluation of images
for both classification scenarios using ROC curves,
as shown in Figures 5 and 6. The comparison of the
proposed method with human-based reading was
performed for a cohort consisting of 20 patients.
For classification I, as can be seen in Figure 5,
all three methods A, B, and C have relatively low
sensitivity. The reason is that in classification I we
differentiate between healthy and affected joints.
Around 22% (according to Table 2) of all joints have
mild arthritis. However, mild joints exhibit only very
low signal contrast relative to the healthy joints. This
issue lowers the sensitivity of all methods. However,
the proposed method has better sensitivity than the
human detection for medium specificity levels. For
classification II, however, the proposed method
outperformed human detection in both sensitivity
and AUC terms.
It should be noted that for both classification I
and II, the methods A and B have higher sensitivity
than the proposed method, for very high specificity
values (> ~80%), as seen in Figures 5 and 6.
However, these higher sensitivity values are
OpticalImagingforDiagnosisofRheumatoidArthritis-AutomaticVersusHumanEvaluation
41

generally lower than 50%, which translate to a high
count of missed positives for the respective
threshold values.
The results generally show improved or
comparable diagnostic performance achieved using
the proposed, automatic method in comparison to
the human-based evaluation. It is foreseeable that
better and more intelligent classification methods
making use of all signal properties (and not just the
extracted segmentation metric S) could lead to
definitively better performance than human reading.
Such improved detection can not only lead to better
detection but can also improve the therapy
monitoring utility of optical imaging by reducing
operator dependency. Such improved classification
is being currently researched. Furthermore, semi-
quantitative scoring of synovitis using optical
images as well as further development of the
proposed method in conjunction with larger cohorts
are subjects of ongoing work.
REFERENCES
Backhaus, M., Kamradt, T., Sandrock, D., Loreck, D.,
Fritz, J., Wolf, K. J., Raber, H., Hamm, B., Burmester,
G. R. & Bollow, M. 1999. Arthritis Of The Finger
Joints: A Comprehensive Approach Comparing
Conventional Radiography, Scintigraphy, Ultrasound,
And Contrast-Enhanced Magnetic Resonance
Imaging. Arthritis Rheum, 42, 1232-45.
Chen, W. T., Mahmood, U., Weissleder, R. & Tung, C. H.
2005. Arthritis Imaging Using A Near-Infrared
Fluorescence Folate-Targeted Probe. Arthritis
Research & Therapy, 7, R310-R317.
Delle Sedie, A., Riente, L. & Bombardieri, S. 2008. Limits
And Perspectives Of Ultrasound In The Diagnosis
And Management Of Rheumatic Diseases. Modern
Rheumatology, 18, 125-131.
Emery, P. & Quinn, M. A. 2003. Window Of Opportunity
In Early Rheumatoid Arthritis: Possibility Of Altering
The Disease Process With Early Intervention. Clinical
And Experimental Rheumatology, 21, S154-S157.
Emery, P., Wakefield, R. J., O'connor, P. J., Conaghan, P.
G., Mcgonagle, D., Hensor, E. M. A., Gibbon, W. W.
& Brown, C. 2007. Finger Tendon Disease In
Untreated Early Rheumatoid Arthritis: A Comparison
Of Ultrasound And Magnetic Resonance Imaging.
Arthritis & Rheumatism-Arthritis Care & Research,
57, 1158-1164.
Fawcett, T. 2006. An Introduction To Roc Analysis.
Pattern Recognition Letters, 27, 861–874.
Fischer, T., Ebert, B., Voigt, J., Macdonald, R., Schneider,
U., Thomas, A., Hamm, B. & Hermann, K. G. 2010.
Detection Of Rheumatoid Arthritis Using Non-
Specific Contrast Enhanced Fluorescence Imaging.
Acad Radiol, 17, 375-81.
Gompels, L. L., Lim, N. H., Vincent, T. & Paleolog, E. M.
2010. In Vivo Optical Imaging In Arthritis--An
Enlightening Future? Rheumatology (Oxford), 49,
1436-46.
Hielscher, A. H., Kim, H. K., Montejo, L. D., Blaschke,
S., Netz, U. J., Zwaka, P. A., Illing, G., Muller, G. A.
& Beuthan, J. 2011. Frequency-Domain Optical
Tomographic Imaging Of Arthritic Finger Joints. Ieee
Trans Med Imaging, 30, 1725-36.
Hielscher, A. H., Klose, A. D., Scheel, A. K., Moa-
Anderson, B., Backhaus, M., Netz, U. & Beuthan, J.
2004. Sagittal Laser Optical Tomography For Imaging
Of Rheumatoid Finger Joints. Physics In Medicine
And Biology, 49, 1147-1163.
Huttenlocher, D. P., Klanderman, G. A. & Rucklidge, W.
J. 1993. Comparing Images Using The Hausdorff
Distance. Ieee Transactions On Pattern Analysis And
Machine Intelligence, 15, 850-863.
Jolliffe, I. T. 2002. Principal Component Analysis,
Springer.
Klose, A. D., Hielscher, A. H., Hanson, K. M. & Beuthan,
J. 1999. Two- And Three-Dimensional Optical
Tomography Of Finger Joints For Diagnostics Of
Rheumatoid Arthritis. Proceedings Of Spie, 3566,
151-160.
Meier, R., Thuermel, K., Moog, P., Noel, P., Ahari, C.,
Sievert, M., Dorn, F., Waldt, S., Schaeffeler, C.,
Werner, S., Golovko, D., Haller, B., Ganter, C.,
Weckbach, S., Woertler, K. & Rummeny, E. J. 2012.
Detection Of Arthritis In The Hands Of Patients With
Rheumatological Disorders: Diagnostic Performance
Of Optical Imaging In Comparison To Magnetic
Resonance Imaging. Arthritis & Rheumatism, 64,
2489-98.
Meier, R., Thuermel, K., Noël, P. B., Moog, P., Sievert,
M., Ahari, C., Nasirudin, R. A., Golovko, D., Haller,
B., Ganter, C., Wildgruber, M., Schaeffeler, C., Waldt,
S. & Rummeny, E. J. 2014. Synovitis In Patients With
Early Inflammatory Arthritis Monitored With
Quantitative Analysis Of Dynamic Contrast-Enhanced
Optical Imaging And Mr Imaging. Radiology, 270,
176-185.
Michael Levandowsky & Winter, D. 1971. Distances
Between Sets. Nature, 234, 34-35.
Mohajerani, P., Koch, M., Thürmel, K., Haller, B.,
Rummeny, E. J., Ntziachristos, V. & Meier, R. 2014.
Fluorescence-Aided Tomographic Imaging Of
Synovitis In The Human Finger. Radiology.
Mohajerani, P., Meier, R., Noël, P. B., Rummeny, E. J. &
Ntziachristos, V. 2013. Spatiotemporal Analysis For
Indocyanine Green-Aided Imaging Of Rheumatoid
Arthritis In Hand Joints. Journal Of Biomedical
Optics, 18, 097004-097004.
Ostergaard, M., Ejbjerg, B. & Szkudlarek, M. 2005.
Imaging In Early Rheumatoid Arthritis: Roles Of
Magnetic Resonance Imaging, Ultrasonography,
Conventional Radiography And Computed
Tomography. Best Practice & Research In Clinical
Rheumatology, 19, 91-116.
BIOIMAGING2015-InternationalConferenceonBioimaging
42

Ostergaard, M., Peterfy, C., Conaghan, P., Mcqueen, F.,
Bird, P., Ejbjerg, B., Shnier, R., O'connor, P.,
Klarlund, M., Emery, P., Genant, H., Lassere, M. &
Edmonds, J. 2003. Omeract Rheumatoid Arthritis
Magnetic Resonance Imaging Studies. Core Set Of
Mri Acquisitions, Joint Pathology Definitions, And
The Omeract Ra-Mri Scoring System. Journal Of
Rheumatology, 30, 1385-1386.
Thomas Dziekan, Carmen Weissbach, Jan Voigt, Bernd
Ebert, Rainer Macdonald, Malte L. Bahner, Marianne
Mahler, Michael Schirner, Michael Berliner, Birgitt
Berliner, Jens Osel & Osel, I. 2011. Detection Of
Rheumatoid Arthritis By Evaluation Of Normalized
Variances Of Fluorescence Time Correlation
Functions. Journal Of Biomedical Optics 16, 076015
Werner, S. G., Langer, H. E., Ohrndorf, S., Bahner, M.,
Schott, P., Schwenke, C., Schirner, M., Bastian, H.,
Lind-Albrecht, G., Kurtz, B., Burmester, G. R. &
Backhaus, M. 2012. Inflammation Assessment In
Patients With Arthritis Using A Novel In Vivo
Fluorescence Optical Imaging Technology. Annals Of
The Rheumatic Diseases, 71, 504-510.
Zou, K. H., O'malley, A. J. & Mauri, L. 2007. Receiver-
Operating Characteristic Analysis For Evaluating
Diagnostic Tests And Predictive Models. Circulation,
115, 654-7.
OpticalImagingforDiagnosisofRheumatoidArthritis-AutomaticVersusHumanEvaluation
43
