
The Symmetry of Oligonucleotide Distance Distributions in the
Human Genome
Ana Helena Tavares
1
, Vera Afreixo
1,2
, João M. O. S. Rodrigues
3,4
and Carlos A. C. Bastos
3,4
1
Department of Mathematic, University of Aveiro, 3810-193, Aveiro, Portugal
2
Center for Research and Development in Mathematics and Applications (CIDMA), Aveiro, Portugal
3
Department of Electronics Telecommunications and Informatics, University of Aveiro, 3810-193, Aveiro, Portugal
4
Institute of Electronics and Telematics Engineering of Aveiro (IEETA), Aveiro, Portugal
Keywords: Chargaff’s Second Parity Rule, Single Strand Symmetry, Oligonucleotide Distance Distribution, Human
Genome.
Abstract: The inter-oligonucleotide distance is defined as the distance to the next occurrence of the same
oligonucleotide. In this work, using the inter-oligonucleotide distance concept, we develop new methods to
evaluate the lack of homogeneity in symmetric word pairs (pairs of reversed complement oligonucleotides),
in equivalent composition groups. We apply the developed methods to the human genome and we conclude
that a strong similarity exists between the distance distributions of symmetric oligonucleotides. We also
conclude that exceptional distance symmetry is present in several equivalent composition groups, that is,
there is a strong lack of homogeneity in the group and a strong homogeneity in the included symmetric
word pairs. This suggests a stronger parity rule than Chargaff’s: in the human genome, symmetric
oligonucleotides have equivalent occurrence frequency and, additionally, they present similar distance
distributions.
1 INTRODUCTION
Chargaff’s first parity rule states that, in any
sequence of double-stranded DNA molecules, the
total number of complementary nucleotides is
exactly equal (%A=%T and %C=%G). Clearly, this
is an inevitable consequence of the complementarity
of opposing nucleotides in the two strands of the
DNA molecule. Chargaff’s second parity rule states
that %A≅%T and %C≅%G in a single strand of
DNA (Forsdyke and Mortimer, 2000). The
extensions to second parity rule state that, in each
DNA strand, the proportion of an oligonucleotide (a
subsequence of adjacent nucleotides) should be
similar to that of its reversed complement (the
oligonucleotide obtained reversing its letters and
interchanging complementary nucleotides). Unlike
the first rule, there is no single accepted reason that
justifies this single strand symmetry. However, the
relative ubiquity of this phenomenon suggests a
relationship with genomic evolution (Forsdyke
2010, ch. 4).
Several works discuss the prevalence of
Chargaff’s second parity rules for several
oligonucleotide lengths, and in different organisms
(Afreixo et al., 2013b; Albrecht-Buehler, 2006;
Baisnée, Hampson and Baldi, 2002). However, the
universality of Chargaff's second parity rule has
been questioned for organellar DNA and some viral
genomes (Mitchell and Bridge, 2006). Powdel and
others (2009) studied the symmetry phenomenon
from an interesting new perspective, by defining and
analysing the frequency distributions of the local
abundance of mono/oligonucleotides along a single
strand of DNA. They found that the frequency
distributions of reverse complementary
mono/oligonucleotides tend to be statistically
similar. Afreixo et al. (2014) introduced a new
symmetry measure, which emphasizes that the
frequency of an oligonucleotide is more similar to
the frequency of its reversed complement than to the
frequencies of other equivalent composition
oligonucleotides.
The inter-nucleotide distances introduced by
Nair and Mahalakshmi (2005) convert any DNA
sequence into a unique numerical sequence, where
each number represents the distance of a symbol to
the next occurrence of the same symbol. Afreixo et
al (2009) explored the global inter-nucleotide
representation and proposed the extraction of four
256
Tavares A., Afreixo V., M. O. S. Rodrigues J. and A. C. Bastos C..
The Symmetry of Oligonucleotide Distance Distributions in the Human Genome.
DOI: 10.5220/0005223102560263
In Proceedings of the International Conference on Pattern Recognition Applications and Methods (ICPRAM-2015), pages 256-263
ISBN: 978-989-758-077-2
Copyright
c
2015 SCITEPRESS (Science and Technology Publications, Lda.)

sequences, one for each nucleotide, to represent the
inter-nucleotide distances. This methodology allows
to perform comparative analysis between the
behaviour of the four nucleotides. Bastos et al
(2011) proposed an inter-dinucleotide distance
distribution and compared the distance distributions
of all dinucleotides in the human genome. Moreover,
evolutionary patterns have been recognized from
information contained in the distance distributions of
the genomes of different organisms (Afreixo et al.,
2009).
In this work we explore the symmetry of
distance distributions by comparing each inter-
oligonucleotide distance distribution to the distance
distribution of its reversed complement, using
homogeneity discrepancy measures. We also
characterize the discrepancy in equivalent
composition groups (ECGs), and compare ECGs
results for different oligonucleotide lengths.
We focus our study in the human genome as an
example of a typical genome exhibiting single strand
symmetry.
2 MATERIALS AND METHODS
2.1 Materials
We analyse the whole human genome, reference
assembly build 37.3, available from the website of
the National Center for Biotechnology Information
(http://www.ncbi.nlm.nih.gov/), discarding all
ambiguous or non-sequenced nucleotides from the
analysis, that is, all non-ACGT symbols.
In our data processing, the chromosomes of the
human genome were processed as separate
sequences, words were counted with overlap and
non-ACGT symbols were considered as sequence
separators.
2.2 Methods
Let be the alphabet formed by the four
nucleotides
A,C,G,T
and let
,
,…,
be a
symbolic sequence defined in . A genomic word,
or oligonucleotide, , is a sequence of length .
Assuming that the sequence is read through a
sliding window of length , we can define the inter-
oligonucleotide (inter-) distance sequence,
, as
the sequence of differences between the positions of
the first symbol of consecutive occurrences of that
oligonucleotide. For instance, in the DNA segment
AAACGTCGATCCGTGCGCG, the inter-CG
distance sequence is
3,5,4,2
.
The inter- distance distribution (or word
distance distribution), denoted as
, gives the
relative frequency of each inter- distance. For each
, there are 4
distance distributions.
The reversed complement of a genomic word is
a sequence obtained by reversing the order of the
letters in the word, interchanging A and T and
interchanging C and G. For instance, the reversed
complement of ACTGG is CCAGT. A symmetric
word pair is defined as the set composed by one
word, , and the corresponding reversed
complement word, ′, with
(Afreixo,
Garcia and
Rodrigues, 2013a; Afreixo et al., 2014).
In this work we compare the inter- distance
distribution,
, of symmetric word pairs. To the set
formed by the distance distributions of symmetric
word pairs we will call complementary distributions.
An equivalent composition group (ECG), of
words with length , is a set composed by all the
words with the same total number of As or Ts. For
instance, the four dinucleotides AA, AT, TA and TT
form an ECG. For words of length there are 1
equivalent composition groups and the group formed
by words comprising As or Ts is denoted as
,
with 0. The number of words of length
in
is given by
#
2
Every symmetric word pair is a subset of an
ECG, which contains several distinct symmetric
word pairs (Afreixo, Bastos and Rodrigues, 2014).
We will call equivalent composition distributions
to the distance distributions of words in the same
ECG.
Under the second parity rule, and under a
scenario of nucleotide independence, it is expected
that reversed complements have similar frequency
and similar inter-distance distribution (homogeneous
distributions), but so do all words in the same ECG.
The similarity between the frequencies of
occurrence of reversed complements and of other
equivalent composition words is described by
Afreixo et al. (2014).
We assess homogeneity in symmetric word pairs
and in ECGs, using the distance distributions of
words of length up to five, in the complete human
genome.
Using empirical data from the contingency table,
whose columns are filled with the absolute
TheSymmetryofOligonucleotideDistanceDistributionsintheHumanGenome
257

frequency of inter- distances of a set, , of words,
we find the expected frequency of each distance for
each word (dividing the product of the row total and
the column total by the total sum). The chi-squared
statistic is defined as
,
,
where
is the observed frequency count in word
for distance , and
is the corresponding expected
frequency, in the homogeneity context.
2.2.1 Symmetric Word Pair Measures
To evaluate the dissimilarity between the inter-
words distributions of symmetric word pairs ( and
′) we use an effect size measure based on a chi-
square statistic to measure the discrepancy between
the distance distributions of reversed complement
words: the phi coefficient given by
,
,
,
where
and
are the number of occurrences of
and ′ in the sequence, respectively. Equal
distributions will result in
,
≅0 and an increase
in dissimilarity will be reflected in an increased
,
.
For interpreting the phi coefficient, we consider
a value above 0.10 as a descriptor for small effect
size, above 0.30 for medium effect size, above 0.50
for large effect size (Cohen, 1988), above 0.60 for
strong effect size and above 0.80 for a very strong
effect size (Rea and Parker, 1992).
We define the weighted distribution of the
complementary distributions (,w’), denoted as
,
, the following distribution
,
and the distance corresponding to the 99
th
percentile
of the weighted distribution of the symmetric pair is
denoted as
.
,
.
2.2.2 ECG Measures
We define an ECG distribution profile as the
weighted distribution of the equivalent composition
distributions. The
distribution, denoted as
, is
given by
∈
,
where
is the total number of occurrences of
words that belong to
, in the sequence. The 99
th
percentile of this weighted distribution is denoted as
.
Since different ECGs may contain distinct
numbers of elements, to evaluate the dissimilarity
between the inter-word distance distributions of each
ECG we use the Cramér’s V coefficient given by
#
1
,
which takes into account the degrees of freedom of
the chi-square distribution (under the homogeneity
hypothesis) to normalise the phi coefficient,
.
3 RESULTS AND DISCUSSION
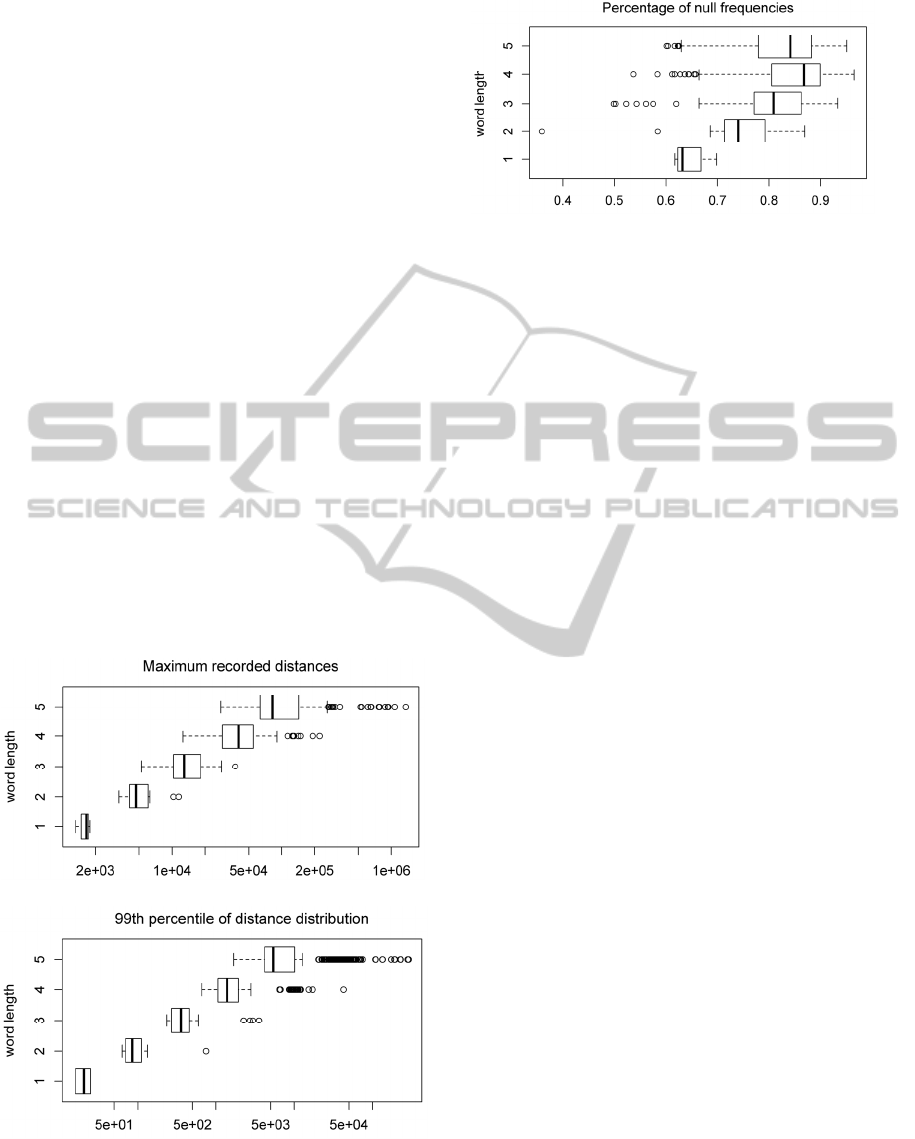
With the increase of the oligonucleotide length, we
observe a large variation in basic descriptive
statistics of the distance distributions. For example,
for 5, the maximum recorded distance of the
distributions ranges from 27,800 to 1,355,000,
approximately. Unsurprisingly, the distributions that
reach the greatest maximum distance contain larger
percentages of distances with null frequencies.
Figure 1 displays box plots (organized by word
length) of the maximum recorded distance of each
distribution,
, and the 99
th
percentile of each
distribution,
.
. Figure 2 displays a box plot of the
percentage of distances, from 99
th
percentile to
maximum recorded distance, with null frequencies,
of each distribution.
The differences in the length of distance
distribution, the amount of longer distances with null
frequencies, and the sensitivity of the chi-square
statistic to low frequencies that occur for longer
distances, lead us to define a cutoff that ensures an
adequate representation of the distributions, without
introducing the long tails of low density. To
incorporate the contribution of the tail in our
calculations, we also group all the remaining
distances in one extra residual class.
Thus, we compute
and
, making a cutoff in
the 99
th
percentile of the weighted distribution of ,
where is one of the following sets:
,′
, ECG,
and . We use the weighted average of the
ICPRAM2015-InternationalConferenceonPatternRecognitionApplicationsandMethods
258
distributions of the elements in because that leads
to a low mean squared error unbiased estimate of the
cutoff point under the null hypothesis assumption
(homogeneity in ).
Since the structure of words with overlap (words
with a suffix that matches with one proper prefix of
the word) prevents some short distances from
occurring, we also expected a large variability, in the
first distances, between distributions of the same
ECG. Therefore, we also explore the similarity
between the equivalent composition distributions,
excluding the first distances of the empirical
distributions in the calculations of
and
.
3.1 Inter-word Distance Analysis for
Symmetric Pairs
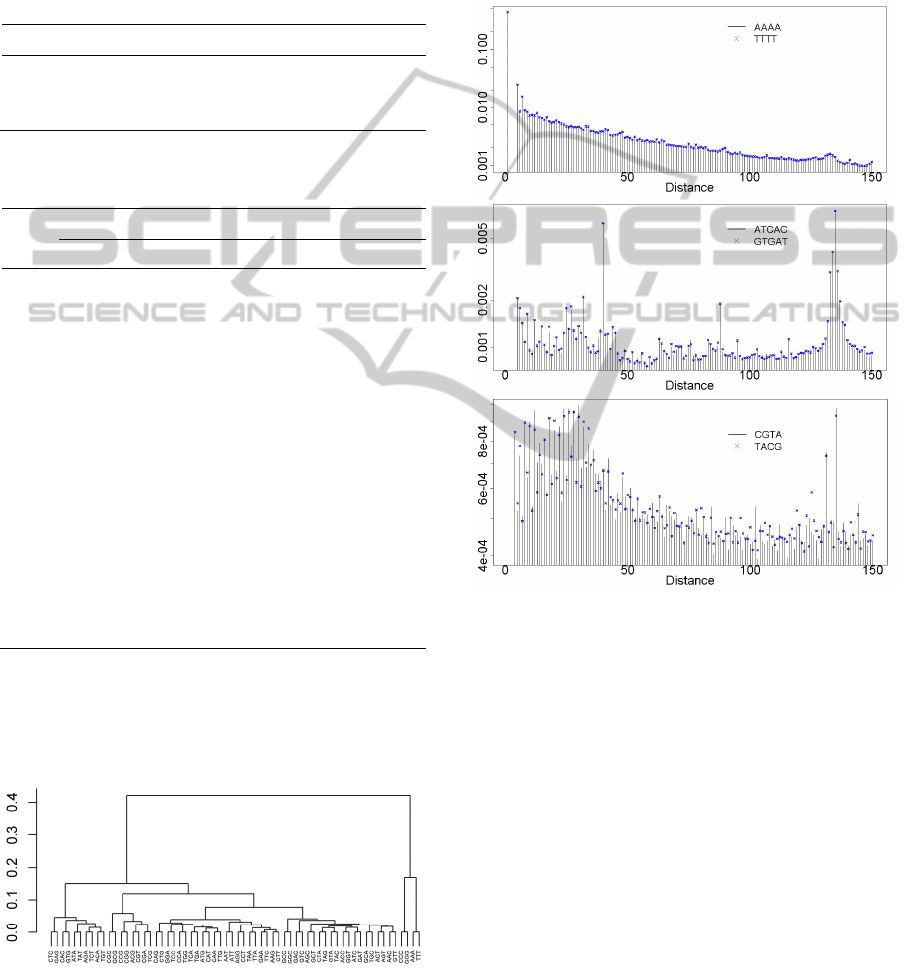
For each word length (from 1 to 5), we use the inter-
distance distributions to build dendrograms that
show hierarchical clusters. The inter-word distance
distributions in the same cluster are more similar to
each other than to those in other groups.
We use the complete linkage clustering and the
average linkage clustering to build the dendrograms,
and compute the similarity matrix with the Euclidian
distance. We performed several cluster analysis
varying the dimension of the similarity matrix.
Figure 1: Box plots of the: maximum recorded distance of
each distribution,
(top); the 99
th
percentile of each
distribution,
.
(bottom). Organized by word length.
Figure 2: Box plot of the percentage of distances, from
99
th
percentile to maximum recorded distance, with null
frequencies.
To compute the cluster analysis of all the
distance distributions, of words of the same length,
we had to define a cut point in the distributions. We
use the maximum 99
th
percentile of the ECG
distributions and consider a residual class containing
the remaining distances.
Since some distances from 1 to may be absent
due to the structure of the words, we also perform
the cluster analysis removing the first distances
and normalizing the distributions.
In all the obtained dendrograms, we observe that
the first similarity levels are formed by
complementary distributions. This indicates that
inter-word distance distributions of symmetric word
pairs are the most similar, over all the words of the
same length. Figure 3 shows one dendrogram of
distance distributions of trinucleotides using
distances from 1 to the maximum of the 99th
percentile of the ECG distributions and a residual
class.
These results motivated us to compare and
evaluate the similarity between the inter-word
distance distributions of symmetric word pairs.
Thus, we compute the phi coefficient,
,
and sort
the symmetric pairs according to that value.
In general, we obtained very low values of phi.
Table 1 presents the maximum recorded phi for each
word length. We found that, for 14, all the
symmetric pairs have low values of
,
, meaning
similarity between the complementary distributions.
However, for 5, we detected 16 symmetric pairs
with medium effect size (0.3
,
0.5), 2
symmetric pairs with large effect size (0.5
,
0.6) and 1 pair with strong effect size
(0.6
,
0.8). All of these distance
distributions belong to oligonucleotides comprising
one or more CGs.
Another result that stands out for 3, is that
the distributions that reach the highest values of phi
coefficient are always distributions of CG-rich
TheSymmetryofOligonucleotideDistanceDistributionsintheHumanGenome
259
words (i.e., oligonucleotides comprising one or more
CG). On the other hand, the distributions that reach
the lowest values of phi coefficient are distributions
of words rich in Ts or As. Table 2 displays the
symmetric word pairs whose distance distributions
have the 6 highest and the 6 lowest
,
, organized
by word length.
Table 1: Maximum and 90
th
percentile of phi coefficient.
1 2 3 4 5
max
,
0.001 0.001 0.016 0.094 0.662
90
t
h
percentile
of
,
0.001 0.001 0.008 0.055 0.019
Table 2: Symmetric word pairs with the 6 highest and the
6 lowest effect size.
,
Word length
1 2 3 4 5
max1
A/T AC/GT CGC/GCG CGAC/GTCG CGACG/GTCG
max2
AA/TT CGA/TCG CGTA/TACG ACGCG/CGCGT
max3
CA/TG CCG/CGG ACCG/CGGT CGCGA/TCGCG
max4
ACG/CGT GCGA/TCGC CGCCG/CGGCG
max5
GAC/GTC CGTC/GACG CGTAC/GTACG
max6
GCC/GGC CGCA/TGCG CCGCG/CGCGG
…
min6
CAG/CTG AATA/TATT AAATT/AATTT
min5
TAA/TTA GAAA/TTTC AGAAA/TTTCT
min4
AGA/TCT TAAA/TTTA AAATA/TATTT
min3
CC/GG TCA/TGA AGAA/TTCT TAAAA/TTTTA
min2
GA/TC AAA/TTT AAAT/ATTT AAAAT/ATTTT
min1
C/G AG/CT AAT/ATT AAAA/TTTT AAAAA/TTTTT
The similarity between the complementary
distributions is clearly observable in histograms. An
extraordinary observation that comes out of this
study is the conservation of the similarity in the
unexpected spikes of the symmetric distributions, for
Figure 3: Dendrogram using Euclidean distance and
complete linkage clustering for inter-word distance
distributions of trinucleotides.
the generality of the symmetric pairs. Figure 4
displays three word distance distributions of
symmetric pairs (the first 150 distances). The
similarity between the distributions of symmetric
pairs is remarkable even when the distributions are
so irregular as those of GCTA/TAGC or
ATCAC/GTGAT. All of these cases present
negligible effect sizes.
Figure 4: Inter-word distance distributions of the first 150
distances for symmetric pairs, in log-scale: AAAA vs
TTTT),
,
≅0.003(top); GCTA vs TAGC,
/
≅0.011(middle); ATCAC vs GTGAT,
,
≅0.03(bottom).
3.2 Inter-word Distance Analysis for
ECG
To find the ECG groups with stronger exceptional
symmetry, we compute the Cramér’s V values
obtained for each group of equivalent composition
distributions.
As already mentioned, to compute
, we set a
distance cut point and create a residual class with the
remaining distances. The
is calculated for
distances from 1 to
.
. Since the word structure of
some words prevents some distances from 1 to
from occurring, because of the word overlap, we
ICPRAM2015-InternationalConferenceonPatternRecognitionApplicationsandMethods
260
also explore the similarity between the equivalent
composition distributions, excluding the first
distances of the empirical distributions.
For nucleotides, 1, we conclude that there is
no significant dissimilarity between the distance
distributions in each ECG. In fact, those equivalent
composition distributions get effect size values
much less than 0.1.
Considering all distances up to the cut point and
a residual class, we observe that, for 1, the
minimum effect size is associated to
.
Moreover,
tends to reach one of the highest effect
sizes (see Table 3a).
With the removal of the first distances, and
due to the non-existence of some distances in a few
distributions in the same ECG, we expect a decrease
in the effect sizes. In fact, for 1, this decrease
occurs and the existence of homogeneity in
holds true. Moreover, the most homogeneous ECG
is
, that is, the group of words comprising only As
and Ts.
The lack of exceptional symmetry in
, with
the removal of the first distances, may be related to
the extraordinary spikes that poly-A and poly-T
distributions reach at distance one (see Figure 4,
top). For 4, some groups present strong
Table 3: Cramér’s V effect size of each ECG, organized
by word length. (a) distances from 1 to
.
, with a
residual class. (b) distances from k+1 to
.
, with a
residual class.
(a)
ECG
Word length
1 2 3 4 5
0,0003 0,31 0,23 0,17 0,14
0,0003 0,31 0,23 0,17 0,14
--
0,29 0,07 0,07 0,05
-- --
0,24 0,04 0,04
-- -- --
0,20 0,02
-- -- -- -- 0.16
(b)
ECG
Word length
1 2 3 4 5
0,0004 0,24 0,17 0,12 0,10
0,0007 0,06 0,12 0,08 0,06
--
0,06 0,04 0,06 0,04
-- --
0,05 0,03 0,03
-- -- --
0,05 0,03
-- -- -- --
0,05
effect sizes (which can be computed from the
values in Table 3b).
In general, ECG discrepancies (Table 3a) are
higher than symmetric pair discrepancies (Table 2),
suggesting the existence of an exceptional symmetry
of distance distributions.
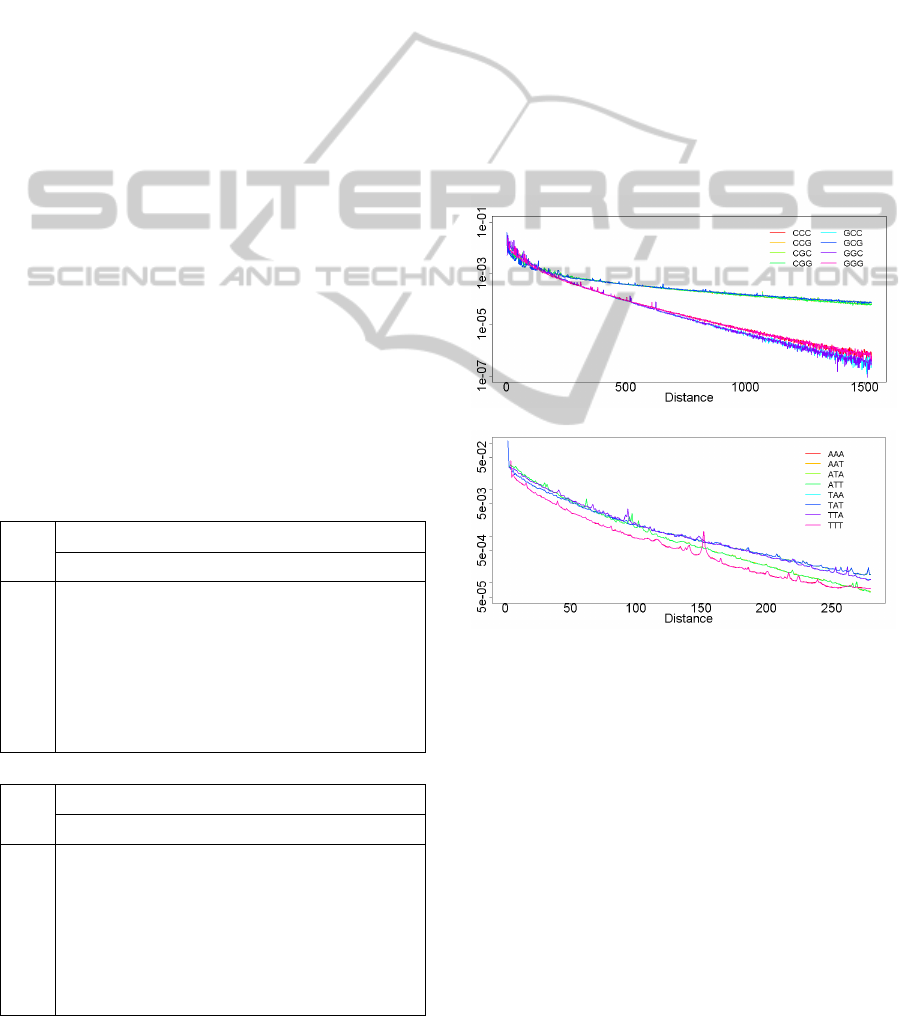
Figure 5 displays the equivalent composition
distributions of trinucleotides in
and in
. In
the irregularity of the distributions is clearly visible
in the first 100 distances. Furthermore, for distances
higher than 500, we also observe a huge divergence
between two groups of distributions. The
combination of these behaviours results in a
dissimilarity between the distance distributions
related to this ECG. In Figure 5 (bottom) we observe
that the distributions have a more homogeneous
behaviour, which results in a smaller Cramér’s V
effect size (Table 3).
Figure 5: Inter-word distance distribution of trinucleotides
in
,
.
1526(top); Inter-word distance distribution
of trinucelotides in
,
.
280(bottom).
To evaluate the variability inside each ECG we
use the standard deviation of the Euclidean distance
between the word distribution and its ECG profile.
The Euclidian distance was computed considering
distances from 1 to
.
and a residual class.
We conclude that, in general,
is the ECG with
one of the highest variations (Table 4). The only
exception is verified for 3, in which
presents
the lowest dispersion. We also observe that
reaches one of the highest variations.
We extend our study to the evaluation of the
ECG weighted distribution as a profile of the inter-
TheSymmetryofOligonucleotideDistanceDistributionsintheHumanGenome
261

word distance distributions. For each word , we
want to analyse if the most similar ECG distribution,
in relation to
, is the
distribution.
Let
denote the ECG of the word and
̅
denote any of the other ECGs. To assess the
similarity between the word distribution,
, and
each of the ECG weighted distributions, we compute
the Euclidean distance between
and
, for
0,…,, considering word distances from 1
to
.
and a residual class. Then, we sort the
Euclidean distances and extract the ECG distribution
most similar to
.
We found that the lowest Euclidean distance is
not always associated to the
distribution,
meaning that the most similar ECG weighted
distribution in relation to
is not always
. For
example, only 38% of tetranucleotides have distance
distributions closer to
distribution than to any of
the other ECGs, and all the distance distributions of
tetranucleotides in
are closer to some
̅
distribution than to the
distribution. Table 5
summarize the percentage of distance distributions,
, that are closest to
distribution (than to
̅
),
over all -mer distributions. It also presents this
percentage, over all the equivalent composition
distributions.
These results may give evidence that, even
inside an ECG group, the words could not follow the
same profile, which is agreement with the
exceptional distance symmetry of some ECG. As an
example, recall the distance distributions of
trinucleotides inside
(Figure 5, top), which
suggest the existence of two distinct distribution
profiles. These results are in agreement with
previously related exceptional distance symmetry of
some ECG, and with the hierarchical clustering
performed in subsection 3.1, where distributions of
words in the same ECG were not grouped in the
same cluster.
To assess similarities between the ECG weighted
distributions (the ECG profiles), we build
dendrograms for each word length. We used the
complete linkage clustering and the average linkage
clustering to build the dendrograms, and we
computed the similarity matrix with the Euclidian
distance. To perform the hierarchical clustering we
set a cutoff in all the distributions and create a
residual class. To ensure an adequate representation
of all the ECG we define the distance cut point at the
maximum of the 99
th
percentile of the ECG profiles,
that is,
.
:0,…,.
We observe that, for 4, the
and the
profile distributions are grouped in the same cluster.
Moreover, for 2, the
and the
profile
distributions are also grouped in the same cluster.
Figure 6 display some of the obtained dendrograms.
Table 4: Standard deviation of the Euclidean distance
between the word distance distribution and its ECG
distribution.
ECG
1 2 3 4 5
3.70E-08
0.029
0.004
0.017 0,017
1.25E-07 0.011
0.017 0.010 0,023
0.001 0.006
0.010 0,014
0.006 0.007
0,012
0.008 0,010
0,008
Table 5: Percentage of words of length , %k, whose
distance distribution is closest to the
distribution than to
a
̅
distribution. Percentage of words in each ECG,
%G_i, whose distance distribution is closest to
distribution than to
̅
.
1 2 3 4 5
%
100 88 63 38 29
%
100 100 50 69 65
%
100 75 42 0 3
%
100 75 43 8
%
100 50 42
%
88 53
%
75
4 CONCLUSIONS
In this work, we contribute with a new method to
evaluate one refinement of Chargaff’s second parity
rules: symmetry of word distance distributions. For
each word length, we propose measures of
symmetry in symmetric word pairs based on the
comparison of the inter word distance distributions.
We also compare the homogeneity of symmetric
words with the homogeneity inside an ECG. In
general, we conclude that the lack of homogeneity
between symmetric words is negligible. In some
ECGs the discrepancy in word distance distributions
is negligible but in other ECGs it is very strong.
These results led us to identify the exceptional
words in the context of the symmetry of distance
distributions: mostly CG-rich words.
ICPRAM2015-InternationalConferenceonPatternRecognitionApplicationsandMethods
262

(a) (b)
(c)
(d)
Figure 6: Dendrogram using Euclidean distance and
complete linkage clustering for ECG weighted
distributions, distances from 1 to the maximum of the 99
th
percentile of the ECG distributions and a residual class.
(a) 2 ; (b) 3; (c) 4; (b) 5.
ACKNOWLEDGEMENTS
This work was supported by Portuguese funds
through the CIDMA - Center for Research and
Development in Mathematics and Applications,
IEETA - Institute of Electronics and Telematics
Engineering of Aveiro and the Portuguese
Foundation for Science and Technology (\FCT
{Fundação para a Ciência e a Tecnologia"), within
projects PEst-OE/MAT/UI4106/2014 and PEst-
OE/EEI/UI0127/2014. Ana H M Tavares is
supported by the project EXPL/MAT-STA/1674/
2013.
REFERENCES
Afreixo, V., Bastos, C. A., Rodrigues, J. M., (2014),
‘Analysis of exceptional word symmetry in single
strand DNA: new measures’, doi:
10.1093/biostatistics/kxu041.
Afreixo, V., Garcia, S. P. and Rodrigues, J. M. (2013a),
‘The breakdown of symmetry in word pairs in 1,092
human genomes’, Jurnal Teknologi, 63(3).
Afreixo, V., Bastos, C. A., Garcia, S. P., Rodrigues, J. M.,
Pinho, A. J., & Ferreira, P. J. (2013b), ‘The
breakdown of the word symmetry in the human
genome’. Journal of theoretical biology, 335, pp.153-
159.
Afreixo, V., Bastos, C. A., Pinho, A. J., Garcia, S. P. and
Ferreira, P. J. (2009), ‘Genome analysis with inter-
nucleotide distances’, Bioinformatics, 25(23), pp.
3064-3070.
Albrecht-Buehler, G. (2006). ‘Asymptotically increasing
compliance of genomes with Chargaff's second parity
rules through inversions and inverted transpositions’,
Proceedings of the National Academy of Sciences,
103(47), pp.17828-17833.
Baisnée, P. F., Hampson, S. and Baldi, P. (2002). ‘Why
are complementary DNA strands symmetric?’,
Bioinformatics, 18(8), pp.1021-1033.
Bastos, C. A., Afreixo, V., Pinho, A. J., Garcia, S. P.,
Rodrigues, J. M. O. S. and Ferreira, P. J. (2011),
‘Inter-dinucleotide distances in the human genome: an
analysis of the whole-genome and protein-coding
distributions’, Journal of Integrative Bioinformatics,
8(3), pp.172.
Cohen, J. (1988). Statistical power analysis for the
behavioral sciences , 2nd edn. Hillsdale, NJ: Lawrence
Erlbaum Associates, Inc.
Forsdyke, D. R. and Mortimer, J. R. (2000), ‘Chargaff's
legacy’, Gene, 261(1), pp.127-137.
Forsdyke, D. R. (2010). Evolutionary Bioinformatics.
Springer, Berlin.
Mitchell, D. and Bridge, R. (2006), ‘A test of Chargaff’s
second rule’, Biochemical and Biophysical Research
Communications, 340(1), pp.90-94.
Nair, A. S. S. and Mahalakshmi, T. (2005), ‘Visualization
of genomic data using inter-nucleotide distance
signals’, Proceedings of IEEE Genomic Signal
Processing, 408. Bucharest, Romania.
Powdel, B. R., Satapathy, S. S., Kumar, A., Jha, P. K.,
Buragohain, A. K., Borah, M., & Ray, S. K. (2009).
‘A study in entire chromosomes of violations of the
intra-strand parity of complementary nucleotides
(Chargaff's second parity rule)’, DNA Research, 16(6),
pp.325-343.
Rea, L. M. and Parker, R. A. (1992) ‘Designing and
conducting survey research’, San Francisco, CA:
Jossey–Bass.
TheSymmetryofOligonucleotideDistanceDistributionsintheHumanGenome
263
