
A 3-Staged Approach to Identifying Patients at Risk of Deterioration
in Emergency Departments
Thomas Schmidt and Uffe Kock Wiil
The Maersk Mc-Kinney Moller Institute, University of Southern Denmark, Campusvej 55, 5230 Odense M, Denmark
Keywords: Health Informatics, Patient Monitoring, Emergency Departments, Predictive Modelling.
Abstract: The variety in patient demographics and admission reasons makes it challenging for Emergency Department
clinicians to notice deterioration in patients. Recent research has found that up to 20% of non-critical
patients deteriorate within the first 24 hours after admission. Unnoticed patient deterioration can lead to
serious adverse events in a clinical setting where patient monitoring relies solely on manual observations of
monitors at infrequent intervals. In this paper, we present a novel 3-Stage Patient Deterioration Warning
System as a model to mitigate the risk of undetected deterioration while improving clinical alarm fatigue.
This staged approach enables the monitoring of patients in levels of increasing descriptiveness based on
multiple models of normality. The model is validated via related work, clinical observations, and patterns of
patient data collected at a Danish Emergency Department bedside ward. The paper concludes with a
presentation of plans for future implementation work.
1 INTRODUCTION
Roughly 20% of patients arriving at an emergency
department (ED) with non-critical vital values,
deteriorate within the first 24 hours (Henriksen et
al., 2014). In line with the assumption that 3 to 6%
of all deaths in hospitals are unexpected (Hayward
and Hofer 2001; Zegers et al., 2009), this has
spawned several attempts to prevent these situations
by increasing formalization and automation of
patient observations.
In this regard much scholarly effort has
addressed the challenge of improving the predictive
accuracy of Early Warning Systems (EWS) for
detecting patient deterioration. Broadly speaking,
these attempts can be classified as either improving
the system for identifying deteriorating patients or
seeking to automate the deterioration detection
system to alleviate the cognitive and physical
workload on clinicians. Permutations of the first
aspect have been researched with regards to
improving EWS in general wards (Mcgaughey et al.,
2007), and in EDs (Geier et al., 2013). A recurring
theme in this research is the inability to definitively
determine exact vital sign thresholds and
correlations to mark the initial stage of deterioration.
Thus, most systems have poor quality of supporting
evidence (Gao et al., 2007; Brabrand et al., 2010).
Most approaches do however note an effect of
implementing a formalized EWS. This is in line with
the second line of attempts, where the process of
identifying patients at risk depends on collaboration
and communication between multiple actors. This
interplay has been coined as the “chain of survival”
(Subbe and Welch 2013). This chain consists of: 1)
high-quality recording of vital signs; 2) ability to
recognize familiar patterns; 3) reporting of
abnormality; and 4) a precise and prompt response.
Of these four steps, this paper focuses primarily on
steps 2 and 3, by introducing a model that adheres to
the patients’ clinical circumstances, and to provide a
system design that enables higher accuracy, while
supporting the cognitive models of clinicians.
Our work includes a field study of an Emergency
Department, with the purpose of identifying
collaborative and organizational causes for
undetected patient deterioration. This field study is
based on 13 participatory observation sessions of
complete 8 hour shifts with different clinical groups.
We conclude that future patient deterioration
detection systems must convey information about
patient state and trajectory ubiquitously throughout
the department, and not just at bedside or in
designated offices to overcome both temporal and
spatial challenges. Additionally, as each clinical
group has different areas of expertise and means of
470
Schmidt T. and Wiil U..
A 3-Staged Approach to Identifying Patients at Risk of Deterioration in Emergency Departments.
DOI: 10.5220/0005226004700477
In Proceedings of the International Conference on Health Informatics (HEALTHINF-2015), pages 470-477
ISBN: 978-989-758-068-0
Copyright
c
2015 SCITEPRESS (Science and Technology Publications, Lda.)

interaction, the deterioration warning system should
differentiate patient state representation according to
individual clinical groups (Schmidt & Wiil n.d.).
From the field study, we also identified that
clinical observations and automated patient
monitoring are challenged by the fact that certain
groups of patients and individuals fall outside the
population based model of normality currently in use
at the ED. Several attempts to improve the predictive
accuracy of EWS have already been made (see
Section 3). However, our findings indicate that
models should accommodate the individual traits of
each patient. Yet, the clinical reality often proceeds
at a pace that prohibits this from being attainable in
a real time environment. Thus, we present a design
that counters these challenges through a staged
model which allows for a gradual progression of
accuracy as the system familiarizes itself with each
patient. We have named this system the 3-Stage
Patient Deterioration Warning System (3-Stage
PDWS).
The paper first describes the settings and
structure of a Danish ED. We then describe related
work in Section 3 to argue for our approach. We
present our data collection approach and the study
methodology which sets the stage for the design of
the 3-Stage PDWS. As this is the main contribution
of the paper, we conclude with a discussion of the
challenges we face and a description of planned
future work to address these.
2 THE SETTINGS
The ED capacities of the Danish healthcare sector
have recently been restructured by merging multiple
hospital entry points to a single point of entry. This
meant closing emergency departments at minor
hospitals and fusing the capacities of larger
hospitals. All observations in this paper are based on
a field study conducted at an ED at a large university
hospital in Denmark. This ED is organized into a
receiving ward, known as the Emergency Treatment
Center (ETC) and a bedside ward; Center for
Accelerated Patient admissions (CAP). The ETC
handles both medical and surgical illnesses which
can be identified and treated in a day. If the
treatment period requires hospitalization, the patient
will be admitted to the CAP. All patients arriving at
the ED with anything but minor injuries will be
triaged upon arrival. The variety of patients in EDs
makes it difficult to define a single warning system
to suit all patients (Windle and Williams 2009). At
the ED of this study, the clinicians currently rely on
the ADAPT triage model (Lauritzen et al., 2009),
which defines thresholds for each severity score and
provides guidelines for how often registered
observations are to be scheduled during the stay.
Vital signs monitoring in the ED utilize Philips
IntelliVue MP30/50 monitors in a networked setup
which enables clinicians to remotely monitor
patients from ward offices. How much and at what
frequency a patient is monitored depends on clinical
judgment based on the patient’s triage level.
A distinctive trait of EDs is that the clinicians
plan treatment of patients based on their presented
history and symptoms instead of a known diagnosis.
So in a context where patient throughput is high and
a large part of clinical observations are tacit and thus
seldom transferred consistently between shifts, the
need for a shared representation which captures a
patient’s state, trajectory, and clinically linked
observations is a reality that to the best of our
knowledge is not dealt with properly today.
During our field study we observed on multiple
occasions nurses muting patient alarms without
actually assessing the patient’s state. This oversight
of alarms was frequently based on assumptions
about the patient, or the equipment’s reliability. This
is in line with similar causing factors for alarm
fatigue such as a high number of false positives,
usability issues, and faith in own knowledge (Sijs et
al., 2006). The monitoring system issues alarms in
stepwise degrees, and even though the most severe
alarms still lead to increased levels of observation,
inexperienced nurses may be affected by the overall
tendency to dismiss non-critical alarms, and thus
miss true adverse events in the long run.
As few EDs to our knowledge have the necessary
staffing and budget to integrate the latest generation
of automated patient monitoring, we believe that
there is a need to identify ways of improving
deterioration detection by utilizing existing
equipment. This pragmatic approach should be of
interest to EDs worldwide.
3 RELATED WORK
In our review of existing related work, we have
focused on studies that concentrated on integration
into a clinical reality: work that attempts to integrate
prospective data, real-time analysis, and an
assessment of clinical feasibility. From these
criteria, the research contributed by the Oxford
Biomedical Research Center (Tarassenko et al.,
2006; Orphanidou et al., 2009) stands out. They
investigate the applicability of latent variable models
A3-StagedApproachtoIdentifyingPatientsatRiskofDeteriorationinEmergencyDepartments
471

which merge multiple streams of patient vital values
into a model built upon machine learning
techniques, with the intention of providing an
intuitive visualization of patient state and trajectory.
The plausibility of building individual models of
normality has been investigated (Zhang et al., 2007).
Although the specific angle in this study is unfit for
a large scale real-time system, the research still
conceptually shows the possibility of detecting
patient deterioration from dynamically created
models. In a study based on observational vital sign
data, models of normality were built for a specific
post-operative patient population based on three
different metrics calculated from the vital sign
distributions (Pimentel et al., 2013). In the same
study, the authors also found that the majority of
observed vital sign types varied substantially from
submission to admission.
Priming a clinical warning system by performing
risk stratification based on Electronic Health Record
(EHR) information to determine which patients were
in need of continuous monitoring offers several
advantages (Hackmann et al., 2011). This vision has
been elaborated upon by focusing on the challenges
of doing time series analysis on streams of vital
signs (Mao et al., 2011).
Although several contributions to this field have
been made, most of the work has been done in
parallel, and not in cooperation, with the targeted
clinical context. Thus, we are motivated to conduct
the planning and execution of this project with the
intent of providing a solution that strives to fit into
the entirety of the problem domain.
4 METHODOLOGY AND DATA
GATHERING
This paper is part of larger action-oriented research
project which involves a field study, workshops, and
prototype-driven controlled experiments. As such,
we follow an action-oriented research approach
(Easterbrook et al., 2008). Consequently, we have
participated in ED training courses, managed
workshops, and helped plan new standard working
procedures. In October 2013, we launched an
ongoing automated gathering of vital sign data from
patients admitted to the CAP. The registration of
vital signs is approved by the Danish Data
Protection Agency. Data is stored in a restricted
access database in compliance with Danish
legislation on privacy concerns.
The collected vital signs will be coupled with
national Danish health registries to cluster all
patients using categorical data such as past illnesses
from ICD-10 codes, initial triage level, gender,
admission package, number of prescribed
medications, age, and {7,30,90}-day outcome in a
retrospective analysis. The dataset will be segmented
into event and non-event subgroups based on the
occurrences of heart failures, ICU transfers, and in-
hospital death. This retrospective dataset also forms
the foundation for the training of the patient state
models which we introduce in later sections.
4.1 Vital Sign Data Collection
Vital sign values are harvested from the Philips
IntelliVue patient monitors through a HL7 export
interface. From this we receive HL7 Unsolicited
Observation Reporting messages with patient vital
signs from each bed in 60 second intervals. These
messages are parsed and stored in a VitalSigns
database. The HL7 messages carries information
about arterial blood oxygen saturation (SpO2) and
Pulse Rate (PR) measured through pulse oximetry;
Respiration Rate (RR); and Heart Rate (HR)
measured using 3-lead electrocardiography; and
mean, systolic, and diastolic blood pressure
measured using a Non-invasive Blood Pressure
(NBP) cuff. The actual types of vital signs registered
for each individual patient depend on the level of
criticality and overall mobility of the patient.
Clinicians often adjust the frequency of NBP
measurements to match the state of the patient, and
consequently we register blood pressure
measurements in intervals from five to sixty
minutes. As pulse oximetry is the least obtrusive
vital sign to monitor, SpO2 and PR are by far the
most frequent observations in our dataset.
When a patient is received on the CAP ward, we
asked the nurses to admit the patient to the Philips
IntelliVue system by entering personal identification
Table 1: Overview of vital sign registrations.
N
umber of patients re
g
istere
d
5.023
Total number of registered
a
gg
re
g
ated vital si
g
ns
3.483.302
Mean age male patients in years
61.4
(SD 20.4)
Mean age female patients in
y
ears
65.4
(SD 22.3)
Heart Rate registrations 1.972.106
Respiratory Rate
registrations
1.925.849
Pulse Rate re
g
istrations 3.015.059
SpO2 re
g
istrations 2.996.736
Blood Pressure registrations 112.589
HEALTHINF2015-InternationalConferenceonHealthInformatics
472
information such as name and social security
number. This information was stored in a Patient
database table and coupled with the vital signs.
Table 1 summarizes the collection of vital values
in the period from October 2013 to August 2014.
The number of vital signs registered for each patient
varies from a single measurement up to several
thousand.
5 DESIGNING THE 3-STAGE
PDWS
5.1 Guiding Design Principles
Our design principles are influenced by related
work, clinical observations, and our own
assumptions regarding what seems feasible fitting
into the settings of the particular ED from the field
study.
The ongoing data collection has been
preliminarily evaluated to probe for support of our
assumption that a granular model of normality
would be an appropriate approach for the system. As
an example of group-based normality, Figure 1
depicts the distributions of 6.000 randomly sampled
heart rates of patients assigned to either the
Endocrinology (E) or the Neurology (N) speciality;
mean heart rate for each sample is shown as vertical
lines.
Although Figure 1 displays distinct differences,
medical specialty as such is not a sufficiently
accurate classification feature. E patients in the ED
are often diabetics whereas N patients can have a
wider range of diseases. Later investigations will
include ICD-10 codes with highest mortality and
coverage of admissions.
For patients these will be obtained through the
Figure 1: HR distribution for two specialties.
coupling of the VitalSigns database to the Danish
national health registries. Thus, the specific model
features are currently being selected through our
cooperation with ED researchers and clinicians.
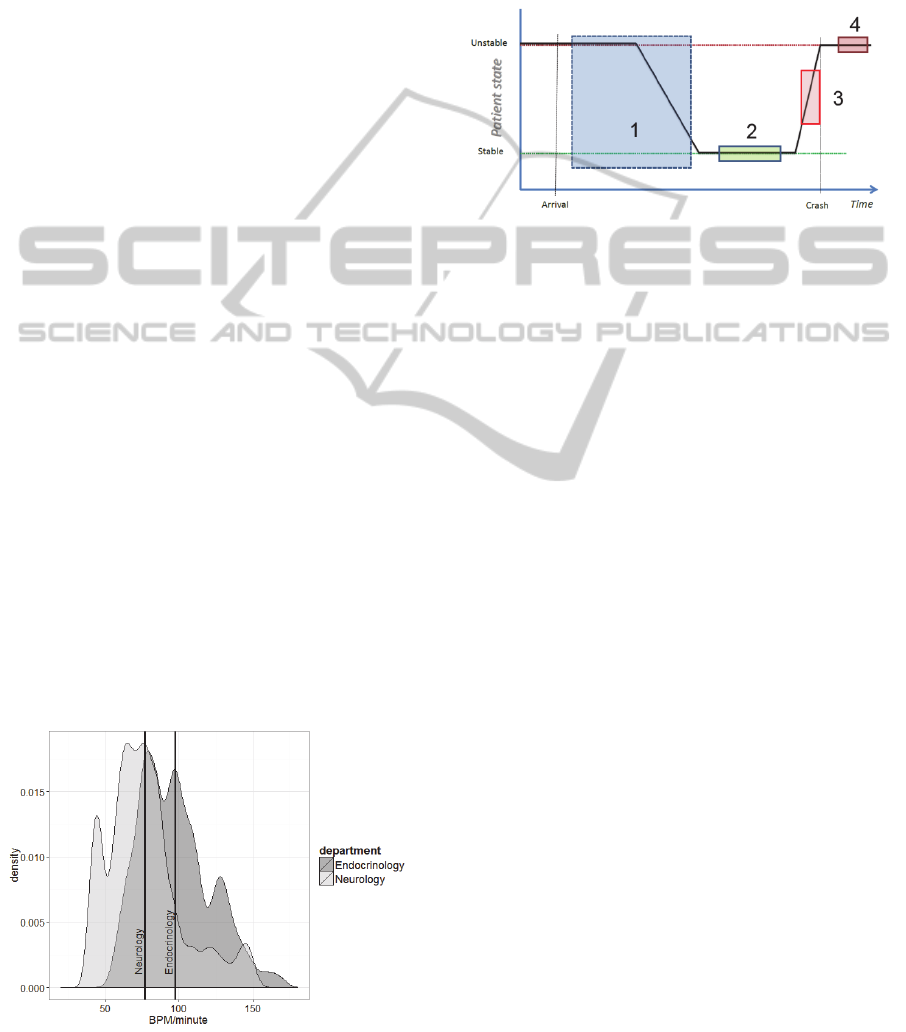
Figure 2 illustrates the key assumption that patients
arriving at the ED are classifiable as unstable as they
are in an imbalanced condition compared to their
normal state of being.
Figure 2: State progression of patients.
As clinicians initiate the diagnosis and treatment
process during hospitalization, the patient is
assumed to gradually stabilize, as illustrated by box
1 in Figure 2. Some patients are expected to stabilize
during treatment, which marks the period where the
3-Stage PDWS trains to detect deterioration from
personalized stabilization, illustrated as box 2 in
Figure 2. This individualized approach is expected
to enable earlier realization of the cases where a
patient departs from individual stability, illustrated
as box 3 in Figure 2. Automated recognition of
deterioration is expected to precede human clinical
observation of the same deterioration, which is
shown as box 4 in Figure 2. Even if the
discriminatory ability of the system is poor, it might
still provide warning of ongoing deterioration at an
earlier stage as the automated system continuously
evaluates the patients, whereas clinicians are
confined to spot observations due to a busy
schedule.
The patient trajectory assumption will be tested
by analysing the vital signs time series data collected
from patients to check for any significant
progression of vital signs during the admission
period of the patients. Similar investigations have
been carried out and found that the initial trend of a
patient’s state is correlated to in-hospital death
(Kellett et al. 2013).
5.2 Model Architecture
The conceptual model in Figure 3 depicts each of the
three stages in our proposed system:
A3-StagedApproachtoIdentifyingPatientsatRiskofDeteriorationinEmergencyDepartments
473
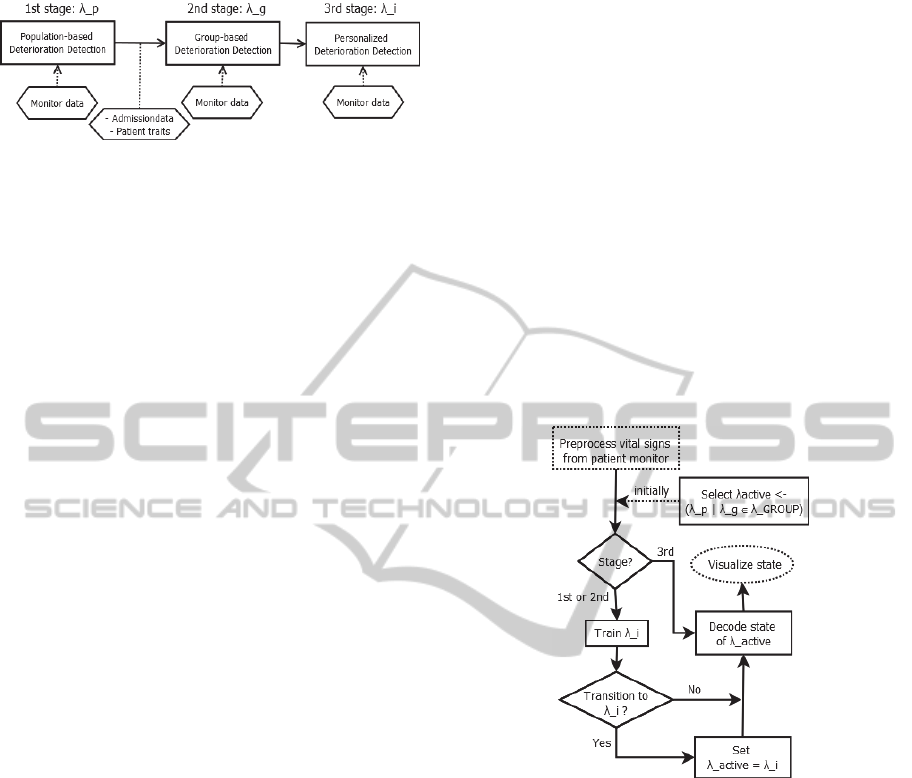
Figure 3. The 3-Stage PDWS model.
This model utilizes three levels of deterioration
detection; λ
p
for detecting deviation from population
based training set, λ
g
∈ λ
GROUP
from a set of group
based models, and λ
i
for individual calibrated
models.
Each stage in Figure 3 serves a particular purpose:
1. Population-based Deterioration Detection:
Initially, the state of the patient is derived
from a population-based deterioration
model.
2. Group-based Deterioration Detection:
when a patient is classified as belonging to
a given group g
∈ GROUP, all received vital
values from the patient will be assessed
according to what is identified as normality
for this group of patients.
3. Personalized Deterioration Detection:
given the assumption that some patients
have models of normality that differ from
any group, the system will evaluate if the
given patient seems to be in a stable
deviation from the model of normality
under which the patient is currently
monitored. If so, the patient should be
monitored according to an individual
model.
Between the 1
st
and 2
nd
stage, patients are sought
classified based on arrival parameters and from
information from the patient’s EHR. This
classification will be based on a previous
unsupervised clustering of patient parameters. In this
step, we initially seek to select a couple of the most
significant clusters to reduce the model complexity.
The envisioned flow of stage selection and state
decoding is illustrated in Figure 4, which shows the
parallel deterioration detection, training of the
individual model, and concurrent visualization of
patient state.
Although we are still evaluating machine
learning techniques, using Hidden Markov Models
(HMM) as a modelling approach for patient state
transitions is interesting because the properties and
traits of HMMs resemble the clinical reality found in
EDs. Namely, that clinicians monitor a set of vital
sign observations from which they seek to deduce
the actual state of a patient. This is in line with the
hidden state nature of HMMs (Rabiner, 1989).
Although clinicians operate with a multitude of
observation channels, the clinical assessment is
essentially still a process of uncertainty and
interpretation of the hidden, actual state of the
patient. HMMs have been used to model clinical
relevant situations such as real-time daily activity
monitoring (Wei et al., 2011) and hepatitis C disease
progression (Sweeting et al., 2010). Although (Sittig
and Factor, 1990) investigated the development of a
multi-state Kalman filter algorithm for patient
monitoring, and (Ghassempour et al., 2014)
proposed a method for clustering multivariate time
series of both numerical and categorical features in
healthcare, our survey of published research
indicated that HMMs have not been investigated for
modelling patients in an ED context.
Figure 4: Stage selection flow.
Through our observations of patients and
discussions with clinicians, it is evident that it is
difficult to quantify the state of a patient. Instead the
trajectory of a patient is often mentioned as a
noticeable registration by clinicians, which raises the
question if dynamic changes in patients can be used
to identify patients at risk (Kellett et al., 2013).
Hence, Figure 5 conveys our proposal for the states
of the HMM and its transition relationships. The
hidden states of the HMM are the unknown actual
state of the patient who can be either in one of the
safe states, transition states, or unsafe states.
The decision threshold between transitioning
from group-based normality to individual normality
will be investigated using distance measures
between the two HMMs (Lyngsø et al., 1999; Zeng
et al., 2010) and will also be evaluated based upon
an evaluation of P(O|λ
i
) > P(O|λ
active
).
HEALTHINF2015-InternationalConferenceonHealthInformatics
474
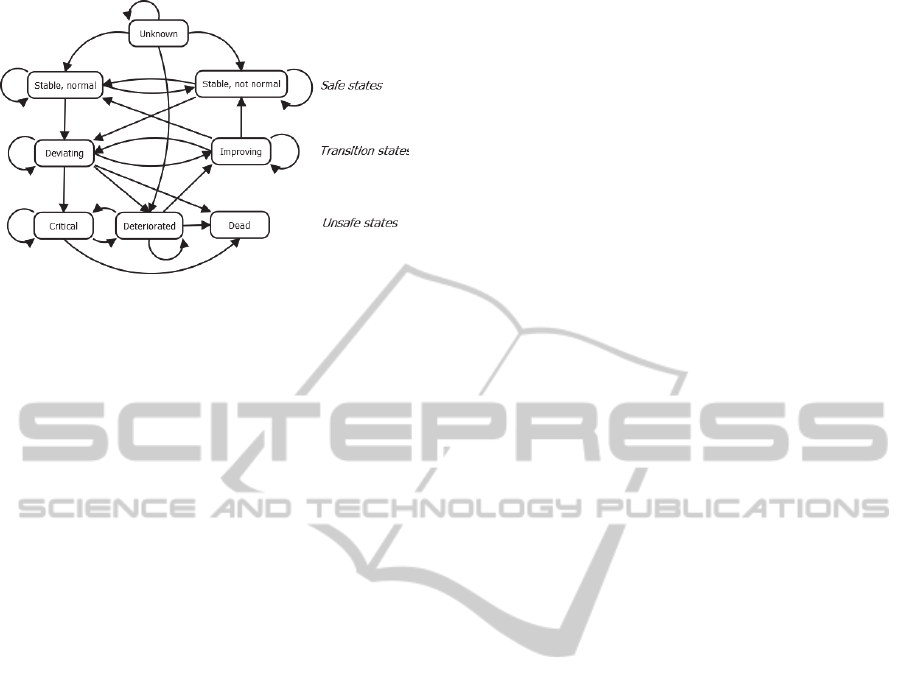
Figure 5. Proposed states.
5.3 Model Validation
The 3-Stage PDWS model has currently only been
conceptually validated by its composition from the
body of existing published research, preliminary
data analysis, and clinical observations from the
field study, and in collaboration with nurses and
physicians at the ED.
The exact number of clusters found through the
investigation of patient characteristics, is still
unknown. However, we intend to validate the
clusters by relying on the judgment of experienced
ED physicians who will review the similarity
measures of each cluster.
The final model and its implementation needs
validation in two dimensions: a retrospective
evaluation of its accuracy in identifying patients at
risk of deterioration, and in its ability to convey the
patient state in a way that makes sense to different
clinical professions.
Each stage of the PDWS will be assessed
individually in the retrospective validation by its
ability to accurately classify patients as
deteriorating. The accuracy of the group
classification will be reviewed through the ability to
produce similar labels for unobserved patients as
found by the physicians. In this regard we are
interested in model accuracy and the ability to
predict deterioration onset earlier than currently
possible by the existing alarming thresholds defined
by the ADAPT triage model (Lauritzen et al., 2009).
The clinical utility of our model will be assessed
by comparing the misclassification rate of our
system with the generic thresholds used at the
specific ED in this study.
6 DISCUSSION
Automating patient deterioration detection can be
approached from multiple entry points. The first
challenge is gathering the vital signs in an
unobtrusive way that does not enforce a potentially
unjustified sense of illness on the patient, and which
does not hinder the workflow of clinicians or
treatment trajectories of patients. Our approach is
pragmatic in the sense that we seek to design and
build a solution that utilizes the existing equipment
at the ED. We have found that the clinicians are
prone to not attach the most cumbersome sensors to
patients who are scheduled for frequent tests outside
the ward. Mobile monitoring technology would help
overcome this obstacle, but is outside the scope of
our current research approach.
Our approach to subgroup classification
resembles that of (Zmiri et al., 2012), who
investigated the feasibility of using decision trees
and probabilistic algorithms for classification of
patients into severity levels similar to the clinical
triage classification. However, our intent is not to
replace existing severity indices, but instead to
improve the accuracy of vital sign monitoring by
deploying increasingly specific thresholds.
Although the data we are currently collecting
only consist of a few dimensions, we are challenged
by commonly found problems such as variation in
what vital signs are measured and occasional holes
in the time series. This issue has been dealt with by
replacing the missing values with either the last
registered measurement or with the mean of the vital
sign over the entire historical dataset (Mao et al.,
2011). An alternative approach is to utilize Gaussian
Processes which have proved useful in predicting the
distribution of missing physiological data (Clifton et
al., 2012). Additionally, we face a sizeable task in
ensuring the validity of the vital signs by having to
check that the data series can be linked to a given
patient in a reliable manner. To ensure this we plan
to couple our VitalSigns database with the EDs
internal logistic system. This provides accurate
information about which patients resided in each bed
at a given point in time.
Modifying the harvesting and registration of vital
sign data using existing equipment by asking
clinicians to revise their standard working practices,
has unsurprisingly proven difficult. The staff group
as a whole recognizes the importance of registering
vital values. But the clinical reality is such that if a
system does not yield immediate and tangible
benefits, the perception of added utility is generally
low, causing the clinicians to abstain from
integrating new admission procedures. In our case
this is admitting patients to the Philips IntelliVue
system, but we find that the concept of clinical
A3-StagedApproachtoIdentifyingPatientsatRiskofDeteriorationinEmergencyDepartments
475

utility and the interplay between healthcare
organization and health information technology is a
topic worthy of further exploration. This interplay
relates to the notion of “meaningful use”
(Blumenthal and Tavenner, 2010), and the SUMMIT
method for modelling the meaningful use of an IT
tool as a function of its overall utility (Haynes et al.,
2013). It seems feasible to deploy this framework in
the planned controlled experiments with nurses and
physicians to structure the evaluation of how the 3-
Stage PDWS represents and visualizes knowledge
and information about patients. Other research has
pointed out a clinical scepticism towards black-box
expert systems. Consequently, the aim of our system
is to support decision making rather than replace it.
Finally, while our initial approach will rely on
datasets tightly coupled to the Danish healthcare
system, the core model assumptions are applicable
globally. Although specialty department features as
proposed in Figure 1 may be of little meaning to
other healthcare systems, we expect that the addition
of selected ICD-10 features will provide both
interesting insight for clinical researchers and
practitioners. The challenges of patient variation is
known to all EDs and thus we believe that the 3-
Stage PDWS can be of use wherever it is possible to
classify arriving patients.
Another aspect is the availability of vital sign
data. Several patient monitors already support
exporting vital sign data, and as such our solution is
independent of particular equipment. As monitoring
platforms are becoming increasingly unobtrusive, a
wider spectrum of patients can be included in
continuous monitoring. This expansion into a
broader part of the patient population further
justifies building more specific deterioration
detection models.
7 FUTURE WORK AND
CONCLUSION
The overall goal is to improve the detection of
deteriorating patients by identifying the onset of
adverse events earlier and to embed this detection
ubiquitously into clinical practices by assuming a
holistic approach to the integration of patient
monitoring. If the system proves successful, we
expect to see a reduction in patient mortality and
increased clinical utility of the monitoring platform.
The intent of our research is to target the solution
domain as a whole and not to focus on particular
parts, e.g., providing a revolutionary real-time
analysis model, conceiving new machine learning
techniques, or developing new monitoring platforms.
We expect to draw out more systemic findings
which can support more depth-oriented research
approaches.
The system is currently under development, as
we have undertaken initial analysis of the vital signs
and how to utilize these with machine learning
techniques that are sensible to clinicians. Coupling
of the collected vital signs with the national Danish
health registries is planned for Q3 2014, and we
expect the prototype to be ready for initial clinical
controlled experiments by early 2015. Fine tuning of
the predictive capabilities of the 3-Stage PDWS is
planned for Q2 in 2015.
REFERENCES
Blumenthal, D. & Tavenner, M., 2010. The “Meaningful
Use” Regulation for Electronic Health Records. New
England Journal of Medicine, 363(6), pp.501–504.
Brabrand, M. et al., 2010. Risk scoring systems for adults
admitted to the emergency department: a systematic
review. Scandinavian journal of trauma, resuscitation
and emergency medicine, 18, p.8.
Clifton, L. et al., 2012. Gaussian process regression in
vital-sign early warning systems. 2012 Annual
International Conference of the IEEE Engineering in
Medicine and Biology Society, pp.6161–6164.
Easterbrook, S. et al., 2008. Selecting empirical methods
for software engineering research. In F. Shull, J.
Singer, & D. I. K. Sjøberg, eds. Guide to Advanced
Empirical Software Engineering. Springer London,
pp. 285–311.
Gao, H. et al., 2007. Systematic review and evaluation of
physiological track and trigger warning systems for
identifying at-risk patients on the ward. Intensive care
medicine, 33(4), pp.667–79.
Geier, F. et al., 2013. Severity illness scoring systems for
early identification and prediction of in-hospital
mortality in patients with suspected sepsis presenting
to the emergency department. Wiener klinische
Wochenschrift, 125(17-18), pp.508–515.
Ghassempour, S., Girosi, F. & Maeder, A., 2014.
Clustering multivariate time series using Hidden
Markov Models. International journal of
environmental research and public health, 11(3),
pp.2741–63.
Hackmann, G. et al., 2011. Toward a two-tier clinical
warning system for hospitalized patients. In AMIA
Annual Symposium Proceedings. pp. 511–9.
Haynes, S.R., Winkler, T.E. & Ritter, F.E., 2013.
Modeling Meaningful Use as Utility in Emergency
Medical Services. 2013 IEEE International
Conference on Healthcare Informatics, pp.455–460.
Hayward, R.A. & Hofer, T.P., 2001. Estimating hospital
deaths due to medical errors: preventability is in the
HEALTHINF2015-InternationalConferenceonHealthInformatics
476

eye of the reviewer. The Journal of the American
Medical Association, 286(4), pp.415–420.
Henriksen, D.P., Brabrand, M. & Lassen, A.T., 2014.
Prognosis and risk factors for deterioration in patients
admitted to a medical emergency department. PloS
one, 9(4), p.e94649.
Kellett, J. et al., 2013. Changes and their prognostic
implications in the abbreviated VitalPAC
TM
Early
Warning Score (ViEWS) after admission to hospital of
18,827 surgical patients. Resuscitation, 84(4), pp.471–
6.
Lauritzen, M., Skriver, C. & Dahlin, J., 2009. Triage-
Manual. , (juni). Available at:
http://www.hillerodhospital.dk/NR/rdonlyres/D20F6C
68-ABB6-402D-B463-
C7293185C372/0/Triagemaster.pdf.
Lyngsø, R.B., Pedersen, C.N. & Nielsen, H., 1999.
Metrics and similarity measures for hidden Markov
models. In Proc. Int. Conf. Intell. Syst. Mol. Biol. pp.
178–86.
Mao, Y., Chen, Y. & Hackmann, G., 2011. Medical Data
Mining for Early Deterioration Warning in General
Hospital Wards. In Proceedings of the 2011 IEEE 11th
International Conference on Data Mining Workshops.
IEEE Computer Society, pp. 1042–1049.
Mcgaughey, J. et al., 2007. Outreach and Early Warning
Systems ( EWS ) for the prevention of Intensive Care
admission and death of critically ill adult patients on
general hospital wards ( Review ). Cochrane Database
System Rev, 3.
Orphanidou, C. et al., 2009. Telemetry-based vital sign
monitoring for ambulatory hospital patients. In
Engineering in Medicine and Biology Society, 2009.
EMBC 2009. Annual International Conference of the
IEEE. pp. 4650–3.
Pimentel, M.A.F. et al., 2013. Modelling physiological
deterioration in post-operative patient vital-sign data.
Medical & biological engineering & computing,
51(8), pp.869–77.
Rabiner, L., 1989. A Tutorial on Hidden Markov Models
and Selected Applications in Speed Recognition.
Proceedings of the IEEE, 77(2), pp.257–286.
Schmidt, T. & Wiil, U.K., Identifying Patients at Risk of
Deterioration in the Joint Emergency Department.
Cognition, Technology & Work. Under review.
Sijs, H. Van Der et al., 2006. Overriding of drug safety
alerts in computerized physician order entry. Journal
of the American Medical Informatics Association,
13(2), pp.138–147.
Sittig, D.F. & Factor, M., 1990. Physiologic trend
detection and artifact rejection: a parallel
implementation of a multi-state Kalman filtering
algorithm. Computer methods and programs in
biomedicine, 31(1), pp.1–10.
Subbe, C.P. & Welch, J.R., 2013. Failure to rescue: using
rapid response systems to improve care of the
deteriorating patient in hospital. Clinical Risk, 19(1),
pp.6–11.
Sweeting, M.J., Farewell, V.T. & De Angelis, D., 2010.
Multi-state Markov models for disease progression in
the presence of informative examination times: an
application to hepatitis C. Statistics in medicine,
29(11), pp.1161–74.
Tarassenko, L., Hann, a & Young, D., 2006. Integrated
monitoring and analysis for early warning of patient
deterioration. British journal of anaesthesia, 97(1),
pp.64–8.
Wei, H., He, J. & Tan, J., 2011. Layered hidden Markov
models for real-time daily activity monitoring using
body sensor networks. Knowledge and Information
Systems, 29(2), pp.479–494.
Windle, J. & Williams, J., 2009. Early warning scores: are
they needed in emergency care? Emergency nurse :
the journal of the RCN Accident and Emergency
Nursing Association, 17(2), pp.22–6.
Zegers, M. et al., 2009. Adverse events and potentially
preventable deaths in Dutch hospitals: results of a
retrospective patient record review study. Quality &
safety in health care, 18(4), pp.297–302.
Zeng, J., Duan, J. & Wu, C., 2010. A new distance
measure for hidden Markov models. Expert Systems
with Applications, 37(2), pp.1550–1555.
Zhang, Y., Silvers, C.T. & Randolph, A.G., 2007. Real-
time evaluation of patient monitoring algorithms for
critical care at the bedside. In Engineering in Medicine
and Biology Society, 2007. EMBS 2007. 29th Annual
International Conference of the IEEE. pp. 2783–6.
Zmiri, D., Shahar, Y. & Taieb-Maimon, M., 2012.
Classification of patients by severity grades during
triage in the emergency department using data mining
methods. Journal of evaluation in clinical practice,
18(2), pp.378–88.
A3-StagedApproachtoIdentifyingPatientsatRiskofDeteriorationinEmergencyDepartments
477
