
Malfinder: Accelerated Malware Classification System through Filtering
on Manycore System
Taegyu Kim
1
, Woomin Hwang
1
, Chulmin Kim
1
, Dong-Jae Shin
1
, Ki-Woong Park
2
and Kyu Ho Park
1
1
Korea Advanced Institute of Science and Technology (KAIST), Daejeon, Republic of Korea
2
Daejeon University, Daejeon, Republic of Korea
Keywords:
Malware Variant Classification, Identical Structured Control Flow, Table Division, Dynamic Resource
Allocation, NUMA (Non Uniform Memory Access).
Abstract:
Control flow matching methods have been utilized to detect malware variants. However, as the number of
malware variants has soared, it has become harder and harder to detect all malware variants while maintaining
high accuracy. Even though many researchers have proposed control flow matching methods, there is still
a trade-off between accuracy and performance. To solve this trade-off, we designed Malfinder, a method
based on approximate matching, which is accurate but slow. To overcome its low performance, we resolve
its performance bottleneck and non-parallelism on three fronts: I-Filter for identical string matching, table
division to exclude unnecessary comparisons with some malware and dynamic resource allocation for efficient
parallelism. Our performance evaluation shows that the total performance improvement is 280.9 times.
1 INTRODUCTION
Antivirus vendors have detected malware through
signature-based detection. However, such malware
detection has become ineffective as malware variant
generation tools have been available (OKane et al.,
2011). Due to the availability of such tools, malware
authors can easily create malware variants that are
slight modifications of existing malware. In addition,
the number of new malware variants has increased at
an exploding pace. According to statistics of the AV-
TEST
1
, approximately 80 million new malware sam-
ples 88% of which are malware variants (Cesare et
al., 2013) appeared in 2013, and this exploding ap-
pearance speed has continued to increase.
Due to the incapability in detecting malware vari-
ants through signature-based detection, Malwise (Ce-
sare et al., 2013) has proposed control flow matching
methods that classify malware variants by measuring
similarities in existing malware samples. Their ap-
proaches are effective in detecting malware variants
because, unlike signatures, control flows of malware
variants are much less changeable. Its authors have
proposed two control flow matching methods. One
of them is exact matching and the other one is ap-
proximate matching. However, there is a trade-off be-
tween the two methods. Exact matching is faster but
less accurate than approximate matching because it
is only necessary to check whether each control flow
1
AV-TEST. http://www.av-test.org
is identical. On the other hand, approximate match-
ing is more accurate but has lower performance since
this method compares all parts of each control flow
in a fine-grained manner. In addition, both neither
method considers parallelism even though many re-
sources are available in recent high performance com-
puters. Therefore, in order to achieve high accuracy
and performance and apply parallelism, we chose
to accelerate approximate matching on our platform,
MN-MATE (Park et al., 2012), which has higher ac-
curacy than exact matching.
This study is an extension of our previous work,
I-Filter, (Kim et al., 2014) which represented I-Filter,
and focus on acceleration of the approximate match-
ing method through fast identical procedure-level
control flow string matching. Our objective in this
study is to devise additional acceleration of approx-
imate matching through database optimization and
efficient parallelism. For database optimization, we
suggest the table division method which reduce un-
necessary comparisons by decreasing the large num-
ber of entries in malware databases because such en-
tries contain malware samples that cannot be simi-
lar. For efficient parallelism, we propose dynamic re-
source allocation for efficient resource utilization in
parallel analysis. We integrate the above components
into our work, Malfinder. As a result, we gained on
average 280.9 times total performance improvements
in our experiments.
Kim T., Hwang W., Kim C., Shin D., Park K. and Park K...
Malfinder: Accelerated Malware Classification System through Filtering on Manycore System.
In Proceedings of the 1st International Conference on Information Systems Security and Privacy, pages 17-26
ISBN: 978-989-758-081-9
Copyright
c
2015 by SCITEPRESS – Science and Technology Publications, Lda. All rights reserved
17
Procedure1
func1(){
Label1:
if(a){
goto Label1;
}
else{
func1();
}
return;
}
Procedure2
func2(){
if(a){
}
else{
while(b){
func1();
}
}
return;
}
Decompiling
Procedure1 : BI{BJB}E{BCB}BR
Procedure2 : BI{B}E{BW{BCB}B}BR
Binary file
Structuring
Control flow Result
Basic Block B
Procedure Call C
Break K
Continue T
Return R
Goto J
If I
Else E
Open Brace {
Close Brace }
Branch Condition: AND A
Branch Condition: OR O
Loop: Pre-tested W
Loop: Post-tested D
Loop: Infinite F
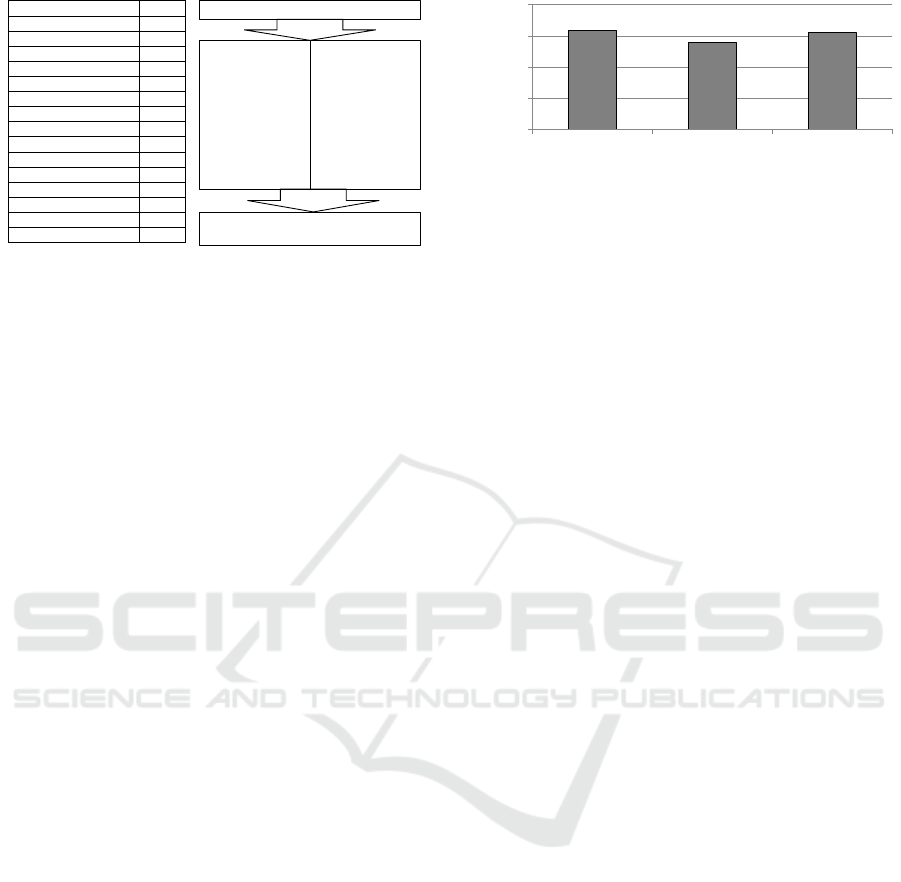
(a) Grammar for structuring (b) Example of conversion
Modified Version
Figure 1: Conversion: Decompiling and Structuring(Cesare
et al., 2010).
2 BACKGROUND
2.1 Conversion and Matching
Malwise (Cesare et al., 2013) proposed procedure-
level control flow matching methods to which we
mainly refer. Its work flow consists of conversion and
similarity measurement.
For conversion, the malware classifier of Malwise
judges whether an input binary is malicious based on
the similarity of control structures between the input
binary and malware samples. In order to measure
similarities of control structures, Malwise represents
them in a structured control flow string (SCFS) form
which expresses control structures in a high-level lan-
guage (Sharir, 1980) is used. To generate SCFSs,
the malware classifier converts malware through three
stages: unpacking, decompiling and structuring. Un-
packing is for extraction of malicious codes hidden
by packers (OKane et al., 2011), decompiling is for
converting the input binary into codes written in a
high-level language, and structuring is for generating
SCFSs from decompiled codes. The malware clas-
sifier uses grammars for the structuring procedure in
Figure 1a and the example of conversion is described
in Figure 1b. After conversion, the malware classifier
measures string-to-string (S2S) similarities between
SCFSs of the input binary and that of pre-analyzed
malware samples in databases. Then, the malware
classifier calculates the set similarity meaning how
many characters of all SCFSs are matched in the right
order by summating and normalizing S2S similarities
(Cesare et al., 2010). Based on the set similarity, the
malware classifier determines whether the input bi-
nary is malicious.
0
20000
40000
60000
3,000 5,000 10,000 20,000
All in one table Average in divided tables
# of Distinct Hash Entries
# of Malware Samples in DB
0
2000
4000
6000
0
2500
5000
7500
10000
12500
15000
17500
20000
22500
25000
27500
30000
32500
35000
37500
40000
42500
45000
47500
50000
# of Malwares
Total # of Characters
0
0.25
0.5
0.75
1
Netsky Roron Klez
Share Ratio of SCFSs
# of Malware Samples in DB
Figure 2: Share ratio of identical SCFSs.
2.2 MN-MATE
We implemented our malware variant classification
system on MN-MATE (Park et al., 2012). MN-
MATE is a resource management system for a many-
core architecture to enhance performance and fairness
among virtual machines (VMs). MN-MATE parti-
tions and balances resources among VMs while con-
sidering NUMA architecture and the changing mem-
ory demands of VMs.
3 MOTIVATION
3.1 Inefficient SCFS Matching
Before measuring set similarities, we need to measure
S2S similarities through character-to-character (C2C)
matching based on the edit distance algorithm. How-
ever, this procedure is the main bottleneck of simi-
larity measurements because C2C matching requires
many computations. To resolve such a performance
bottleneck, we found that there was a potential for im-
provement in matching identical SCFSs. The purpose
of C2C matching is to find similar strings and measure
how much similarity there is between two SCFSs.
When we determine whether SCFSs are identical, it is
necessary to know whether they are identical to each
other but unnecessary to measure how much similar-
ity there is between them because the similarity be-
tween matched identical SCFSs is 100%. This ap-
proach can be frequently applied to C2C matching be-
cause malware variants in the same family share many
identical SCFSs. According to our preliminary ex-
periments, malware variants in the same family share
many identical SCFSs. In Figure 2, an average of
75.7% of identical SCFSs are shared in Netsky, Klez
and Roron.
ICISSP 2015 - 1st International Conference on Information Systems Security and Privacy
18

3.2 Brute-force Malware Comparison
In the similarity measurement procedure, we need to
match SCFSs of an input binary with all pre-analyzed
malware samples in databases. However, the large
number of malware samples causes the performance
bottleneck. In order to reduce such comparison
overhead, a rule to exclude malware samples that
cannot be similar to an input binary before starting
similarity measurements is necessary. Without such
an exclusion rule, it is necessary to compare all
malware samples in databases. This is because they
are possibly similar.
3.3 Non-parallelized Malware Analysis
In 2013, malware authors created about 80 million
malware samples 88% of which are malware vari-
ants, but it is hard to analyze all malware variants
with the optimized methods because of the significant
number of malware samples. However, we can uti-
lize many resources in high performance computers to
gain higher throughput. One way to use all resources
for this purpose is parallelization of analysis which
was not considered in the previous work (Cesare et al.,
2013; Kim et al., 2014). Even though this is a valid
approach to increasing total analysis throughput, this
trial can waste resources without proper management.
Therefore, we need find a way to efficiently use such
resources for optimized parallelism.
4 DESIGN
The design of our system is motivated by three points
as follows: inefficient SCFS matching, brute-force
malware comparison and non-parallelized malware
analysis. In this section, we describe the overview
of our system and then how to solve these problems.
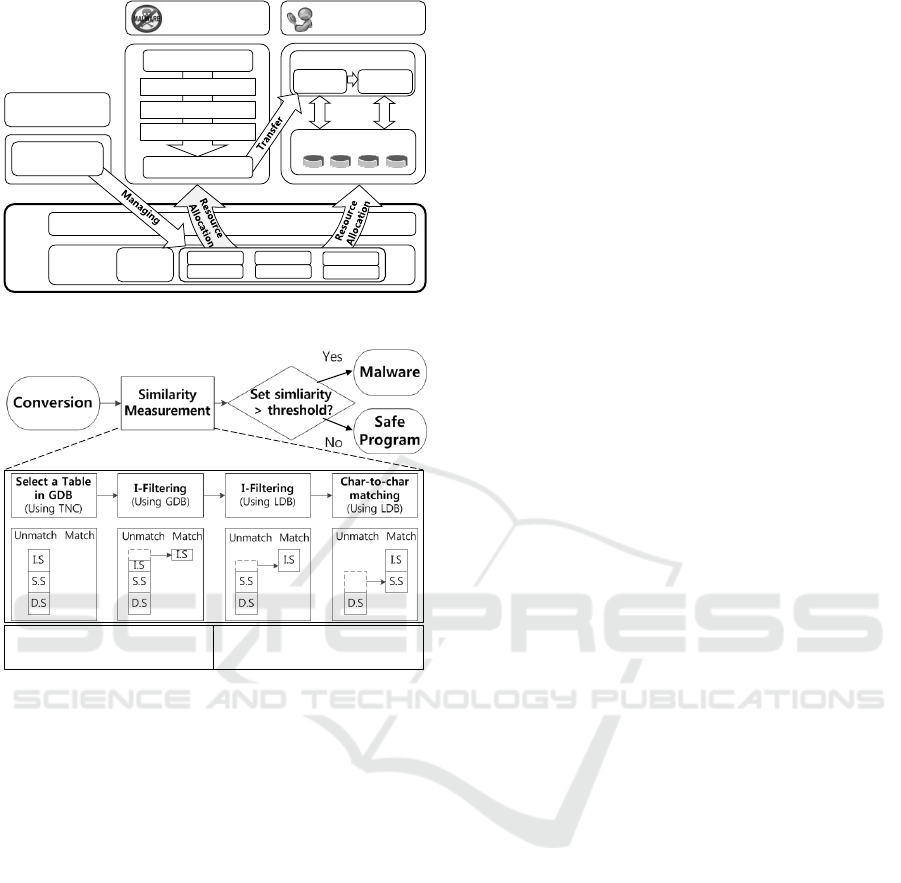
4.1 Overview
We implemented the malware variant classification
system on MN-MATE (Park et al., 2012). Our mal-
ware variant classification system consists of three
parts: Convertor, Analyzer and Resource Manager.
Both Convertor and Analyzer work on VMs but Re-
source Manager works on dom0, the priviledged VM
that can control hypervisor (Paul et al., 2003). We de-
scribe our architecture in Figure 3 and the flow chart
in Figure 4.
Convertor Convertor is responsible for converting in-
put binaries into SCFSs. This conversion task is com-
posed of unpacking, decompiling and structuring. Af-
ter finishing the conversion process, converted SCFSs
are sent to Analyzer.
Analyzer Analyzer plays a role in deciding whether
input binaries are malicious through measuring
set similarities with existing malware samples in
databases. Analyzer uses SCFSs obtained from Con-
vertor for similarity measurements. We designed An-
alyzer with three components: malware databases, I-
Filter and C2C (character-to-character) matcher. Mal-
ware databases consist of multiple tables, and we
store pre-converted SCFSs and their metadata such as
hash values in these tables. The role of I-Filter is to
match identical SCFSs of an input binary with those
in the databases. C2C matcher is responsible for mea-
suring similarities of the remaining SCFSs that are
not matched through I-Filter (Kim et al., 2014). For
malware databases, we use two types of databases:
the global database and local database. We used the
global database to match identical SCFSs through I-
Filter. This database consists of several tables cov-
ering malware samples in certain ranges of the total
number of SCFCs. Each table stores SCFSs and meta-
data of covered malware families, variant names, hash
values and their total numbers of SCFCs of malware
samples. The local database consists of multiple ta-
bles and stores the same data but only that of mal-
ware samples in one malware family. We store in-
dexed hash values in both types of databases to use
I-Filter more efficiently.
Resource Manager Each VM is responsible for con-
version and analysis. However, their workloads vary
according to the situation in which Analyzer does not
work due to there being no SCFSs or Convertor gen-
erates so many SCFSs that Analyzer cannot process
all of them. To prevent such a waste of resources,
Resource Manager allocates a proper amount of re-
sources to each VM. Therefore, we can conserve re-
sources through manipulation of the processing speed
of each VM through resource allocation. Also, we
utilize VCPU pinning to dedicated nodes to enhance
memory access performance through local memory
access instead of remote memory access.
4.2 I-Filter
In Section 3, we point out that S2S matching for iden-
tical SCFSs is inefficient despite the high share ratio
of identical SCFSs. In order to enhance the perfor-
mance of S2S matching, we use I-Filter (Kim et al.,
2014) to match identical SCFSs through hash value
comparisons and then match only remaining SCFSs
through edit distance algorithm. We use CRC-64 for
generation of hash values.
Malfinder: Accelerated Malware Classification System through Filtering on Manycore System
19
Hypervisor
H/W
Resources
Input binary
Unpacking
Decompiling
Malware Database
I-Filter
C2C
Matcher
Analyzer VM
Convertor VM
Dom0
Storage
C2C Matcher : Character-to-character Matcher
Similarity Measurer
Query
for SCFSs
Core
Memory
Core
Memory
Core
Memory
Resource
Manager
SCFSs
Structuring
MN-MATE
Platform
Figure 3: Overview of our system on MN-MATE.
Modified Version
I.S : Identical strings
S.S: Similar strings
D.S : Different strings
GDB : Global database
LDB : Local database
TNC : Total number of SCFCs
Flow Chart
Figure 4: Whole analysis flow chart.
Efficiency of I-Filter can be seen through compar-
isons between time complexities of both methods. In
previous approach, all matching is done through edit
distance algorithm. Its time complexity between two
SCFSs is O(mn). Both m and n are lengths of SCFSs,
and their minimum value is 10 (Cesare et al., 2010).
In order to accelerate matching for SCFSs, all SCFSs
are stored in the BK-tree (Baeza-Yates et al., 1998)
indexed malware database in the previous work (Ce-
sare et al., 2013). However, it is time-consumming
to find valid SCFSs because each character of SCFSs
should be checked. On the other hand, the search-
ing time complexity of I-Filtering is O(log s) where
s is the number of SCFSs. For S2S matching for
each SCFS, each matching is processed through hash
value matching whose time complexity is O(1) with-
out character-to-chracter comparison. In addition, the
number of comparions is O(log s) because we stored
the hash values in B-tree. Therefore, we can induce
the time complexity for finding one SCFS is O(log s)
from O(1)O(log s) = O(log s). However, checks for
identicalness are required to prevent hash collisions
for all SCFSs whose hash values are identical. The
time complexity for hash collision checking is O(m)
which is proportional to the lower length m in a string
pair.
4.3 Table Division
When we match SCFSs in the global database, unnec-
essary comparisons with malware samples that cannot
be similar cause redundant overhead costs. In order to
reduce such costs, we make a rule for excluding mal-
ware samples that cannot be similar before starting
similarity measurements. Because the set similarity
is directly related to the total number of SCFCs, we
can exclude such malware samples through dividing
tables in the global database. Therefore, we can ex-
clude many malware candidates through comparisons
of the total number of SCFCs of an input binary. We
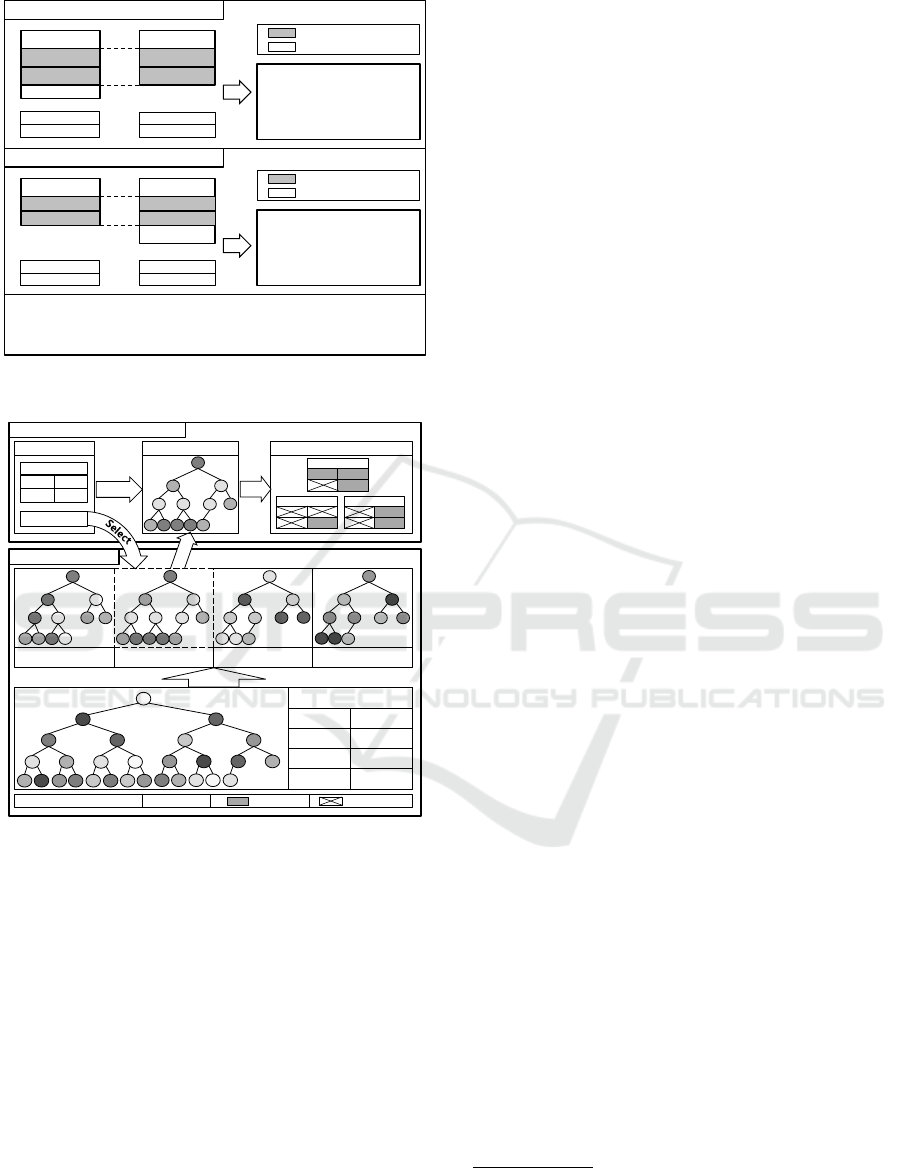
describe such cases in Figure 5. In the first case, mal-
ware x can be similar to malware y if all their SCFSs
are matched. In the second case, malware x and y
however are definitely dissimilar even if malware x
and y consist of only identical SCFSs. Thus, malware
x is eligible for comparison but malware y is ineligi-
ble according to the malware exclusion policy.
In order to apply the above policy, we divide the
table of the global database into smaller tables accord-
ing to the total number of SCFCs. Because our di-
vided tables store only possibly similar malware sam-
ples, it is possible to compare a smaller number of
entries. We describe the example of table division in
Figure 6. Before we analyze input SCFSs, we select
one of tables in the global database based on the to-
tal number of SCFCs of each input binary. Although
this selection may result in a small cost, we can gain
greater performance benefits from it. Since each mal-
ware has on average 94 SCFSs in our malware sam-
ples, we can avoid comparisons of 94 SCFSs of the in-
put binary with those of malware samples that cannot
be similar in databases through one table selection.
Through table division, we can reduce comparisons
due to reduced depths of B-trees and I/O requests for
loading unnecessary malware data from databases.
However, table division should guarantee that
all possibly similar malware samples are in each di-
vided table. This guarantee is based on the set sim-
ilarity threshold value, 0.6 (Cesare et al., 2010). As
described in Figure 6, if the selected table covers mal-
ware D, E and F with the total number of SCFCs
from 55 to 80, this table should have malware sam-
ples with the total number of SCFCs from 55 by 0.6
to 80 by 1.67. In such cases, we call the total number
of SCFCs from 55 to 80 the cover range and from 33
to 55 and from 80 to 134 the guarantee range. Mal-
ware samples covered by guarantee range should be
ICISSP 2015 - 1st International Conference on Information Systems Security and Privacy
20
NC = The number of SCFCs in one string
Min = Minimum value for set similarity = 0.6
TNC = The total number of SCFCs in one malware
S
x
= Asymmetric similarity (Binary x to another binary)
Malware x
Possible max set similarity
= SxSy = 0.8 > Min
Possibly Similar!!
Possibly Matched Case
Malware y
TNC : 10
Sx : 0.8
Sy : 1.0
TNC : 8
Malware x
Possible max set similarity
= SxSy = 0.59 < Min
Cannot be similar!!
Unmatched Case
Malware y
TNC : 10
Sx : 1.0
Sy : 0.59
TNC : 17
: Matched
: Unmatched
: Matched
: Unmatched
: Matched : Unmatched
NC : 2
NC : 4 NC : 4
NC : 4 NC : 4
NC : 5
NC : 7
NC : 5
NC : 5
NC : 5
Figure 5: Max similarity according to the total number of
SCFCs.
A
H E
C E F G
D
B H
B
C
D
F
A
F G
G
C B
H
D A
E
G
B
D
C
TNC list
A : 6 E : 100
B : 12 F : 133
C : 33 G : 140
D : 91 H : 167
TNC Range 20-55 TNC Range 55-80 TNC Range 80-100
C
C
C
A
A
B
B B
B
C
A
D
E
F F
D
E
D
D
E
F
G
F
G G
H
F
H H
G
F
Selected Table
Input binary
str1
str2
str3 str4
Input SCFSs
Division
B
C
B
D D
D
D
C B
B
C
C
Matching
TNC : Total # of SCFCs
Matched List
Result
str2
str3
str1
Malware B
str1
str4
Malware D
str2
Malware C
str : string : Matched : Unmatched
Similarity Measurement
TNC : 47
Table Division
TNC Range : 10-20
B
C
B
D D
D
D
C B
B
C
C
Figure 6: An example of table division application.
included in the divided tables. Otherwise, compari-
son only with a table cannot guarantee that all pos-
sibly similar malware samples are stored. From the
perspective of performance, we need to divide a table
into smaller tables because the number of hash entries
can change according to sizes of cover ranges. How-
ever, excessive table division causes storage redun-
dancy for guarantee ranges. Furthermore, they can
be much larger than cover ranges if the cover ranges
are too small. Therefore, we set the cover range from
one of 3,000, 10,000 and 20,000 and dynamically
divide tables to avoid excessive storage redundancy
while maintaining a certain level of performance. If
the difference in the number of hash entries is smaller
than 110% of the total number of hash entries with a
larger cover range, we set the larger cover range since
this 10% difference does not cause meaningful perfor-
mance degradation. After applying our table division
policy, storage redundancy is not large compared to
storage capacity of HDD. As a result of table divi-
sion, depths are reduced from 50% to 80% and their
average depth is 33%.
4.4 Dynamic Resource Allocation
Our system consists of two main processing parts,
Convertor and Analyzer. We describe this system in
Figure 7. Because processing speeds vary according
to which binaries are analyzed, unbalanced workloads
can waste resources. To prevent such a situation, we
dynamically allocate cores according to the number
of converted binaries. We define the value Q as the
representation of the number of such binaries for dy-
namic core allocation modeling. In detail, (1) of Fig-
ure 7 shows that Resource Manager allocates VCPUs
to Convertor and operates one more convertor pro-
cess since there is no more converted input binaries
for additional analysis. On the other hand, (2) of Fig-
ure 7 shows the case in which Q value higher than
the threshold value indicates too many binaries were
converted. In this case, Resource Manager reallocates
VCPUs to Analyzer and operates one more analyzer
process according to CPU usage. For more efficient
memory utilization, we assign memory on one node
to each VM and set the VCPU affinity to the node in
order to avoid remote memory access.
4.5 Implementation
Convertor. Convertor is responsible for unpacking,
decompiling and structuring. For unpacking, we use
the unpacking function of UPX
2
because malware au-
thors widely use it to pack malware programs. After
the unpacking process, we decompile unpacked bina-
ries using REC decompiler
3
. Then, we convert de-
compiled binaries into SCFSs using the rule in Fig-
ure 1a.
Analyzer. This module measures similarities be-
tween input binaries and malware samples. We de-
scribe the detailed procedure in algorithms 1 and 2.
The matching process starts with the global database.
We first select a table in the global database based
on the total number of input SCFCs. With the
selected global database, we match only identical
SCFSs through I-Filter. In this step, we process near
unique strings first and then match duplicated SCFSs.
Because such near unique strings are not normally
2
Ultimate Packer for eXecutables.
http://upx.sourceforge.net
3
Reverse Engineering Compiler (REC).
http://www.backerstreet.com
Malfinder: Accelerated Malware Classification System through Filtering on Manycore System
21

Convertor
Processes
C C
C
Converted
Malware
Queue
Convertor VM
Analyzer
Processes
: Empty
: Occupied
Q : # of converted malwares in queue
threshold : Standard value for core reallocation
Analyzer VM
C
Core
C C
C
C
Core
Database
(1) Q < threshold
(2) Q > threshold
Figure 7: Dynamic core allocation model.
shared, they are useful in determining a specific mal-
ware candidate. If the set similarity exceeds the set
similarity threshold T, matching processes are per-
formed on the local database whose tables cover re-
spective malware families. If the highest set simi-
larity is lower than min t even after all SCFSs are
processed, we consider this binary unmalicious. Oth-
erwise, the top five candidate malware samples with
similarities higher than the others are selected. With
the local database, we apply I-Filter first because
all SCFSs could not be matched through I-Filtering.
Then, the similarity of the remaining SCFSs is mea-
sured through C2C matching. We consider the target
binary is malicious if its similarity is larger than T.
In the above procedure, we define several param-
eters. We choose min t as 0.1 and determine the num-
ber of candidates as 5 based on our experiments. We
use 0.9 for T and 0.6 for t as used in related work
(Cesare et al., 2010). However, we can change these
values according to additional experiments.
Resource Manager In Resource Manager, we use
the Q variable to predict workloads between Con-
vertor and Analyzer. We currently allocate an ad-
ditional core to the Analyzer VM when Q is higher
than 40 and to the Convertor VM when Q is lower
than 20. With these values, there was no waste of
resources, such as too many converted SCFSs or no
SCFSs for similarity measurements, during our ex-
periments. If we increase this value, the occurrence
wasted resources will be reduced. In this case, even
though more binaries will not be analyzed, its effect is
negligible in the long run. However, we should con-
sider that the most important factor for threshold val-
ues of Q is whether their values can guarantee avoid-
ance of unbalanced resource distribution. We can
change threshold values considering such conditions.
Algorithm 1: Similarity measurement.
freq : duplication level of SCFSs
gtb(freq) : selected global table
ltb(m) : local table for one malware family
m : a malware
i : an input binary
cand : similar malware candidate
pcands : possibly similar malware samples
matching : update similarity using algorithm2
scfs : unmatched SCFS
TNC : total number of SCFCs
T : set similarity threshold
minT : safe program threshold
id : identical matching
app : approximate matching
setSim[m] : set similarity with a malware
Measure TNC of input and select gtb using TNC;
while scfs
i
in input SCFSs do
while scfs
m
in gtb(unique) do
matching(scfs
i
, scfs
m
, setSim[m], id)
if any setSim[m] ≥ T then
pcands ← m
end
end
end
while scfs
i
in input SCFSs do
while scfs
m
in gtb(duplicate) do
matching(scfs
i
, scfs
m
, setSim[m], id)
if any setSim[m] ≥ T then
pcands ← m
end
end
end
if any setSim[m] ≤ min t then
return Result(Safe, 0)
end
pcands ← Top5MostSimlar
while cand in pcands do
while scfs
i
in input SCFSs do
while scfs
m
in ltb(mcand) do
matching(scfs
i
, scfs
m
, setSim[cand], id)
end
end
while scfs
i
in input SCFSs do
while scfs
m
in ltb(mcand) do
matching(scfs
i
, scfs
m
, setSim[cand],
app)
end
end
if setSim[m] ≥ T then
return Result(cand, setSim[cand])
end
end
return Result(Safe, 0)
ICISSP 2015 - 1st International Conference on Information Systems Security and Privacy
22

Algorithm 2: Match.
m : a malware
S
i
: similarity from input to malware
S
m
: similarity from malware to input
scfsSim : similarity of a SCFS pair
setSim[m] : set similarity between input and malware
nc[scfs] : the number of characters in scfs
T : string-to-string similarity threshold
hash[scfs] : hash value of a SCFS
if matching method == identical then
if hash[scfs
i
] == hash[scfs
m
] then
S
i
← S
i
+ nc[scfs
i
]
S
m
← S
m
+ nc[scfs
m
]
setSim[m] ← S
i
· S
m
end
else
Measure scfsSim between scfs
i
and scfs
m
;
if scfsSim ≥ T then
S
i
← S
i
+ nc[scfs
i
] · scfsSim
S
m
← S
m
+ nc[scfs
m
] · scfsSim
setSim[m] ← S
i
· S
m
end
end
5 EXPERIMENT
This section presents module performance improve-
ments, total performance improvements, similarities
between malware variants and validation of safe pro-
gram threshold. The experimental environment con-
sists of the AMD Opteron Processor 6282SE 64 core
2.6Ghz, 128GB RAM, SAS 10kbytes HDD, Cent OS
6.4 64bit with Kernel 3.8.2 version, MN-MATE (Park
et al., 2012) and MySQL 14.14 for the database, but
we utilized 16 cores and 16GB RAM. We imple-
mented our databases on MyISAM
4
which is a type
of disk-based database. On the other hand, Malwise
(Cesare et al., 2013) consists of BK-tree (Baeza-Yates
et al., 1998) indexed memory databases. In all exper-
iments, Malfinder refers to application of I-Filter, Ta-
ble division and Dynamic Resource Allocation. But
Dynamic Resource Allocation is not applied to sin-
gle process experiments. Also, MN-MATE means
that we experimented on MN-MATE. Without MN-
MATE, we experimented on Xen 4.2.1. Finally, we
used 3,000 malware samples
5
and generated addi-
tional malware variants using the code mutation tool
6
.
4
MySQL reference. http://dev.mysql.com/doc/refman/
5.7/en/index.html
5
Offensive computing.
http://www.offensivecomputing.net
6
Code pervertor. http://z0mbie.host.sk
5.1 Module Performance Improvements
In this section, we evaluate the performance of each
module in malware variant classification systems.
This evaluation does not reflect the effect of dynamic
core allocation because it focuses on each module
with a single core, but, we consider the effect of
VCPU pinning. First, we compare the performance of
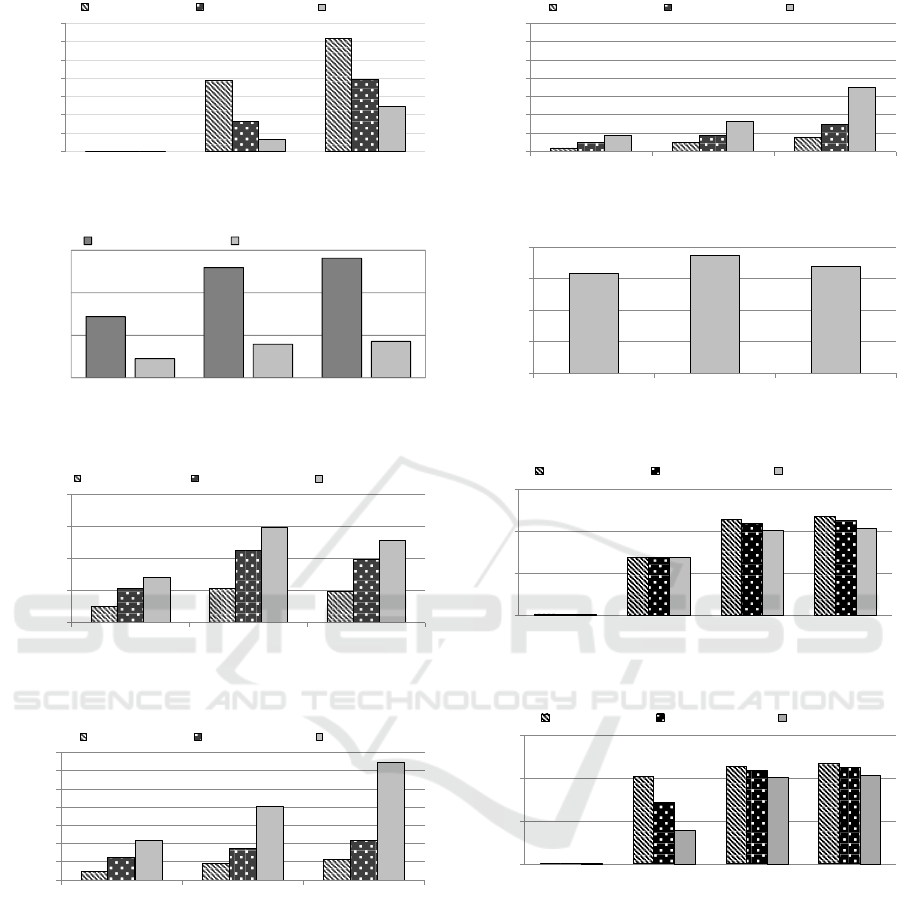
analyzer in Figure 8. For the Analyzer performance,
the performance improvements between approximate
matching of Malwise (Cesare et al., 2013) and
application of all of our techniques on MN-MATE
are from 512 to 657 times. For comparison between
I-Filter application and Malfinder, the performance
improvements are from 60% to 272% and the
improvement increases as the number of malware
samples increases. These improvements are largely
from table division because table division reduces on
average 33% numbers of table entries for identical
SCFSs matching procedure as described in Figure 9.
We describe the performance improvements
in Figure 10, 11 and 12. We can discern several
performance trends in these figures. The trends of
performance improvements are different from the
malware families. This difference results mainly
from the number of SCFCs in each malware and
each string. For Malwise, the trend of performance
difference between malware families results from
the fact that computation time depends on string
matching measurements. On the other hand, our
approach relies on the number of hash entries in
databases.
Finally, we demonstrate the performance of Con-
vertor in Figure 13. There is no performance variation
according to the number of malware samples in the
databases because the operation is independent of
databases. With a single core, Convertor can convert
on average 0.365 input malware binaries per second.
As the speed of Analyzer increases, the performance
of Convertor creates a larger bottleneck. Moreover,
its performance trend is different from Analyzer
because it depends on how many instructions; not
only branch instructions but also other types of
instructions, variables and other factors are included.
This different trend of processing speed causes
unbalanced workload distributions even with perfect
static core allocation. This is why core allocation, a
part of dynamic resource allocation, is necessary.
5.2 Total Performance Improvements
In this section, we evaluate the total performance
of the malware variant classification systems. We
Malfinder: Accelerated Malware Classification System through Filtering on Manycore System
23
Total perf 1:1
Analysis Performance
(#of Analysis/Sec)
Analysis Method
0
1
2
3
4
5
6
3000 sample 10000 sample 20000 sample
Analyzer 모듈 별
우리 workload 적용
Analysis Performance
(#of Analysis/Sec)
Malware family
0.006
1.926
3.077
0.003
0.824
1.972
0.002
0.328
1.219
0
0.5
1
1.5
2
2.5
3
3.5
3000 sample 10000 sample 20000 sample
Total perf 3:1
Analysis Performance
(#of Analysis/Sec)
Analysis Method
0
1
2
3
4
5
6
3000 sample 10000 sample 20000 sample
0.024
0.011
0.008
4.083
2.872
1.553
4.093
4.001
3.983
4.691
4.492
4.147
0.052
0.021
0.016
2.742
2.728
2.725
2.772
2.752
2.739
4.691
4.492
4.147
Analysis method
Analysis method
Analysis method
Analysis Performance
(#of Analysis/Sec)
Analysis Performance
(#of Analysis/Sec)
Analysis Performance
(#of Analysis/Sec)
Malwise approx.
I-Filter
Malfinder
Malwise approx.
I-Filter
Malfinder
Malfinder+MN-MATE
Malwise approx.
I-Filter
Malfinder
Malfinder+MN-MATE
Figure 8: Analyzer performance with a single core
# of Distinct Hash Entries
# of Malware Samples in DB
0
2000
4000
6000
0
2500
5000
7500
10000
12500
15000
17500
20000
22500
25000
27500
30000
32500
35000
37500
40000
42500
45000
47500
50000
# of Malwares
Total # of Characters
0
0.25
0.5
0.75
1
Netsky Roron Klez
Share Ratio of SCFSs
# of Malware Samples in DB
0
20000
40000
60000
3,000 10,000 20,000
All in one table Average in divided table
Figure 9: The number of hash entries in each database.
0
200
400
600
800
netsky roron klez
3000 samples 10000 samples 20000 samples
Average Analysis Time
(Sec)
Malware family
analyzer (i-filter)
Average Analysis Time
(Sec)
Malware family
0
1
2
3
4
5
6
7
netsky roron klez
3000 sample 10000 sample 20000 sample
Analyzer (Apporx)
Average Analysis Time
(Sec)
Malware family
0
1
2
3
4
5
6
7
netsky roron klez
3000 sample 10000 sample 20000 sample
analyzer (malfinder)
패밀리당 analyzer
Average Analysis Time
(Sec)
Average Analysis Time
(Sec)
Malware family
Malware family
Malware family
Figure 10: Analyzer performance with approximate match-
ing of Malwise.
0
200
400
600
800
netsky roron klez
3000 samples 10000 samples 20000 samples
Average Analysis Time
(Sec)
Malware family
analyzer (i-filter)
Average Analysis Time
(Sec)
Malware family
0
1
2
3
4
5
6
7
netsky roron klez
3000 sample 10000 sample 20000 sample
Analyzer (Apporx)
Average Analysis Time
(Sec)
Malware family
0
1
2
3
4
5
6
7
netsky roron klez
3000 sample 10000 sample 20000 sample
analyzer (malfinder)
패밀리당 analyzer
Average Analysis Time
(Sec)
Average Analysis Time
(Sec)
Malware family
Malware family
Malware family
Figure 11: Analyzer performance with approximate match-
ing and I-Filter.
applied our Convertor to Malwise (Cesare et al.,
2013) because Malwise does not have dynamic
resource allocation functions. We randomly choose
malware samples for our experiments and show the
performance evaluation in Figure 14 and 15.
Performance improvements of Malfinder with
MN-MATE are on average 280.9 times compared
to approximate matching proposed in Malwise
and 71% improvements compared to only I-Filter
application. Although improvements are mostly
from I-Filter for matching identical SCFSs and
0
200
400
600
800
netsky roron klez
3000 samples 10000 samples 20000 samples
Average Analysis Time
(Sec)
Malware family
analyzer (i-filter)
Average Analysis Time
(Sec)
Malware family
0
1
2
3
4
5
6
7
netsky roron klez
3000 sample 10000 sample 20000 sample
Analyzer (Apporx)
Average Analysis Time
(Sec)
Malware family
0
1
2
3
4
5
6
7
netsky roron klez
3000 sample 10000 sample 20000 sample
analyzer (malfinder)
패밀리당 analyzer
Average Analysis Time
(Sec)
Average Analysis Time
(Sec)
Malware family
Malware family
Malware family
Figure 12: Analyzer performance with Malfinder.
Conversion family별로
(밑은 자르기 비교용)
0
0.5
1
1.5
2
netsky roron klez
Conversion Time (Sec)
Malware family
0
0.5
1
1.5
2
2.5
netsky roron klez
Only I-Filter I-Filter + Table Div. I-Filter + Table Div. + Local Mem
Average Analysis Time
(Sec)
Malware family
Figure 13: Convertor performance.
Total perf 1:1
Analysis Performance
(#of Analysis/Sec)
Analysis Method
Analyzer 모듈 별
우리 workload 적용
Analysis Performance
(#of Analysis/Sec)
Malware family
0.006
1.926
3.077
0.003
0.824
1.972
0.002
0.328
1.219
0
0.5
1
1.5
2
2.5
3
3.5
3000 sample 10000 sample 20000 sample
Total perf 3:1
Analysis Performance
(#of Analysis/Sec)
Analysis Method
0.024
0.011
0.008
4.083
2.872
1.553
0.052
0.021
0.016
2.742
2.728
2.725
4.551
4.359
4.023
4.691
4.492
4.147
Analysis method
Analysis method
Analysis method
Analysis Performance
(#of Analysis/Sec)
Analysis Performance
(#of Analysis/Sec)
Analysis Performance
(#of Analysis/Sec)
Malwise approx.
I-Filter
Malfinder
Malwise approx.
I-Filter
Malfinder
Malfinder+MN-MATE
Malwise approx.
I-Filter
Malfinder
Malfinder+MN-MATE
0
2
4
6
3000 sample 10000 sample 20000 sample
4.551
4.359
4.023
4.691
4.492
4.147
0
2
4
6
3000 sample 10000 sample 20000 sample
Figure 14: Total performance (50% of resource to Conver-
tor and 50% of resource to Analyzer).
Total perf 1:1
Analysis Performance
(#of Analysis/Sec)
Analysis Method
Analyzer 모듈 별
우리 workload 적용
Analysis Performance
(#of Analysis/Sec)
Malware family
0.006
1.926
3.077
0.003
0.824
1.972
0.002
0.328
1.219
0
0.5
1
1.5
2
2.5
3
3.5
3000 sample 10000 sample 20000 sample
Total perf 3:1
Analysis Performance
(#of Analysis/Sec)
Analysis Method
0.024
0.011
0.008
4.083
2.872
1.553
0.052
0.021
0.016
2.742
2.728
2.725
4.551
4.359
4.023
4.691
4.492
4.147
Analysis method
Analysis method
Analysis method
Analysis Performance
(#of Analysis/Sec)
Analysis Performance
(#of Analysis/Sec)
Analysis Performance
(#of Analysis/Sec)
Malwise approx.
I-Filter
Malfinder
Malwise approx.
I-Filter
Malfinder
Malfinder+MN-MATE
Malwise approx.
I-Filter
Malfinder
Malfinder+MN-MATE
0
2
4
6
3000 sample 10000 sample 20000 sample
4.551
4.359
4.023
4.691
4.492
4.147
0
2
4
6
3000 sample 10000 sample 20000 sample
Figure 15: Total performance (75% of resource to Conver-
tor and 25% of resource to Analyzer).
table division, the performance gain is limited by
Convertor performance and a waste of resources due
to unbalanced resource distribution. However, our
system can balance the performance of each VM with
our dynamic allocation.
5.3 Similarity of Malware Variants
In this experiment, we measure similarities using our
approach. To determine whether input binaries were
malicious, we used the same set similarity threshold
ICISSP 2015 - 1st International Conference on Information Systems Security and Privacy
24

value, 0.6, used in the related work (Cesare et al.,
2013). Table 1 shows similarities between malware
variants in Klez, Roron and Netsky malware families.
Table 1: Similarities between Malware Variants.
NC = The number of SCFCs in one string
Min = Minimum value for set similarity = 0.6 [3]
TNC = The total number of SCFCs in one malware
S
x
= Asymmetric similarity (Binary x to another binary)
Malware x
Possible Max set Similarity
= SxSy = 0.8 > Min
Possibly Similar!!
Possibly Matched Case
Malware y
TNC : 10
Sx : 0.8
Sy : 1.0
TNC : 8
Malware x
Possible Max set Similarity
= S
xSy = 0.59 < Min
Cannot be similar!!
Unmatched Case
Malware y
TNC : 10
Sx : 1.0
Sy : 0.59
TNC : 17
: Matched
: Unmatched
: Matched
: Unmatched
: Matched : Unmatched
NC : 2
NC : 4 NC : 4
NC : 4 NC : 4
NC : 5
NC : 7
NC : 5
NC : 5
NC : 5
12 25 35 37 ao b39 b50
12 0.5 0.53 0.53 0.66 0.5 0.39
25 0.5 0.84 0.89 0.56 0.93 0.63
35 0.53 0.84 0.94 0.64 0.9 0.63
37 0.53 0.89 0.94 0.6 0.95 0.63
ao 0.66 0.56 0.64 0.6 0.57 0.43
b39 0.5 0.93 0.9 0.95 0.57 0.63
b50 0.39 0.63 0.63 0.63 0.43 0.63
Roron
a b c d e g h i
a 0.73 0.91 0.65 0.5 0.49 0.5 0.45
b 0.73 0.8 0.87 0.54 0.53 0.54 0.52
c 0.91 0.8 0.7 0.5 0.49 0.5 0.45
d 0.65 0.87 0.7 0.52 0.5 0.52 0.51
e 0.5 0.54 0.5 0.52 0.94 0.91 0.91
g 0.49 0.54 0.49 0.5 0.94 0.93 0.92
h 0.5 0.54 0.5 0.52 0.91 0.93 0.99
i 0.45 0.52 0.45 0.51 0.91 0.92 0.99
Klez
ab b c k p u w x
ab 0.74 0.84 0.91 0.64 0.75 0.7 0.6
b 0.74 0.76 0.72 0.54 0.58 0.55 0.53
c 0.84 0.76 0.86 0.6 0.67 0.63 0.59
k 0.91 0.72 0.86 0.61 0.7 0.66 0.58
p 0.64 0.54 0.6 0.61 0.68 0.6 0.88
u 0.75 0.58 0.67 0.7 0.68 0.85 0.64
w 0.7 0.55 0.63 0.66 0.6 0.85 0.57
x 0.6 0.53 0.59 0.58 0.88 0.64 0.57
Netsky
According to our experiments, Klez, Roron and
Netsky had 43, 62, 66 percent matching rates. As the
matching rates increase, new malware variants will
more probably be classified. However, we still can
classify malware variants with low matching rates.
For instance, the matching rates of the Klez family
were only 43 percent. However, let us suppose a,
b, c and d Klez variants are group A and the other
ones, e, g and i, Klez variants, are group B. In this
case, one malware sample from group A and the
other one from group B are enough to classify all
Klez malware variants in Table 1. But, there is more
chance to classify unseen malware programs with
higher matching rates.
Furthermore, we should compare our similarity
results since the purpose of our work is to accelerate
Malwise. However, because we use REC decompiler
which is different from Malwise (Cesare et al., 2013),
we measure similarities in both Malwise and our
Conversion family별로
(밑은 자르기 비교용)
0
0.5
1
1.5
2
netsky roron klez
Conversion Time (Sec)
Malware family
3247
3249
3251
3253
3255
3257
3259
3261
3263
0 0.1 0.2 0.3 0.4 0.5 0.6 0.7 0.8 0.9 1
# of Normal Programs
Similarities with Malwares
# of Safe Programs
Similarities with Malwares
3233
14
5
2
1
0 0
1
0
1000
2000
3000
4000
0 0.0 - 0.05 0.05 - 0.1 0.1 - 0.3 0.3 - 0.5 0.5 - 0.7 0.7 - 0.9 0.9 - 1.0
Figure 16: Similarity between safe programs and malwares.
approach with REC decompiler. As a result, most
similarities are identical, and they are lower than
0.01, even if the similarities are different. The reason
for this small difference is that we match identical
SCFSs first and then similar SCFSs but Malwise
matches similar SCFSs.
5.4 Validity of Safe Program Threshold
As we mentioned in implementation of Analyzer, we
use a safe program threshold, 0.1. If the set similarity
is lower than 0.1, we consider the input as a safe pro-
gram after matching identical SCFSs with the global
database. To validate our parameter, we measure sim-
ilarities of 3,256 safe programs from the Windows
system folders with malware samples. The result of
our experiments confirm that our threshold value is
valid because set similarities of only 0.0012% of safe
programs exceeded 0.1 as shown in Figure 16.
6 RELATED WORK
Malware classification through matching control
flows has been proposed in order to solve the prob-
lem of not being able to detect malware variants. Of
various analysis approaches, one of them is to match
SCFSs of binaries (Cesare et al., 2013). The authors
represented procedure-level control flows in a SCFS
form and measure similarities to existing malware
samples in databases. If the most similar malware
is larger than the threshold value, the input binary is
considered malicious. They suggested two matching
methods: exact matching and approximate matching.
However, exact matching has a lower accuracy, and
approximate matching has a lower performance.
To increase the performance of string matching,
bioinformatic researchers developed the fast string
matching method to find identical strings to which
proteins were converted. However, the conven-
tional character-to-character string matching is time-
consuming due to large string sizes. In order to
resolve this performance bottleneck, they proposed
Malfinder: Accelerated Malware Classification System through Filtering on Manycore System
25

short filtering (Li et al., 2006). According to this al-
gorithm, if a string shares a certain number of sub-
strings, the pair is considered identical. Consequently,
they could skip many character-to-character compar-
isons in the middle of matching processes. However,
this approach is not applicable to matching malware
programs because patterns of substrings in SCFSs de-
pend on variable authors’ coding styles.
From the view point of parallelism and resource
management, there have been several approaches for
large workload distributions in scientific calculation,
such as matrix calculation (Gusev et al., 2012). It dis-
tributes workloads to multiple VMs. However, we
distribute VCPUs instead of workloads. In an ap-
proach similar to our work, some researchers have
proposed dynamic resource allocation (Kundu et al.,
2010). These studies model workloads using resource
usages, such as CPU usage, memory usage and so
on. Our work utilizes an easier modeling variable, Q,
which indicates how many workloads are distributed
as well as CPU usage.
7 CONCLUSION
Our main goal was to accelerate approximate match-
ing, which cannot classify numerous malware vari-
ants, its performance is too low. To accomplish our
objective, we proposed Malfinder with I-Filter, table
division and dynamic resource allocation which fo-
cuses on acceleration of Analyzer and apply them in-
crementally. As a result, we gained the total perfor-
mance improvement of on average 280.9 times in our
experiments; especially, the performance improve-
ment of Analyzer is 593.2 times on average.
ACKNOWLEDGEMENT
This work was supported by Ministry of Knowl-
edge Economy, Republic of Korea (Project No.
10035231).
REFERENCES
Baeza-Yates, R. and Navarro, G. (1998). Fast Approxi-
mate String Matching in a Dictionary. In Proceedings
of A South America Symposium on String Processing
and Information Retrieval, SPIRE 1998, pages 14-22,
IEEE.
Cesare, S. and Xiang, Y. (2010). Classification of Malware
Using Structured Control Flow. In Proceedings of
Australasian Symposium on parallel and Distributed
Computing, AusPDC 2010, pages 61-70, ACM.
Cesare, S., Xiang, Y. and Zhou, W. (2013). Malwise–An Ef-
fective and Efficient Classification System for Packed
and Polymorphic Malware. IEEE Transactions on
Computers, 62(6):1193-1206.
Gusev, M. and Ristov, S. (2012). Matrix multiplication per-
formance analysis in virtualized shared memory mul-
tiprocessor. In Proceedings of 35th International Con-
vention, MIPRO 2012, pages 251-256, IEEE.
Kephart, J.O. and Arnold, W.C. (1994). Automatic Ex-
traction of Computer Virus Signatures. Virus Bulletin
Conference, 1994, pages 178-184.
Kim, T., Hwang, W. Park, K. W. and Park, K. H. (2014).
I-Filter: Identical Structured Control Flow String Fil-
ter for Accelerated Malware Variant Classification. In
Proceedings of International Symposium on Biomet-
rics and Security Technologies, ISBAST 2014, IEEE.
Kundu, S., Rangaswami, R., Dutta, K. and Zhao, M. (2010).
Application performance modeling in a virtualized
environments. In Proceedings of 16th International
Symposium on High Performance Computer Architec-
ture, HPCA 2010, pages 1-10, IEEE.
Li, W. and Godzik, A. (2006). Cd-hit: a fast program
for clustering and comparing large sets of protein or
nucleotide sequences. Bioinformatics, 22(13):1658-
1659.
OKane, P., Sezer, S. and McLaughlin, K. (2011). Obfusca-
tion: The Hidden Malware. IEEE Security & Privacy,
9(5):41-47.
Park K. H., Park S. K., Hwang W., Seok H., Shin D. J., and
Park K. W. (2012). Resource Management of Many-
cores with a Hierarchical and a Hybrid Main Memory
for MN-MATE Cloud Node. In Proceedings of Eighth
World Congress on Services, SERVICES 2012, page
301-308, IEEE.
Paul B., Boris D., Keir F., Steven H., Tim H., Alex H., Rolf
N., Ian P., Andrew W. (2003). Xen and the art of virtu-
alization. In Proceedings of the 19th ACM symposium
on Operating systems principles, SOSP 2003, pages
164-177, ACM.
Sharir, M. (1980). Structural Analysis : A new approach to
flow analysis in optimizing compiler. Computer Lan-
guages, 5(3-4):141-153.
Ukkonen, E. (1986). Algorithms for approximate string
matching. Information and Control, 61(1-3):100-118.
ICISSP 2015 - 1st International Conference on Information Systems Security and Privacy
26
