
Physiological Measurement on Students’ Engagement in a
Distributed Learning Environment
Chen Wang and Pablo Cesar
Centrum Wiskunde and Informatica, Amsterdam, Netherlands
Keywords: E-Learning, Surveys, GSR Sensors, Students’ Engagement.
Abstract: Measuring students’ engagement in a distributed learning environment is a challenge. In particular, a
teacher gives a lecture at one location, while at the same time the remote students watch the lecture through
a display screen. In such situation, it is difficult for the teacher to know the reaction at the remote location.
In this paper, we conducted a field study to measure students’ engagement by using galvanic skin response
(GSR) sensors, where students simultaneously watched the lecture at the two locations. Our results showed
the students’ GSR response was aligned with the surveys, which means that during a distributed learning
environment, GSR sensors can be used as an indicator on students’ engagement. Furthermore, our user
studies resulted in non-engaging student learning experiences that would be difficult obtained at a lab
condition. Based on the findings, we found that the patterns of GSR readings were rather different when
compared to the previous relevant studies, where users were engaged. In addition, we noticed that the
density of GSR response at the remote location was higher when compared to the one at the lecture room.
We believe that our studies are beneficial on physiological computing, as we first presented the patterns of
GSR sensors on non-engaging user experiences. Moreover, as an alternative method, GSR sensors can be
easily implemented in a distributed learning environment to provide feedback to teachers.
1
INTRODUCTION
E-learning technology has effectively changed the
lecture paradigm, and has provided more flexibility
to let people choose their preferable time to follow
recorded lectures (Foertsch, Moses, Strikwerda and
Litzkow, 2002). Furthermore, the pace of technology
for use in computing education is staggering, as we
have seen, during the last five years, the following
tools/ websites have completely transformed the way
of teaching: Piazza, Google Docs, YouTube, Doodle
and whenisgood.net, Skype and Google Hangout
(Garcia and Segars, 2012).
In previous studies on E-learning, researchers
have conducted experiments for assessing learning
facilities: a blackboard and a hangout platform
(Erkollar, Alptekin and Oberer, 2013), comparisons
between Hangout and an existing E-learning
platform (Strudler and Grove, 2013). Some of
studies have used surveys to measure the usability of
an E-learning platform (Zhang, Rui, Crawford and
He, 2008; Faulkner and McClelland, 2002), and to
develop solutions to enhance the learners’
experience (Wang, Chen, Liu and Liu 2009). Few
studies used physiological sensors to evaluate the
students’ biofeedback to interactive and non-
interactive material (Wirtky, Laumer, Eckhardt, and
Weitzel, 2013), i.e., discriminant analysis was
applied to extract sensor data as a feature generator.
As Kaiser et al. stated (Kaiser and Oertel, 2006), an
emotion recognition sensor system can enhance E-
learning system by adding affective abilities.
However, there are some issues that are not
addressed in the previous studies. First, users may
respond differently under a lab condition when
compared to a field study (Fairclough, 2009). In
particular, Fairclough claimed that physiological
response manipulated in a lab could not be
reproduced in naturalistic settings. Even though a
lab study might be sufficient for testing how students
learn alone, that is not the case for actual
learning, as students might react different in the
class. Second, measuring students’ engagement
towards a lecture is different than evaluating an
interaction method or a usability test. Evaluating an
interaction method or conducting a usability test can
be done in several rounds, but in the case of
measuring students’ engagement to a real lecture,
repeating experiments may cause different styles of
teacher presentation.
149
Wang C. and Cesar P..
Physiological Measurement on Students’ Engagement in a Distributed Learning Environment.
DOI: 10.5220/0005229101490156
In Proceedings of the 2nd International Conference on Physiological Computing Systems (PhyCS-2015), pages 149-156
ISBN: 978-989-758-085-7
Copyright
c
2015 SCITEPRESS (Science and Technology Publications, Lda.)
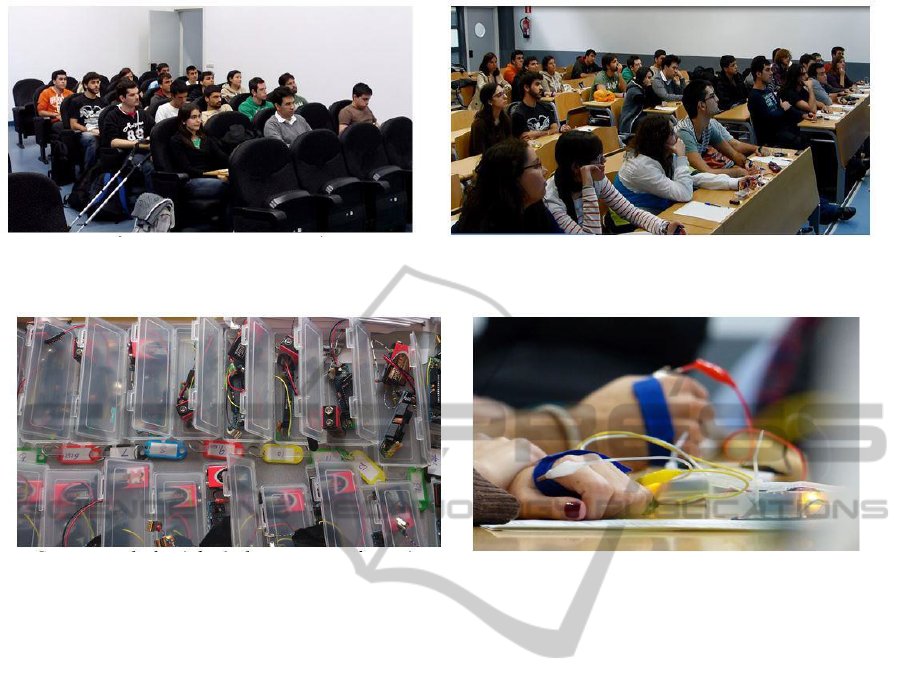
Figure 1: Students at two locations: (left) the students joined the lecture, and (right) the students watched the lecture
through Google+ Hangout.
Figure 2: The GSR sensors. The left picture shows the whole set of GSR sensors, and the right picture shows how the
GSR sensors were worn during the experiment.
The different presentation styles may generate the
different response of
students. Last, we believe that
a ground truth, e.g. a
survey, is required to
understand the patterns of
physiological sensors,
especially when such patterns
are linked to user
engagement.
In this paper, we conducted a field study to
measure students’ engagement in an E-learning
environment, where GSR sensors captured the
students’ biofeedback. During the experiment, one
location was a lecture classroom with the teacher,
and the other location was a remote classroom where
students followed the lecture in a project screen
(Figure 1 and Figure 3). After that, we compared
the
sensor results with the results from the surveys.
We
are in particular interested in the following
research
question:
R1: Can GSR sensors be used to measure
students’ engagement in an E-learning environment?
By answering the research question, we may
deploy
GSR sensors on E-learning platform.
Without the
need of surveys, we can use GSR
sensors to monitor
students’ engagement and provide feedback to the
teacher.
In our experiment, we interpret students’ GSR
response as engagement. We restricted our research
topic to the scope of E-learning.
This paper is structured as follows. First, we
discuss the related work. Then, we describe the
experimental design, detailing the data collection,
data analysis, and the participants. Next, we report
our results regarding the questionnaires and the
physiological sensors. Last, there are a discussion
and conclusion section.
2
RELATED WORK
2.1 Types of Studies on E-learning
We can divide the studies on E-learning on four
main types: E-learning platform development, E-
learning platform usability test, E-learning material
evaluation, and E-learning interaction method
development. Traditionally, E-learning platforms
were developed based on video –conferencing
systems (Zhang, Rui, Crawford and He, 2008;
Faulkner and McClelland, 2002). Recently, some
new technologies have been incorporated in order to
large amount of students, e.g., cloud computing
(Aljenaa et al., 2011). Furthermore, some methods
related to affective computing have been applied in
E-learning environment to enhance learners’
engagement. For example, empathic virtual human
or social software can be included on an E-learning
platform to increase learners’ performance (Wirtky
PhyCS2015-2ndInternationalConferenceonPhysiologicalComputingSystems
150
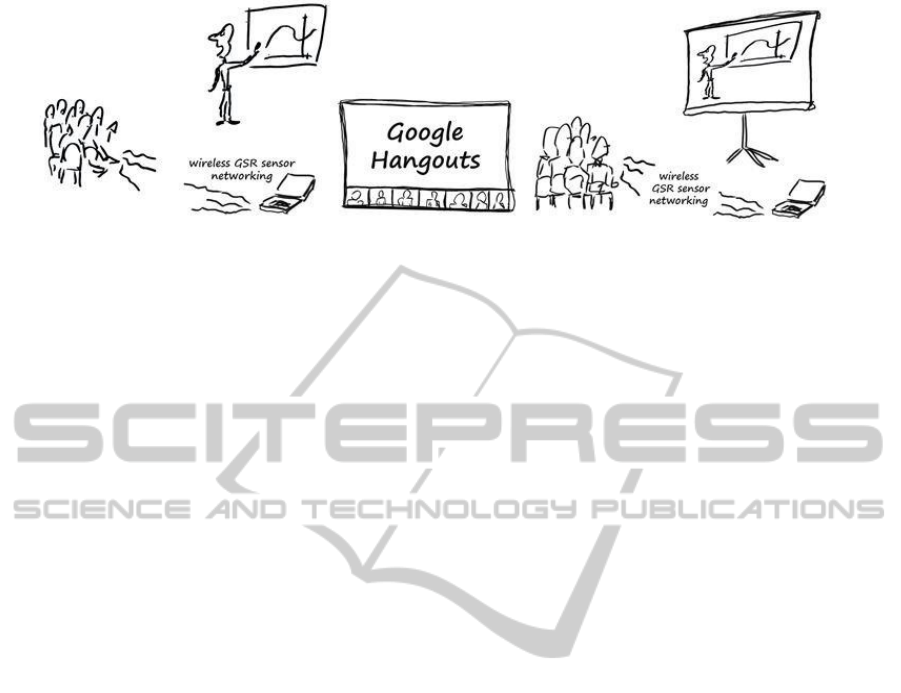
Figure 3: System architecture: the left is the lecture classroom; the middle is the Google+ Hangout platform,
streaming the lecture into the remote classroom; the right is the remote classroom.
et al., 2013). Last, some
studies have focused on
the usability test of an E-
learning platform
(Alsumait and Osaimi, 2009).
Surveys and physiological sensors are the main
methods in terms of evaluating the usability of
system, the suitability of learning materials, or the
performance of learners. For example, Faulkner et
al. used surveys to investigate how a video
conferencing system can deliver an educational
program to women consumers in rural and remote
area (Faulkner and McClelland, 2002). Clark et al.
used surveys to study whether the social platform –
Google+ had a better performance on developing
teaching material when compared to a text-based E-
learning platform (Neal and Grove, 2013).
Furthermore, both Handri et al. and Brawner et al
applied physiological sensors to evaluate the impacts
of course materials and user response towards a
computer-based training system (Handri et al.,
2010;
Brawner and Goldberg, 2012). In addition,
facial
recognition was also applied to detect
learners’
emotional states, so that a virtual tutor
could provide
effective feedback based on these
emotional cues
(D'Mello et al., 2013).
2.2 GSR Sensors
GSR sensors, also known as galvanic skin response
(GSR), electrodermal response (EDR),
psychogal-
vanic reflex (PGR), skin conductance
response
(SCR), or skin conductance level (SCL).
GSR
sensors measure users’ electrical conductance
of
the skin, where users’ sweat glands are varied and
controlled by the sympathetic nervous system.
Therefore, GSR sensors are normally considered as
an indicator of psychological or physiological
arousal. When users are highly aroused, users’ skin
conductance is increased in turn. Furthermore, in
affective computing and HCI, GSR sensors have
been proved as a valid approach for measuring
audience engagement, and researchers have shown
interesting results between GSR and engagement
(Mandryk, 2003; Picard, 1997).
As for our knowledge, few studies used GSR
sensors to evaluate the learners’ performance on E-
learning environment (Brawner and Goldberg,
2012). However, GSR sensors, combined with other
sensors, have been extensively applied on some
other scenarios, e.g., video gaming and theatre
performance. For instance, based on physiological
signals, Ruan et al. proposed a discriminant model to
predict the fatigue state of players, so that the design
of body-controlled games can be adapted and
improved (Ruan et al., 2009). In
addition, GSR
sensors have also been studied for
performing
arts, Latuliper et al. and Chen et al. used
both
surveys and GSR sensors to investigate audience
engagement at a lab and a field study
respectively
(Latulipe et al., 2011;
Wang et al., 2014).
3
EXPERIMENTAL DESIGN
3.1 Participants
There were 17 students at each location: the lecture
classroom with four females and thirteen males
(Mean age =21.05, SD = 2.16), and the remote
classroom six females and eleven males (Mean age
= 22.29, SD = 2.02). The experiment was conducted
at a scheduled class – the last class on Structured
Query Language (SQL) database before an exam,
and both the teacher and the students did not have
any experience on sensor experiments before (Figure
1). During the lecture, there was no interaction
between the teacher and the students. Before the
experiment started, they signed a consent form for
the video recordings. After the experiment, all the
students received a small gift as a bonus.
3.2 Questionnaires
Before the experiment, we conducted a pre-
questionnaire in order to examine the students’
physical condition, emotional state, and daily
PhysiologicalMeasurementonStudents'EngagementinaDistributedLearningEnvironment
151

learning habit. After the experiment, the students
took a small exam in order to check the learning
outcomes. Afterwards, they filled out a short
questionnaire about their learning experience during
the lecture. All of the questions were in the form of
“Graphic Rating Scales” in which participants were
asked to make a mark on a line between two
extremes, e.g.
How much did you enjoy during the lecture?
Not at all Very
| _|
The line measured 100 mm and responses were
measured to 1mm accurate.
3.3
Steaming Technology
We chose Google+ Hangout as the streaming
platform for the remote students. The reason is that
such platform has been considered as a capable and
low-cost solution that can be used in education and
training. For instance, Erkollar et al. studied the
impact of using Google+ and a blackboard
respectively (Erkollar, Alptekin and Oberer, 2013).
Similarly, Clark et al. conducted an experiment to
investigate whether the affordances of Google+
would more effectively help develop teaching and
enhance social presence when compared with the
university’s current text-based WebCT discussion
platform (Neal and Grove, 2013).
3.4
Methodologies
Questionnaires ratings and GSR readings were
analysed using Analysis of Variance (ANOVA),
correlations and Multi-Dimensional Scaling (MDS).
At each location, the repeat measurements were used
on the pre- and post- questionnaires, to examine the
impact of the lecture. In terms of the different
experience between the two locations, the between-
subjects design was used for both surveys and GSR
sensor data.
Multidimensional scaling (MDS) is a means of
visualizing the level of similarity of individual cases
of a dataset, in particular to display the information
contained in a distance matrix (Schiffman,
Reynolds and Young, 1981).
Furthermore, MDS
technique aims to place each
object in N-
dimensional space such that the between-object
distances are preserved as well as
possible. In our
analysis, we used a two –
dimensional space to
display the similarities
between the averaged
audience GSR responses.
MDS has been widely applied in psychological
research (Trevor and Cox, 2000; Borg and Groenen,
2002), but it is another new research technique to
physiological computing. Unlike other statistical
techniques that test hypotheses that have been
proposed a priori, MDS is an exploratory data
method that explores data for which no specific
hypotheses have been formed. Therefore, we do not
require to check the assumptions on the data sets,
but we need to report the overall fit statistics
(Kruskal’s stress and R Square) in the MDS, as they
are the indication about how the algorithm fits the
input data. In our case, we applied the MDS to
visualize the lecture impact on the two locations, so
that we could compare the density of GSR response
on the two locations.
In the results of Pearson product-moment
correlation coefficient, we used one star “*”
representing 95% confidence level and two stars
“**” indicating 99% confidence level.
All the data analysis was done using SPSS. C
language and Python were used to develop the
hardware and sensor data collection. Before
performing the ANOVA, we checked the
assumptions (normality and homogeneity of
variance) in order to assuring the validation of the
results. In our case, our data satisfied these
assumptions.4.1 Survey Results (the ground truth)
4
RESULTS
4.1
Survey Results (the Ground Truth)
The repeated measurement results showed that the
students at the lecture classroom had a significant
decrease on cheerful, energy and attention, but
sadness and being tired did not change after the
lecture (Table 1). While for the remote students,
there were no significant differences found after the
lecture (Table 2). Furthermore, the students gave the
rather low ratings on most of items of the surveys:
averaging 4.9 at the lecture classroom and 4.7 at the
remote classroom.
By examining the post-questions between the
two location students, we found that the students at
the lecture classroom were more cheerful but less
comfortable when compared to the remote students
(Table 3).
Table 1: The differences between pre- and post-
questionnaires at the lecture classroom, and yellow
indicates a significant difference found at p value.
Item p Mean
_
pre Mean
_
post
Cheerful
0.008
6.07 4.4
Sad 0.81 2.25 2.39
Ener
gy
0.04 5.38 4.03
Tired 0.27 3.86 3.01
Attention
0.001
6.38 3.88
PhyCS2015-2ndInternationalConferenceonPhysiologicalComputingSystems
152
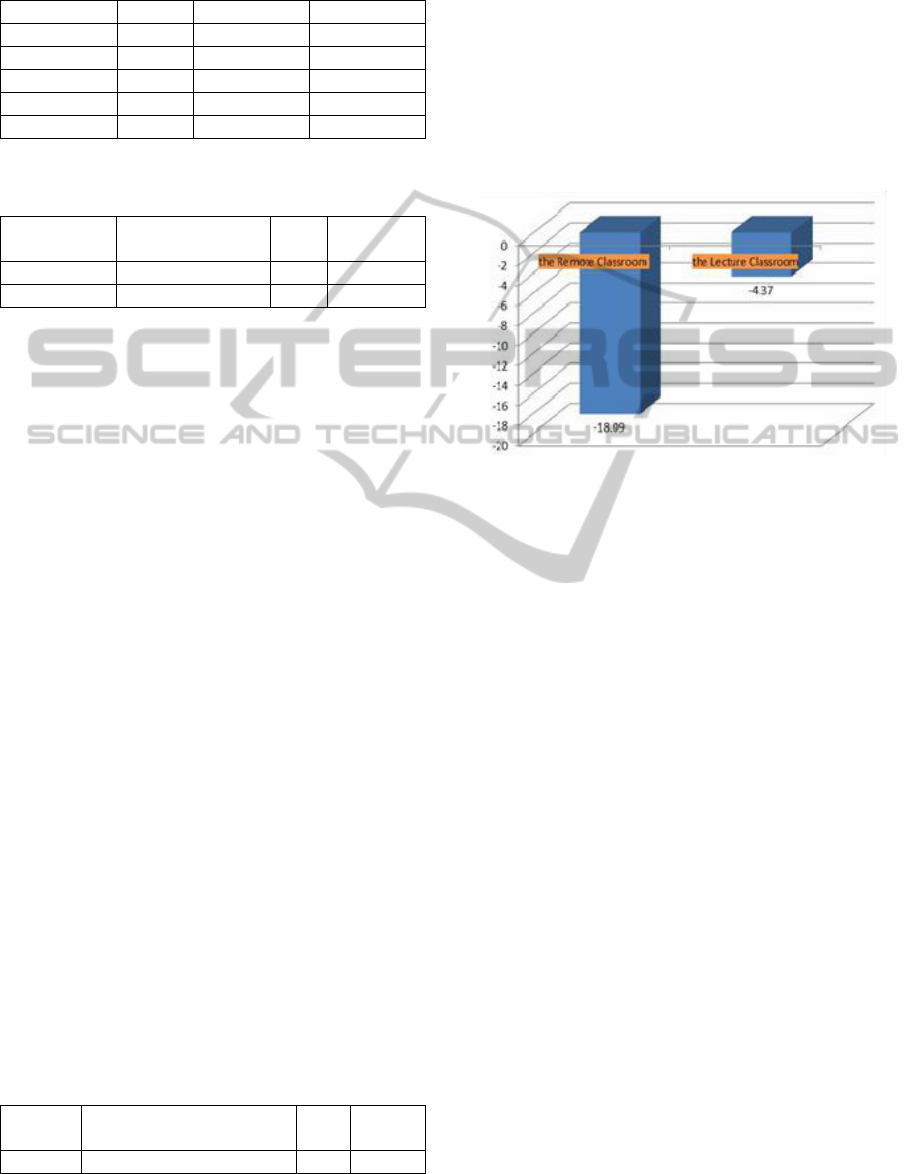
Table 2: The differences between pre- and post-
questionnaires at the remote classroom, where no
significant values were found at p value.
Item p Mean
_
pre Mean
_
post
Cheerful 0.31 5.2 5.6
Sad 0.24 2.4 3.03
Ener
gy
0.06 6.1 5.1
Tired 0.28 3.01 3.9
Attention 0.06 6.12 4.9
Table 3: The significant differences found with the
surveys between the two locations.
Items
Mean(Remote
/
Lecture)
p (
R
-L)%
Cheerful 3.59/5.82 * -0.38
Com
f
ortable 6.56/2.36 ** 1.78
Q1: How much cheerful were you during the
lecture?
Q2: How much comfortable were you during
the lecture?
The results in Table 3 are very interesting. It
seems that the remote students felt more comfortable
during the lecture, but they were less cheerful. We
believe this is because the remote students could
easily direct their attention to other things than the
lecture, e.g., checking other classmates’ states or
mobile phones, as we saw in the video recordings. In
contrast, the students at the lecture classroom had to
pay attention to the teacher, and thus they felt less
comfortable. In terms of the difference on the
cheerful state between the two locations, we think
that this may be related to the teacher’s presence, as
the remote students watched the lecture through a
screen projector.
4.2
Exam Results
The test scores showed the students at both locations
had a good performance (Table 4). The reason may
be the lecture was an extra lecture, and did not
introduce much new knowledge. Furthermore, there
was a significant difference on the scores found
between the two locations. The students at the
lecture classroom achieved a higher score (around
16% higher) than the remote students. In addition,
the pre-questionnaires showed there was no
significant difference on the previous knowledge
between the two locations.
Table 4: The significant differences were found on exam
scores between the students at both locations.
Items Mean(
R
emote/Lecture) p
(
R
-
L)%
Scores 7.76/9.29 * -0.16
4.3
GSR Sensors Results (R1)
4.3.1
Arousal
We found that the arousal levels at the two locations
were both negative (Fig. 4), and these results were
aligned with the survey data: both location students
were not so much engaged during the lecture.
Moreover, we found that the remote students’
arousal was lower than the one at the lecture
classroom (but the statistical value is at p: 0.06,
which is not significant).
Figure 4: The arousal values at both locations are negative.
4.3.2
Correlations
We found the correlations results on our data sets
were rather different to other relevant study that
used a brain sensor. Dmochowski et al. found that
“when two people watch a movie, their brains
respond similarly – but only if the video is engaging.
These results were obtained by using a brain wave
sensor, while user watched videos available in social
media (Dmochowski, Bezdek, Abelson, Johnson,
Schumacher and Parra, 2014). In our experiment, we
had a non-engaging learning experience, and it is
important to note that such situation (non-engaging
experience) has not been reported before. Unlike the
previous studies, the audience was engaged with a
video (Dmochowski, Bezdek, Abelson, Johnson,
Schumacher and Parra, 2014) or a comedy play
(Wang, Geelhoed, Stenton and Cesar, 2014).
However, during a non-engaging experience, we
found that there were no such significant
correlations existed between the two locations
(surveys and GSR response), and there was no
significant cross correlation between surveys and
GSR readings. In addition, the study conducted by
Wang et al., (Wang, Geelhoed, Stenton and Cesar,
2014), 10 of 15 audience members formed a big
engaging cluster. Yet, we noticed that in our study,
there were several clusters established at each
location based on the students’ GSR response, and
this made it difficult to interpret the each cluster by
simply checking surveys.
PhysiologicalMeasurementonStudents'EngagementinaDistributedLearningEnvironment
153
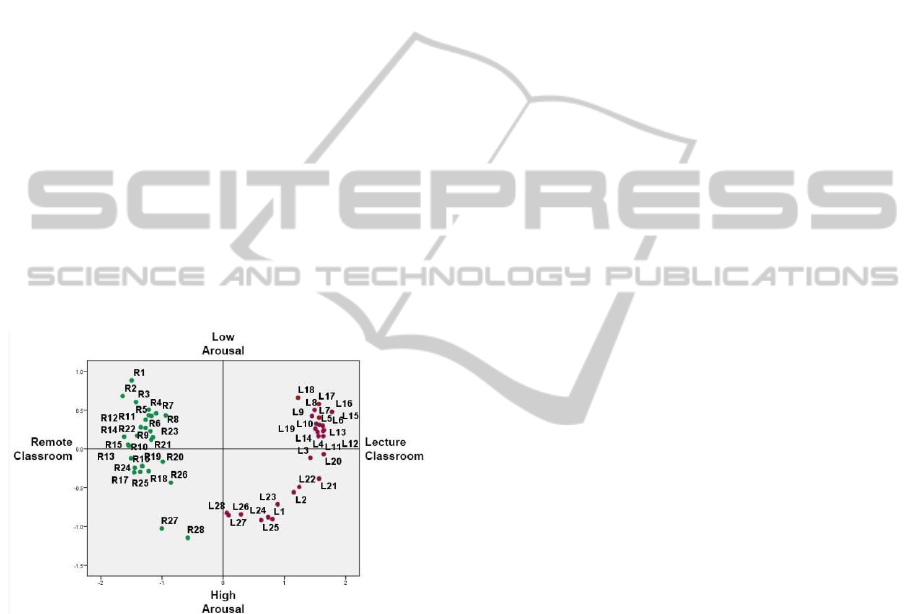
4.3.3 The Density of GSR Response on the
Two
Locations
We displayed the MDS results on the two-
dimensional map (Figure 5), where each point
indicates the averaged minute by minute students’
GSR response at the two locations. We found that
the density of GSR responses at the two locations
was rather different: the GSR response (the green
points) on the remote students was more closed to
each other when compared to the one (the red
points) at the lecture classroom. According to Wang
et al. study (Wang, Geelhoed, Stenton and Cesar,
2014), they found the more similar GSR response,
the more close distance between the adjacent time-
lined (based on every minute) points. Therefore, we
think this result may imply, during a non-engaging
experience, the remote location GSR response was
more synchronized (the green points are more closed
to each other) when compared to the one (the red
points) at the lecture classroom. This might be
related to the different user states at the two
locations, e.g., comfortable or cheerful, although
thestudents at the two locations were both non-
engaged
during the lecture.
Figure 5: MDS minute by minute unfolding of the lecture
impact at the both locations: the density of GSR responses
at the remote location was higher when compared to the
one at the lecture room (R: the lecture duration at the
remote classroom; L: the lecture duration at the lecture
classroom). (Stress: 0.1, RSQ: 0.98).
As Figure 5 displayed, the remote students spent
the first 3 minutes to be synchronized on their GSR
response – a massive cluster appeared afterwards,
but their GSR response started to have a big jump
distance at the minute 26 until the end of the lecture.
In contrast, the GSR response of the students at the
lecture classroom had the similar manner, after the
first 3 minutes, there was a big cluster formed on
their GSR response from the minute 4 to the minute
20. Unlike the GSR response at the remote location,
the GSR response at the lecture classroom had a big
jump at the minute 21, afterwards, there was another
cluster established until the end of the lecture.
5
DISCUSSION
In this study, we obtained the realistic GSR data on
students’ engagement in a real lecture, except that
the students were required to wear a sensor. The
results report a non-engaging user experience, and
such results have not been reported before.
We think that a field study might more easily
capture a non-engaging user experience, as users are
placed in a realistic environment. On the contrary, if
users are placed under a lab condition, users
normally treat the stimulus as a task, to which they
pay attention, as they have to fulfil the assignment
we give to them. Furthermore, in a lab condition,
even though users label a bored state, their actual
biofeedback may be rather different to a real bored
state (Fairclough, 2009, Wang and Cesar, 2014).
Our results on the density of GSR responses at
the two locations do not conflict with the previous
correlation results, as we mentioned in the part of
methodologies, the MDS algorithm is a technique to
explore the data. The explored findings will
motivate us to make a further investigation on user
experiences that are linked to the patterns of GSR
sensors.
In addition, we suggest not adding extra task to
users during a physiological experiment, i.e., user
annotations, as such constant labelling work would
distract user experience and alter sensor readings.
Therefore, we suggest obtaining a ground truth by
some other methods, e.g., surveys or video
recordings.
Last, the measurement in our study was
simultaneously done at the two locations. However,
for the applications E-learning, e.g., watching an
educational video, this might not be required. It will
be an interesting future work to conduct experiments
with these two different experimental settings. In
particular, we are interested in investigating how the
GSR patterns look like on non-engaging home
learners, whether they have the similar/different
sensor patterns compared to non-engaging learners
who watch a lecture at a classroom. However, the
resulted learner’ engagement cannot be predicted
before the experiment, as we normally obtain such
information after the experiment.
6
CONCLUSIONS
In this paper, we used GSR sensors to measure
students’ engagement in a field study - a distributed
PhyCS2015-2ndInternationalConferenceonPhysiologicalComputingSystems
154

learning environment. The experimental results
showed that the GSR sensors’ measurement was
aligned with the surveys, so that we can use GSR
sensors as an alternative method to measure
students’ engagement. Furthermore, we compared
the resulted non-engaging user experiences to the
previous similar studies, and we found that GSR
readings demonstrated the different patterns that
have not been reported before. In addition, the MDS
result revealed that the GSR response at the remote
location was more synchronized when compared to
the one at the lecture classroom.
We believe that our study is beneficial for E-
learning, as we have shown that GSR sensors can be
used as an alternative tool to provide feedback in a
distributed learning environment. Moreover, we
presented a non-engaging user case, where the
patterns of GSR readings were first reported. Last,
the methodologies incorporated in this study are also
helpful on other sensor studies, e.g., a pulse sensor.
REFERENCES
Daniel D. Garcia and Luke Segars. 2012. Technology that
educators of computing hail (TECH): come, share
your favorites!. In Proceedings of the 43rd ACM
technical symposium on Computer Science.
Education (SIGCSE '12). ACM, New York, NY, USA,
682-682. DOI=10.1145/2157136.2157438.
Erkollar, Alptekin, and B. J. Oberer. "Putting Google+ to
the Test: Assessing Outcomes for Student
Collaboration, Engagement and Success in Higher
Education." Procedia-Social and Behavioral Sciences
83 (2013): 185-189.
Strudler, Neal, and Karen Grove. "I see you: Using the
affordances of Google+ to increase social and teaching
presence in an online undergraduate teacher education
course ISTE 2013." Cynthia Clark doctoral student,
San Antonio, TX. Retrieved from http://www.
isteconferenceorg/uploads/ISTE2013/HANDOUTS/
KEY_80520342/I STE2013ISeeYou_RP. pdf. Accessed
on June 17 (2013): 2013.
Chen Wang, Erik N. Geelhoed, Phil P. Stenton, and Pablo
Cesar. 2014. Sensing a live audience. In Proceedings
of the 32nd annual ACM conference on Human factors
in computing systems (CHI '14). ACM, New York,
NY, USA, 1909-1912.
DOI=10.1145/2556288.2557154.
Young, Forrest W., and Robert M. Hamer (ed.)(1987),
Multidimensional Scaling: History,Theory, and
Applications, Hillsdale, NJ: Erlbaum.
Schiffman, Susan S., M. Lance Reynolds, and Forrest W.
Young (1981), Introduction to Multidimensional
Scaling: Theory, Methods, and Applications, NY:
Academic Press.
Trevor F. Cox and M.A.A. Cox (2000). Multidimensional
Scaling, Second Edition. ISBN 1-58488-094-5.
Ingwer Borg and Patrick J.F. Groenen. Modern
Multidimensional Scaling: Theory and Applications.
2005 Springer Science+Buiness Media, Inc. ISBN-10:
0-387-25150-2.
Foertsch, J., Moses, G., Strikwerda, J. and Litzkow, M.
(2002), Reversing the Lecture/Homework Paradigm
Using eTEACH® Web-based Streaming Video
Software. Journal of Engineering Education, 91: 267–
274. doi: 10.1002/j.2168-9830.2002.tb00703.x.
Mavlankar, A; Agrawal, P.; Pang, D.; Halawa, S.; Ngai-
Man Cheung; Girod, B., "An interactive region-of-
interest video streaming system for online lecture
viewing," Packet Video Workshop (PV), 2010 18th
International , vol., no., pp.64,71, 13-14 Dec. 2010
doi: 10.1109/PV.2010.5706821.
Cha Zhang, Yong Rui, Jim Crawford, and Li-Wei He.
2008. An automated end-to-end lecture capture and
broadcasting system. ACM Trans. Multimedia.
Comput. Commun. Appl. 4, 1, Article 6 (February.
2008), 23 pages. DOI=10.1145/1324287.1324293.
Kathryn Faulkner and Linda McClelland. (2002). Using
videoconferencing to deliver a healthy education
program to women healthy consumers in rural and
remote queensland: an early attempt and future plans.
Aust. J. Rural Health 10, 65-72.
Dmochowski, Jacek P, Bezdek, Matthew A, Abelson,
Brian P, Johnson, John S, Schumacher, Eric H, Parra,
Lucas C. 2014. Audience preferences are predicted by
temporal reliability of neural processing. Nature
Publishing Group, a division of Macmillan Publishers
Limited. http://dx.doi.org/10.1038/ncomms5567.10.
1038/ncomms5567.
Chin-Yeh Wang, Gwo-Dong Chen, Chen-Chung Liu, and
Baw-Jhiune Liu. 2009. Design an empathic virtual
human to encourage and persuade learners in e-
learning systems. InProceedings of the first ACM
international workshop on Multimedia technologies
for distance learning
(MTDL '09). ACM, New York,
NY, USA, 27-32. DOI=10.1145/1631111.1631117.
Cristina Hava Muntean and Gabriel-Miro Muntean. 2009.
Open corpus architecture for personalised ubiquitous.
e-learning. Personal Ubiquitous Comput. 13, 3 (March
2009), 197-205. DOI=10.1007/s00779-007-0189-5.
Thomas Wirtky, Sven Laumer, Andreas Eckhardt, and
Tim Weitzel. 2013. Using social software for
enhancing IS talents' e-learning motivation. In
Proceedings of the 2013 annual conference on
Computers and people research (SIGMIS-CPR '13).
ACM, New York, NY, USA, 63-72.
DOI=10.1145/2487294.2487307.
E. Aljenaa, F. S. Al-Anzi, and M. Alshayeji. 2011.
Towards an efficient e-learning system based on cloud
computing. In Proceedings of the Second Kuwait
Conference on e-Services and e-Systems(KCESS '11).
ACM, New York, NY, USA, Article 13, 7 pages.
DOI=10.1145/2107556.2107569.
Vladimir Kolovski and John Galletly. 2003. Towards E-
learning via the semantic web. InProceedings of the
4th international conference conference on Computer
systems and technologies: e-Learning (CompSysTech
PhysiologicalMeasurementonStudents'EngagementinaDistributedLearningEnvironment
155

'03), B. Rachev and A. Smrikarov (Eds.). ACM, New
York, NY, USA, 591-596. DOI=10.1145/
973620.973719.
Asmaa Alsumait and Asma Al-Osaimi. 2009. Usability
heuristics evaluation for child e-learning applications.
In Proceedings of the 11th International Conference
on Information Integration and Web-based
Applications and Services (iiWAS '09). ACM, New
York, NY, USA, 425-430.
DOI=10.1145/1806338.1806417.
Santoso Handri, Kuniaki Yajima, Shusaku Nomura,
Nobuyuki Ogawa, Yoshimasa Kurosawa, and Yoshimi
Fukumura. 2010. Evaluation of Student's
Physiological Response Towards E-Learning Courses
Material by Using GSR Sensor. In Proceedings of the.
2010 IEEE/ACIS 9th International Conference on
Computer and Information Science (ICIS '10). IEEE
Computer Society, Washington, DC, USA, 805-810.
DOI=10.1109/ICIS.2010.92.
Keith W. Brawner and Benjamin S. Goldberg. 2012. Real-
Time monitoring of ECG and GSR signals during
computer-based training. In Proceedings of the 11th
international conference on Intelligent Tutoring
Systems (ITS'12), Stefano A. Cerri, William J.
Clancey, Giorgos Papadourakis, and Kitty Panourgia
(Eds.). Springer-Verlag, Berlin, Heidelberg, 72-77.
DOI=10.1007/978-3-642-30950-2_10.
Sidney D'mello and Art Graesser. 2013. AutoTutor and
affective autotutor: Learning by talking with
cognitively and emotionally intelligent computers that
talk back. ACM Trans. Interact. Intell. Syst. 2, 4,
Article 23 (January 2013), 39 pages. DOI=10.1145/
2395123.2395128.
R. Mandryk. Objectively evaluating entertainment
technology. In CHI’04, pages 1057–1058. ACM Press,
2003.
R.W. Picard. Affective computing. MIT Press, Cambridge,
MA, USA, 1997.
Shengsheng Ruan, Ling Chen, Jie Sun, and Gencai Chen.
2009. Study on the change of physiological signals
during playing body-controlled games. In Proceedings
of the International Conference on Advances in
Computer Enterntainment Technology (ACE '09).
ACM, New York, NY, USA, 349-352.
DOI=10.1145/1690388.1690456.
Celine Latulipe, Erin A. Carroll, and Danielle Lottridge.
2011. Love, hate, arousal and engagement: exploring
audience responses to performing arts. In Proceedings
of the SIGCHI Conference on Human Factors in
Computing Systems (CHI '11). ACM, New York, NY,
USA, 1845-1854. DOI=10.1145/1978942.1979210.
Stephen H. Fairclough. Fundamentals of physiological
computing. Interact. Comput. (2009) 21 (1-2): 133-
145.
Robin Kaiser and Karina Oertel. 2006. Emotions in HCI:
an affective e-learning system. InProceedings of the
HCSNet workshop on Use of vision in human-
computer interaction - Volume 56(VisHCI '06),
Roland Goecke, Antonio Robles-Kelly, and Terry
Caelli (Eds.), Vol. 56. Australian Computer Society,
Inc., Darlinghurst, Australia, Australia, 105-106.
Chen Wang and Pablo Cesar. 2014, Do we react in the
same manner? Comparing GSR patterns across
scenarios. NordiCHI 2014.
PhyCS2015-2ndInternationalConferenceonPhysiologicalComputingSystems
156
