
Comparing the Sensor Glove and Questionnaire as Measures of
Computer Anxiety
Tlholohelo S. Nkalai
1
, Lizette de Wet
1
and Robert Schall
2
1
Department of Computer Science and Informatics, University of the Free State, Nelson Mandela Drive,
Bloemfontein, South Africa
2
Department of Mathematical Statistics and Actuarial Science, University of the Free State, Nelson Mandela Drive,
Bloemfontein, South Africa
Keywords: Computer Anxiety, Skin Conductance, Physiological Measures, Usability Evaluation.
Abstract: Contradictory findings are reported in the literature concerning computer anxiety and how it affects the
performance of individuals executing computer-related tasks. The discrepancies in the findings could be
caused by the sole use of computer anxiety questionnaires. The aims of the present study were to establish
whether using a sensor glove provided complementary information to an existing computer anxiety
questionnaire; and to compare the computer anxiety of participants using a sensor glove and an anxiety
questionnaire with relation to performance. The study results suggest that the sensor glove and the anxiety
questionnaire provided different information concerning participants’ anxiety before and after performing
tasks on the computer. A negative correlation between computer anxiety and performance was found using
both the sensor glove measurements and the computer anxiety scores. It is concluded that the sensor glove
possibly measures a different variable from the anxiety questionnaire and further research is necessary in
that regard. Additionally, it is concluded that the higher an individual’s levels of anxiety, the poorer he/she
performed on the assessment.
1 INTRODUCTION
Computer anxiety is defined as an emotional fear or
phobia experienced by individuals when using
computers or when thinking of using computers
(Chua et al., 1999). According to Blignaut, Burger,
McDonald and Tolmie (2005, p.500) it is “a diffuse,
unpleasant, and vague sense of discomfort and
apprehension when confronted by computer
technology or people who talk about computers”.
Concerning these definitions of computer anxiety, it
is evident that computer anxiety involves emotional
“fear” or “apprehension” when interacting or
anticipating interaction with computers.
1.1 Computer Anxiety and Stress
Researchers agree that individuals experiencing
computer anxiety exhibit certain physiological
reactions. These reactions may include sweaty
palms, dizziness or light headedness, rapid
breathing, a pounding heart, feelings of unreality,
chest pain, shaking or trembling (Appelbaum and
Primer, 1990; Beckers and Schmidt, 2001; Mayo
Clinic, 2012). Some of these physiological reactions
are similar to those of individuals experiencing
stress. According to Rogge (2011), the symptoms of
stress include pain in the abdomen, headaches and
muscle tightness or pain. For highly stressed
individuals, the symptoms may include a faster heart
rate, skipped heartbeats, rapid breathing, sweating,
trembling and dizziness. It is apparent that, based on
these symptoms of anxiety and stress, it is easy to
misinterpret anxiety for stress or vice versa. To
distinguish between the two, Merrill (2013) states
that stress is instigated by an existing stress-causing
factor or “stressor”, whereas anxiety is stress that
remains after the “stressor” is gone. Despite this
distinction, anxiety and stress are sometimes used
interchangeably with the understanding that they
have a similar meaning (Princeton University,
2013). In this paper we also use the terms anxiety
and stress interchangeably.
93
Nkalai T., de Wet L. and Schall R..
Comparing the Sensor Glove and Questionnaire as Measures of Computer Anxiety.
DOI: 10.5220/0005229800930103
In Proceedings of the 2nd International Conference on Physiological Computing Systems (PhyCS-2015), pages 93-103
ISBN: 978-989-758-085-7
Copyright
c
2015 SCITEPRESS (Science and Technology Publications, Lda.)

1.2 Computer Anxiety and
Performance
Individuals experiencing computer anxiety tend to
score poorly in tests which require them to use
computers (Glaister, 2007; Parayitam et al., 2010).
In the study conducted by Glaister (2007), the
student nurses who reported having medium to high
anxiety levels performed poorer than those with low
levels of computer anxiety. According to Parayitam
et al., (2010), students experiencing computer
anxiety obtain low grades as a consequence of
avoiding assignments or exercises which necessitate
them to use computers. Despite these findings, a
recent study conducted by Olufemi and Oluwatayo
(2014) revealed a non-significant difference in the
performance of students with high, moderate and
low computer anxiety. The performance was based
on the scores obtained by the students in a computer-
based test.
Since reports in the literature disagree about how
computer anxiety affects performance of individuals,
extensive investigations regarding computer anxiety
and performance are necessary.
1.3 Computer Anxiety Questionnaires
In many research studies concerning computer
anxiety, computer anxiety questionnaires have been
used as the sole instruments for measuring anxiety.
Examples include studies conducted by Aziz and
Hassan (2012), Hismanoğlu (2011), Korobili, Togia
and Malliari (2010), Longe and Uzoma (2007), and
Ursavas and Teo (2011). According to Isen and Erez
(2006), the exclusive use of questionnaires is
insufficient for drawing conclusions about emotions.
This is because of the limitations posed by this
method. For example, the participants may
experience ambiguous emotions which can be
difficult to interpret accurately. Moreover, factors
such as incentives or even rules can influence the
participants to respond the way they think is
appropriate or expected by the researcher (Bandura,
1971 cited in Isen and Erez, 2006). Other possible
measurements are therefore worth investigating.
1.4 Physiological Measures
Physiological measures are defined as physical
signals of the human body which are produced when
the body undergoes psychological changes. These
measures are also termed psychophysiological
measures where the preceding word “psycho”
emphasizes that a measurement is taken of the
psychological state of an individual (Dirican and
Göktürk, 2011).
Employing physiological measures is
advantageous in that the measurements are objective
−they do not depend on the views of the participants
(unlike questionnaires). Physiological measures are
also unobtrusive in that they do not interfere with the
participant’s natural behavior. Moreover, the signals
can be measured in real-time because they are
continuous (Kivikangas et al., 2011).
Special equipment is required to measure
physiological signals. Examples of the equipment
include the BodyMedia SenseWear armband
(SwordMedical, 2010), Galvactivator (Picard and
Scheirer, 2001), and the Emotion RECognition
sensor system (EREC) (Kaiser and Oertel, 2006).
Physiological measures are employed in a research
area named affective computing. The goal behind
affective computing is to provide computers with
emotional intelligence and make them understand
emotions in a similar way as a human being would
do (Picard, 1997).
From the above-mentioned definition of
computer anxiety by Chua et al., (1999), which is in
agreement with Cambre and Cook (1987), computer
anxiety is specified as an emotional state. As a
result, it can be inferred that computer anxiety is an
emotion. Since emotions have successfully been
investigated using physiological measures in
affective computing, it was deemed appropriate that
computer anxiety be investigated using these
measures.
The physiological measure employed in the
present study was skin conductance. When an
individual experiences increased sympathetic
activation, for example, in cases of stress and
nervous tension, the individual’s palms become
damp because increased sympathetic activity causes
the sweat ducts and the surface of the skin to be
hydrated. This hydration (sweating) causes the skin
resistance to decrease while the conductance will
increase (Barreto, 2008).
When describing changes in electrical
conductance of the skin, the term generally used is
EDA rather than skin conductance. EDA is
reflective of the changes in autonomic sympathetic
arousal associated with emotional and cognitive
states (Critchley, 2002). It is among the signals that
are used in polygraph (‘lie-detector’) tests and in
studies that involve stress and cognitive workload
(Picard and Scheirer, 2001). EDA is considered to
be very sensitive to physiological changes (Barreto,
2008).
It is difficult to determine the cause of a certain
change in skin conductance as it can be triggered by
PhyCS2015-2ndInternationalConferenceonPhysiologicalComputingSystems
94

various stimuli. However, the skin conductance level
swiftly elevates in events which are major or of
intense nature (for example when experiencing
stress and anxiety). When executing tasks that
involve mental workload, the level is inclined to
increase suddenly and then decrease slowly.
Normally this response occurs at the beginning of
new and engaging experiences (Picard and Scheirer,
2001).
1.5 Purpose of the Study and
Hypotheses
Traditionally, computer anxiety has been
investigated using computer anxiety questionnaires
solely. The goals of the present study were to: (1)
establish whether using a sensor glove provided
complementary knowledge to an existing computer
anxiety questionnaire; (2) compare the computer
anxiety of participants using a sensor glove and an
anxiety questionnaire with relation to performance.
The following statistical null hypotheses were
tested:
H1: There is no correlation between existing
computer anxiety questionnaire scores and
conductance readings of the sensor glove before and
after interaction with a computer.
H2: There is no correlation between computer
anxiety and performance according to computer
anxiety questionnaire scores and skin conductance
readings.
2 METHODS
2.1 Participants
Purposive sampling was used to recruit 58
participants for the study. The participants were
computer illiterate individuals who had recently
been enrolled in a partnership programme at a local
university. In this programme, the participants
received free computer literacy training for one
week. The participants were recruited for this study
after completing the programme. The participants
had basic education (with Matric or Grade 12 as the
highest qualification) and the majority of them did
not have access to computers at home. Because of
their background, it was expected that the
participants would exhibit anxiety when working
with computers. An informed consent form was
issued to each participant before the data collection
commenced.
2.2 Measures
As mentioned earlier, data were gathered using an
existing computer anxiety questionnaire and an
instrument for measuring physiological data.
Additional methods for collecting data were pre-test
and post-test self-developed questionnaires,
observations and interviews.
2.2.1 Computer Anxiety Rating Scale
The questionnaire instrument used in the present
study was the Computer Anxiety Rating Scale
(CARS), developed by Heinssen, Glass and Knight
(1987). CARS consists of 19 items with a five-point
Lickert type scale rated from 1 (strongly disagree) to
5 (strongly agree). The CARS scores range from 19
to 95 where the higher scores reflect higher levels of
computer anxiety (Heinssen et al., 1987). The CARS
questionnaire was completed by each participant
before and after executing tasks on the computer.
The aim was to measure and compare the levels of
computer anxiety of the participants at these two
instances.
2.2.2 Emotion RECognition System
The physiological measuring instrument used in the
study was the Emotion RECognition system (EREC
II) sensor glove. According to Kaiser and Oertel
(2006), the EREC system was developed in
Germany at the Fraunhofer Institute for Computer
Graphics Rostock (IGD-R).
The two main parts of the EREC system are the
sensor unit and the base unit. The sensor unit, in the
form of a glove, contains the skin resistance and skin
temperature sensing elements. Additionally, the
sensor unit measures the environmental air
temperature. The sensing elements are integrated in
the glove, but the sensor circuitry is placed in a
small wrist pocket (Peter et al., 2007). The
components of the EREC II are shown in Figure 1.
Although EREC can be used to measure skin
temperature, skin resistance and heart rate, in this
study the researchers were particularly interested in
skin conductance which was calculated from the
skin resistance measurements. Skin resistance is
measured in Kilo-ohms (kΩ) which was converted
into conductance in milli-Siemens (mS).
Conductivity is the reciprocal of resistivity, therefore
the conversion was performed easily. The EREC
system captured ten skin resistance readings per
second and the data were recorded in a Microsoft
(MS) Excel application.
ComparingtheSensorGloveandQuestionnaireasMeasuresofComputerAnxiety
95
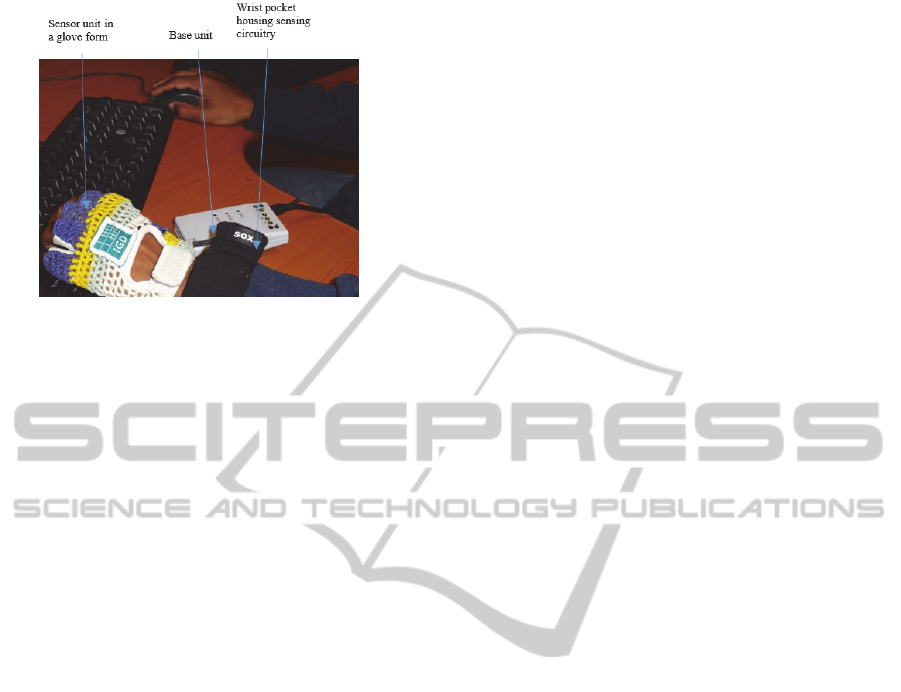
Figure 1: EREC II components (Picture taken in the
usability lab at the research institution.).
2.2.3 Pre-test and Post-test Questionnaires
The pre-test questionnaire was used for capturing
demographic data, for example age and gender. The
post-test questionnaire was used to record the
subjective emotions (anxiety and/or stress)
experienced by the participants during the different
stages of data gathering. The participants indicated
which among the allocated nine tasks caused them to
experience the two emotions. They also provided
their perceived reasons for experiencing those
emotions. Furthermore, the participants were
required to rate their experiences with the glove in
terms of comfort and time taken to set it up.
2.2.4 Observations
Each participant performed tasks on the computer in
a usability lab. The recordings were taken according
to a pre- designed schedule using pen and paper.
Recordings of time-on-task and task success were
noted. Time-on-task allowed the researchers to
assess the various task durations. The task success
rate (percentage of the tasks completed successfully)
enabled the researchers to evaluate the performance
of the participants by task. The tasks that were not
completed in the given amount of time were also
noted. Also of importance were the overt behaviours
of the participants, such as body language, words
uttered, and facial expressions.
2.2.5 Interviews
Interviews were conducted after the participant had
completed the questionnaires to ensure that the
researchers understood what was written in the
questionnaire, as some responses to the questions
were not legible or written in improper English.
2.3 Procedure
The data was collected in the usability lab of a local
university. The usability lab offered a suitable
environment for the use of the testing instruments,
with one participant at a time performing tasks on a
computer.
The participant wore the EREC sensor glove and
completed the pre-test and CARS questionnaires
before executing tasks using the MS Word
application. The tasks were presented in a small
moveable application window which was designed
in such a way that only one task was displayed at a
time. A “next” button appeared on the application
window that allowed the participant to display the
subsequent task. While the tasks were presented in
the application window, the MS Word application
was opened simultaneously on the screen behind the
application window containing the tasks.
Consequently, the participant was able to view the
task to be performed as well as the MS Word
application where the execution of tasks was
performed. The participant was assigned three
minutes for each task.
After executing all the tasks, the participant was
required to complete the post-test questionnaire, and
once again the CARS questionnaire. An interview
was conducted with the participant to clarify
responses to the questionnaires.
3 RESULTS
3.1 Demographics
Data were gathered from 58 participants of whom 25
were males and 33 females. The participants’ ages
ranged from 16 to over 40 years. The largest
proportion of participants (36.2%) was in the age
group of 21 to 25 years, whereas only 3.4% of
participants were older than 40 years. The largest
group of the participants (70.7%) spoke Sotho or
Tswana as their home language, followed by Xhosa
(25.9%). Only one participant each (1.7%) spoke
Afrikaans and Zulu as their home language. With
regard to educational background, 47 (81%) of the
participants had completed Matric, whereas 11
(19%) had not.
3.2 Hypothesis Testing
The participants were required to complete the
CARS questionnaire before and after performing the
tasks on the computer. The CARS scores (pre and
PhyCS2015-2ndInternationalConferenceonPhysiologicalComputingSystems
96
post assessment) were compared with the skin
conductance readings of the EREC sensor glove
before and after the assessment. The comparisons
were made to address the first hypothesis stated as:
H1: There is no correlation between existing
computer anxiety questionnaire scores and
conductance readings of the sensor glove before and
after interaction with a computer.
The aim of the comparison was to establish whether
the results provided similar or different information
regarding levels of anxiety before and after the
assessment (interaction with the computer). The
existing computer anxiety questionnaire used was
the CARS. A correlation test was performed in the
following instances to investigate the following:
3.2.1 Anxiety before Assessment
3.2.1.1 The Correlation between Total Scores on
the CARS Pre-test Questionnaire and the
Average Skin Conductance Readings during the
First Minute of Wearing the Glove
Results:
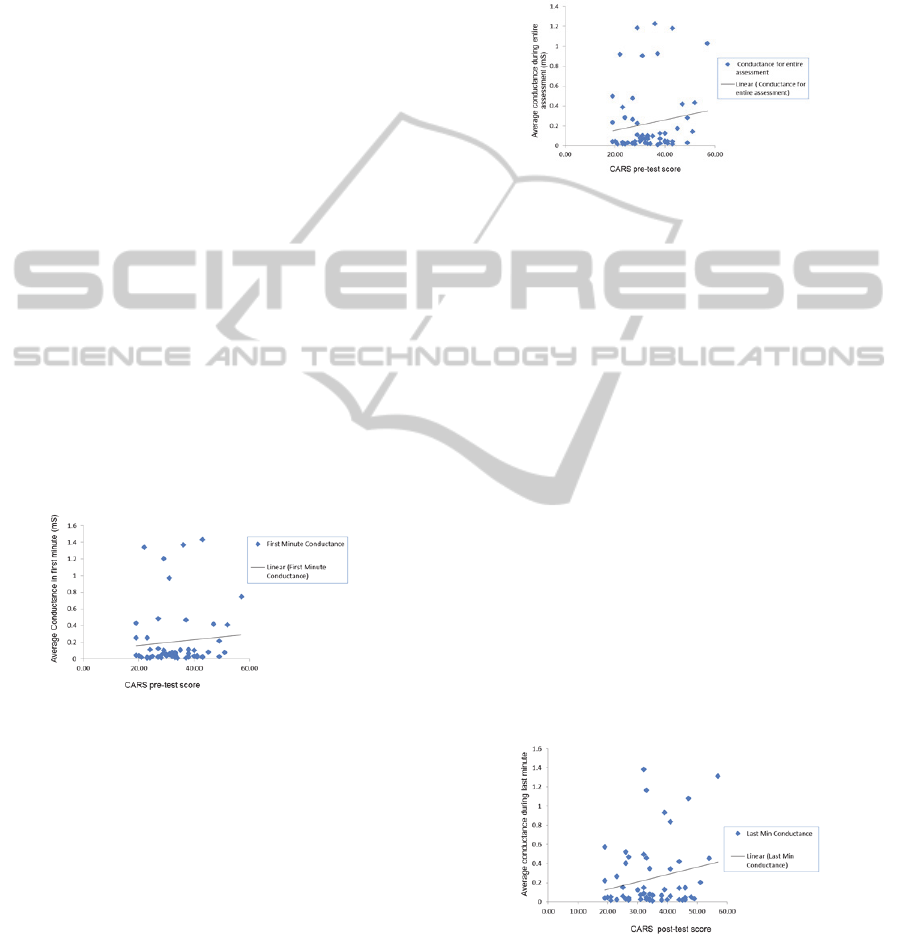
There was no significant correlation (r = 0.144, p >
0.05) between the pre-test questionnaire score and
the average skin conductance reading for the first
minute (see Figure 2 for the scatterplot).
Figure 2: Average conductance in first minute as a
function of CARS pre-test score.
Finding:
From this result we can conclude that the sensor
glove (first minute) and the CARS pre-test
questionnaire potentially provide different
information regarding levels of anxiety before the
assessment.
3.2.1.2 The Correlation between Total Scores on
the CARS Pre-test Questionnaire and the
Average Skin Conductance Reading on the
Sensor Glove during the Entire Assessment
This correlation was calculated to investigate
whether the result found in 3.2.1.1 was caused by
inaccurate reading of anxiety during the first minute.
Results:
There was no significant correlation (r = 0.168; p >
0.05) between the total scores on the CARS pre-test
questionnaire and the average skin conductance
reading on the sensor glove during the entire
assessment (see Figure 3 for the scatterplot).
Figure 3: Average conductance during entire assessment
as a function of CARS pre-test score.
Finding:
This result confirms the conclusion made in 3.2.1.1.
The sensor glove and the CARS pre-test
questionnaire potentially provide different
information regarding levels of anxiety before the
assessment.
3.2.2 Anxiety after Assessment
3.2.2.1 The Correlation between Total Scores on
the CARS Post-test Questionnaire and the
Average Skin Conductance Readings during the
Last Minute of Wearing the Glove Was
Calculated
Results:
There was no significant correlation (r = 0.192; p >
0.05) between the total scores on the CARS post-test
questionnaire and the average readings during the
last minute of wearing the glove (see Figure 4 for
the scatterplot).
Figure 4: Average conductance during the last minute as a
function of CARS post-test score.
Finding:
From this we can conclude that the sensor glove (last
minute) and the CARS post-test questionnaire
potentially provide different information regarding
ComparingtheSensorGloveandQuestionnaireasMeasuresofComputerAnxiety
97
levels of anxiety after the assessment.
3.2.2.2 The Correlation between Total Scores on
the CARS Post-test Questionnaire and the
Average Skin Conductance Readings on the
Glove during the Entire Assessment was
Calculated
This correlation was calculated to investigate
whether the result found in 3.2.2.1 was caused by
inaccurate reading of anxiety during the last minute.
Results:
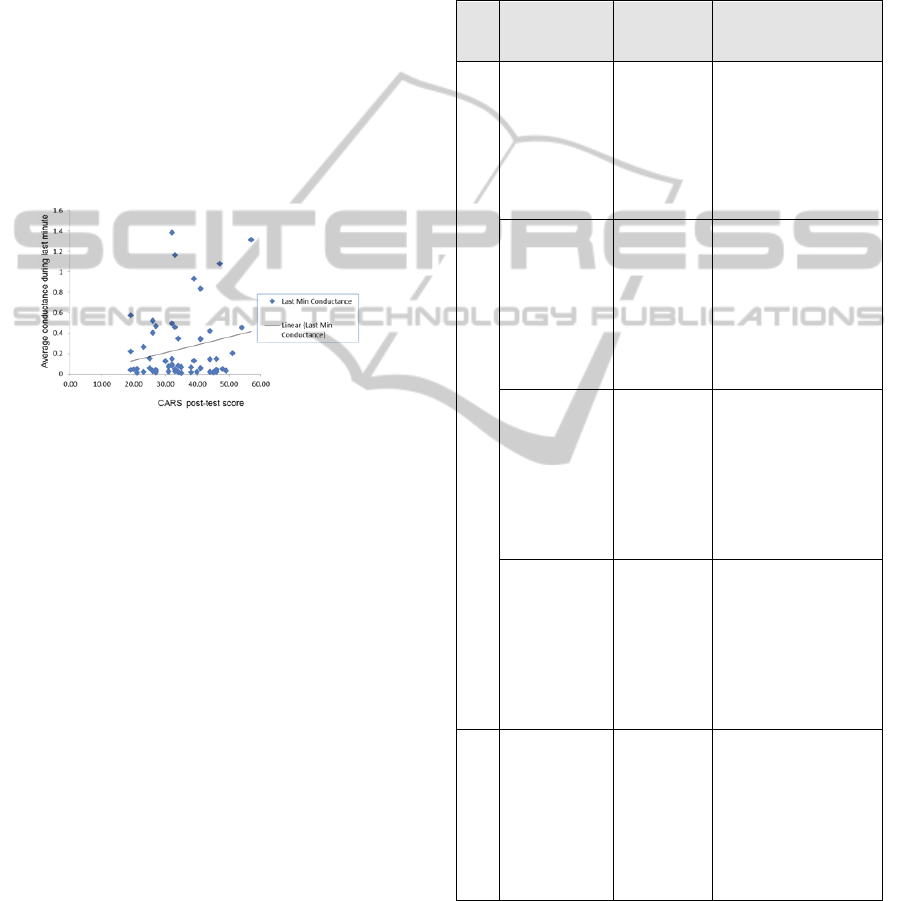
There was no significant correlation (r = 0.229; p >
0.05) between the total scores on the CARS post-test
questionnaire and the average readings of the glove
during the entire assessment (see Figure 5 for the
scatterplot).
Figure 5: Average conductance during entire assessment
as a function of CARS post-test score.
Finding:
This result confirms the conclusion made in 3.2.2.1.
The sensor glove and the CARS post-test
questionnaire potentially provide different
information regarding levels of anxiety after the
assessment.
In order to confirm the finding that the sensor
glove and the CARS questionnaire potentially
provide different information regarding levels of
anxiety, another statistical test, Multivariate
Analysis of Variance (MANOVA) was conducted to
confirm the findings that were established from
using the correlation test.
Participants were divided into three categories:
those with high anxiety scores, those with medium
anxiety scores, and those with low anxiety scores, all
according to the skin conductance readings of the
sensor glove. The CARS pre-test scores and the
CARS post-test scores were then compared among
these three groups.
i. If the glove and the CARS questionnaires
provide the same information, we would expect
that there would be differences in the self-
reported anxiety scores between these three
groups.
ii. If the glove and the CARS questionnaires
provide different information, we would expect
that there would be no differences in the self-
reported anxiety scores between these three
groups.
Table 1: Summary of findings regarding anxiety before
and after assessment.
Stat.
Test
Variables Result Finding
CORRELATION
CARS pre-test
total score,
average skin
conductance
reading in first
minute
No significant
correlation
(r = 0.144;
p > 0.05)
Sensor glove (first
minute) and CARS
pre- test questionnaire
potentially provide
different information
about levels of anxiety
before the assessment.
CARS pre-test
total score,
average skin
conductance
reading for the
entire
assessment
No significant
correlation
(r = 0.168;
p > 0.05)
Sensor glove and CARS
pre-test questionnaire
potentially provide
different information
regarding levels of
anxiety before the
assessment.
CARS post-test
total score,
average skin
conductance
reading in last
minute
No significant
correlation
(r = 0.192;
p > 0.05)
Sensor glove (last minute)
and CARS
post- test questionnaire
potentially provide
different information
regarding levels of
anxiety after the
assessment.
CARS post-test
total score,
average skin
conductance
readings for
entire
assessment
No significant
correlation
(r = 0.229;
p > 0.05)
Sensor glove and CARS
post-test questionnaire
potentially provide
different information
regarding levels of
anxiety after the
assessment.
MANOVA
CARS pre-test
scores, CARS
post-test scores
(among 3 groups
of different
anxiety levels
according to
sensor glove)
No significant
differences
(F = 0.798;
p > 0.05)
Confirms that sensor
glove and CARS
questionnaire potentially
provide different
information regarding
levels of anxiety.
Results:
No significant differences (F = 0.798; p > 0.05) were
found in the self-reported anxiety scores (for the pre-
test and the post-test) between these three groups.
Finding:
This result confirms that the sensor glove and the
PhyCS2015-2ndInternationalConferenceonPhysiologicalComputingSystems
98

CARS questionnaire potentially provide different
information regarding levels of anxiety.
A summary of the statistical tests concerning the
anxiety according to the sensor glove and the CARS
questionnaire is presented in Table 1.
From these results the first hypothesis, H1 cannot
be rejected, since p > 0.05. Although statistical tests
showed no significant correlations between CARS
scores and the glove readings, the scatterplots reflect
the small positive correlation between conductance
measurements and CARS scores; possibly those
correlations are small (and not statistically
significant) because of much noise in the data. Note
the scatterplots show the conductance measurements
to be close to zero (below 0.2) for most subjects.
However, for about 18 other subjects the
conductance measurements are very variable, some
values are up to about 1.2. Moreover, the researchers
encountered a challenge of non-continuous
measurements of skin conductance. With some
participants the EREC glove momentarily stopped
recording the skin conductance because the sensors
of the glove were no longer in contact with the skin
despite the Velcro straps that were used to tighten
the sensors to the skin. This could have caused noise
in the data.
The second hypothesis was stated as:
H2: There is no relationship between computer
anxiety and performance as measured by a sensor
glove and a computer anxiety questionnaire.
This hypothesis was addressed by performing
correlations between the CARS scores and
performance scores, and the skin conductance
readings with performance scores. Performance was
measured as the percentage of tasks which were
completed successfully/correctly by each participant.
Table 2: Summary of findings regarding anxiety and
performance.
Stat.
test
Variables Result Finding
CORRELATION
CARS pre-test
score,
performance
score
Significant negative
correlation
(r = -0.331; p <
0.05)
The higher the
levels of anxiety,
the poorer the
performance on
the assessment.
CARS post-test
score,
performance
score
Significant negative
correlation
(r = -0.332; p <
0.05)
Average skin
conductance
readings during
the entire
assessment,
performance
score
Significant negative
correlation
(r = -0.300; p <
0.05)
In order to determine whether there is a
relationship between anxiety and performance, the
analyses shown in Table 2 were performed.
Considering the results in Table 2, the second
hypothesis, H2 can be rejected at p < 0.05 in all the
related tests.
3.3 Observations
When the participants performed the nine tasks on
the computer, two measurements were recorded,
namely the time-on-task and the task success rate.
Moreover, the behaviours which were exhibited by
the participants when performing the tasks were
observed and recorded. The three types of
recordings are presented in the subsequent sections.
3.3.1 Time-on-Task and Task Success
A maximum of three minutes was allocated to each
of the nine tasks that a participant was required to
perform in a word processor application. Time-on-
task was recorded for each task and when three
minutes had elapsed the participant was asked to
stop and continue with the next task, even if the
current task was incomplete. Table 3 depicts the
time-on-task and task success rate for each of the
nine tasks.
From Table 3, it can be seen that the last task
“Save” was performed in the longest time (average =
2 min, 41s) while the task “Bold” (average = 37s)
took the shortest time to complete.
Table 3: Average, minimum and maximum durations of
tasks.
Tasks Time-on-task
Task success
(%)
Average
time-on-task
(mm:ss)
Minimum
time-on-task
(mm:ss)
Maximum
time-on-task
(mm:ss)
Center 1:13 0:08 3:00 84.2
Change to
italic
0:49 0:06 3:00 84.2
Change line
spacing
2:01 0:15 3:00 43.9
Cut & Paste 2:16 0:38 3:00 43.9
Change font
size
0:39 0:06 3:00 84.2
Bold 0:37 0:06 3:00 93.0
Underline 0:56 0:13 3:00 89.5
Bullet 1:37 0:25 3:00 77.2
Save 2:41 0:29 3:00 10.2
Table 3 also depicts the task success rate. The
ComparingtheSensorGloveandQuestionnaireasMeasuresofComputerAnxiety
99

task success rate according to each of the nine tasks
shows the percentage of participants who completed
successfully/correctly each of the tasks. In
agreement with the time-on-task, the task success
rate shows that the task “Save” had the lowest task
success rate (10.2%) while the task “Bold” had the
highest rate (93.0%). This means that the majority of
participants failed to complete the task “Save”
successfully, but executed the task of “Bold”
successfully. Considering both time-on-task and
task-success, it can be seen that the task that most
participants failed to execute successfully was the
task that required the longest time to perform.
3.3.2 Observed Behaviours
As mentioned earlier, the participants were observed
as they were executing the tasks. Some behaviours
exhibited by the participants who were failing or
struggling to perform the tasks were: fidgeting in the
chair, tapping fingers on the table, moving closer
and away from the monitor, exclaiming in
bewilderment or disappointment, sighing, shaking
head in denial, constant blinking of eyes, trembling
hands, uttering words (for example, words that
pleaded with computer to do something), staring at
the monitor, and holding the face with two hands
with elbows on table. It was noted that among the
tasks that were performed, almost all the participants
struggled with the last task, which was to save the
document in a specified location. When they had to
complete this task, most participants exhibited some
of the above-mentioned behaviours. However, these
behaviours were also noticed when participants
performed a few of the earlier tasks.
3.4 Findings from Questionnaire Data
The following are the findings made from the data
collected from the pre-test and post- test
questionnaires where different themes were
discovered.
3.4.1 EREC Sensor Glove
Most of the participants described the glove using
phrases such as “interesting” and “comfortable.”
They stated that the glove did not disturb or distract
them when performing the tasks on the computer,
although they were “conscious” that they were
wearing it.
3.4.2 Participants’ Reported Emotions
The participants felt excited, afraid, neutral and
frustrated while using the computer. However, the
majority felt excited when they thought of using a
computer, while they were using it, and even after
using it.
Regarding the tasks which they performed, the
majority of the participants described that they were
stressed rather than anxious or afraid. Most
participants were stressed by the last task, “Save.”
The reasons that participants provided for being
stressed and/or anxious were classified into eight
categories namely: lack of knowledge on how to
perform the task; difficulty in performing the task;
consciousness of time; exercised caution to avoid
mistakes; uncertainty of whether a task was
performed correctly; lack of remembrance; first
time experience; and lack of confidence to execute
the task correctly.
4 DISCUSSION
The following discussion is based on the results
regarding the sensor glove, the reported emotions
experienced by the participants, the observations and
the statistical findings.
4.1 EREC Sensor Glove
Since most participants found the glove to be
“interesting” and “comfortable”, and not disturbing
nor distracting, it can be concluded that the sensor
glove, as a measuring tool, is suitable in terms of
comfort and can therefore be recommended for other
studies. Nonetheless, the size of the sensor glove in
relation to the size of the participants’ hands should
be carefully considered. In this study, the glove was
found to be too small for some hands and in some
cases the wires were disconnected as a consequence
of the glove being stretched. In such instances of
discontinuous data, the data was discarded in order
to use valid data only.
4.2 Emotions
As stated earlier, the participants reported having
experienced various emotions, which included
excitement, anxiety (or fear) and frustration, while
using the computer. It can be expected that the
participants were excited and anxious
simultaneously because experiencing something
interesting for the first time can be exciting. At the
same time one can be somewhat afraid of the
unknown. The feeling of frustration can also be
expected when one fails to execute tasks, especially
PhyCS2015-2ndInternationalConferenceonPhysiologicalComputingSystems
100

when one “was careful not to do mistakes” or felt
that “time was running out and I was not doing it”,
as some of the participants reported. It is most likely
that participants experienced frustration which led to
stress as they were performing the last task which
most participants failed to complete.
4.3 Findings from Observations and
Questionnaires
Considering the results from the observations, it is
apparent that the last task caused the participants
anxiety or stress. The participants took the longest
time to perform it and struggled the most to execute
it (see Section 3.3.1). Moreover, the participants
reported that they felt stressed when performing it
(see Section 3.4.2). Moreover, most of the
behaviours which were exhibited by the struggling
participants (see Section 3.3.2) were observed when
the last task was executed. These behaviours
exhibited by the participants who were failing or
struggling to perform tasks (for example, sighing,
shaking head in denial, and constant blinking of the
eyes) were observed, as mentioned in Section 3.3.2
The behaviours (for example, trembling) were
mentioned in literature (Mayo Clinic, 2012; Rogge,
2011) as behaviours common to individuals
experiencing computer anxiety or stress. It was
therefore evident that at some point the participants
experienced anxiety, taking into consideration that
stress and anxiety are difficult to differentiate as
mentioned in Section 1.1.
4.4 Computer Anxiety and
Performance
Statistically significant negative correlations were
found between anxiety and performance, suggesting
that a relationship between performance and anxiety
probably exist; the higher a person’s levels of
anxiety, the poorer he/she performed on the
assessment. Since this relationship was found from
the results of both the CARS questionnaire and the
sensor glove, we conclude that computer anxiety
possibly has an effect on the performance of the
users performing tasks on the computer.
4.5 Reviewing the Goals of the Study
The first goal of this study was to establish whether
using a sensor glove provided complementary
knowledge to an existing computer anxiety
questionnaire. No significant correlations were
found between the measurements of anxiety using
respectively the sensor glove and the CARS
questionnaire (see Table 1). One possible
interpretation of this finding is that the sensor glove
does not measure the same variable as the CARS
anxiety questionnaire, and thus potentially provides
different information on anxiety than the CARS
questionnaire. Of course, the absence of significant
correlations would also be explained by either one of
the instruments, or both, not being suitable measures
of anxiety. However, both measurements were
significantly correlated with performance, which
suggests that both instruments return a signal, and
not just noise. The CARS questionnaire has been
validated as a measurement of anxiety whereas the
sensor glove has not been validated for that specific
measurement. The sensor glove measures skin
conductance or GSR which, according to literature
(Lin and Hu, 2005; Picard, 1997), has been used
successfully to measure stress. What remains to be
investigated is the relationship (or a distinction)
between computer anxiety and stress because it is
evident that anxiety and stress, though different, are
closely related.
The second goal of this study was to relate
computer anxiety of participants, as measured by a
sensor glove and an anxiety questionnaire,
respectively, to performance. Our findings suggest
that a relationship between anxiety and performance
probably exists, namely the higher an individual’s
levels of anxiety, the poorer he/she performed on the
assessment. This finding was also reported by
Glaister (2007) and Parayitam et al., (2010), but
contradicts the finding of Olufemi and Oluwatayo
(2014) who found no significant differences in
performance scores in subjects with high, moderate
and low computer anxiety. Again we can note that it
is difficult to distinguish between stress and anxiety.
The task that the participants failed to complete was
the one reported to cause the highest stress. In effect,
the majority of the participants indicated that they
experienced stress rather than anxiety as they were
performing the tasks.
4.6 Recommendations for Further
Research
The present study that investigated computer anxiety
using physiological measures is amongst the first of
its nature in a third world country.
Recommendations for further research are therefore
presented. Firstly, skin conductance readings of one
minute before and after interaction with the
computer may not have been optimal. This design
could have influenced the correlation between the
ComparingtheSensorGloveandQuestionnaireasMeasuresofComputerAnxiety
101

sensor glove and the CARS. No literature references
have been found on the optimal duration for reading
conductance. It is suggested that a research study be
conducted to establish the optimal timing of
conductance measurements using the sensor glove.
Secondly, it is noted that the measurements using
the sensor glove and the anxiety questionnaire,
respectively, had similar correlations with
performance, yet the two types of measurements of
anxiety were not significantly correlated. These
findings call for deeper investigation of objective
and subjective measures of computer anxiety in the
context of third world countries.
Thirdly, the participants were directly observed
while performing tasks in this study. Since the
participants were aware that they were being
observed, there is a possibility that the
measurements could have been influenced by this
awareness. Perhaps a study conducted with
participants who are oblivious of being watched
would produce different results.
Fourthly, since the start of this study, improved
versions of the sensor glove have appeared on the
market. Furthermore, the glove used in the present
study was small and volatile. Using the improved
version of the glove in similar investigations might
provide interesting results.
Fifthly, a study which includes another
instrument, such as a heart rate monitor could give
more understanding about computer anxiety. In this
study heart rate was not measured because the heart
rate monitor packaged in the EREC malfunctioned
and due to time constraints it could not be fixed.
The final recommendation for follow-up studies
is to establish the relationship between anxiety and
stress. Perhaps a study could be conducted where
both anxiety and stress questionnaires are employed.
The data from the two questionnaires could be
related to conductance data from the sensor glove.
The findings of such a study could provide more
insight about anxiety and stress when interacting
with a computer. A study that utilised a stress
questionnaire and conductance data (Lin and Hu,
2005) has already been performed. However, in that
study an anxiety questionnaire was not included.
5 CONCLUSIONS
This study investigated computer anxiety using
subjective (scores from an anxiety questionnaire)
and objective (conductance data from the sensor
glove) measures. The correlations between apparent
computer anxiety and performance were similar
using the two measures of anxiety. The study
findings confirmed the literature where it has been
stated that the higher the anxiety levels of an
individual, the poorer they are likely to perform.
Additionally, this study is amongst the first research
studies conducted in a third world country where
computer anxiety was measured using an objective
physiological instrument.
REFERENCES
Appelbaum, S. H. and Primer, B., 1990. An HRx for
computer anxiety. Personnel, 67(9), pp.8-11.
Aziz, S. and Hassan, H., 2012. A study of computer
anxiety of higher secondary students in Punjab.
International Journal of Social Sciences & Education,
2(2), pp.264-273.
Barreto, A., 2008. Non-intrusive physiological monitoring
for affective sensing of computer users. New
Developments, 85, pp.85-100.
Beckers, J. J. and Schmidt, H. G., 2001. The structure of
computer anxiety: A six-factor model. Computers in
Human Behavior, 17, pp.35-49.
Beckers, J. J. and Schmidt, H. G., 2003. Computer
experience and computer anxiety. Computers in
Human Behavior, 19, 785-797.
Beckers, J. J., Rikers, R. M. and Schmidt, H. G., 2006.
The influence of computer anxiety on experienced
computer users while performing complex computer
tasks. Computers in Human Behavior, 22(3), pp.456-
466.
Beckers, J. J., Wicherts, J. M. and Schmidt, H. G. (2007).
Computer anxiety: “Trait” or “state”? Computers in
Human Behavior, 23, pp.2851-2862.
Blignaut, P., Burger, A., McDonald, T. and Tolmie, J.,
2005. Computer attitude and anxiety. In M. Khosrow-
Pour, ed. Encyclopedia of Information Science and
Technology. Hershey: Idea Group Publishing. pp.495-
501.
Cambre, M. A. and Cook, D. L., 1987. Measurement and
remediation of computer anxiety. Educational
Technology, 27 (12), pp.15-20.
Chua, S. L., Chen, D. and Wong, A. F. L., 1999.
Computer anxiety and its correlates: A meta-analysis.
Computers in Human Behavior, 15, pp.609-623.
Critchley, H. D., 2002. Book review: Electrodermal
responses: What happens in the brain? Neuroscientist,
8(2), pp.132-142.
Dirican, A. C. and Göktürk, M. 2011. Psychophysiological
measures of human cognitive states applied in human
computer interaction. Procedia Computer Science, 3,
pp.1361-1367.
Glaister, K., 2007. The presence of mathematics and
computer anxiety in nursing students and their effects
on medication dosage calculations. Nurse Education
Today, 27(4), pp.341-347.
Heinssen, R. K. J., Glass, C. R. and Knight. L. A., 1987.
PhyCS2015-2ndInternationalConferenceonPhysiologicalComputingSystems
102

Assessing computer anxiety: Development and
validation of the computer anxiety rating scale.
Computers in Human Behavior, 3(1), pp.49-59.
Hismanoğlu, M., 2011. The elicitation of prospective EFL
teachers’ computer anxiety and attitudes. International
Online Journal of Educational Sciences, 3(3), pp.930-
956.
Isen, A. M. and Erez, A. 2006. Some measurement issues
in the study of affect. In A. Ong, & H. M. van
Dulman, eds. Oxford Handbook of Methods in Positive
Psychology New York. USA: Oxford University
Press. pp.250-265.
Kaiser, R. and Oertel, K., 2006. Emotions in HCI: An
affective e-learning system. Paper presented at the
2006 HCSNet Workshop on the Use of Vision in HCI.
Canberra, Australia, 01 November.
Karavidas, M., Lim, N. K. and Katsikas, S. L., 2005. The
effects of computers on older adult users. Computers
in Human Behavior 21(5), pp.697-711.
Kivikangas, J. M., Chanel, G., Cowley, B., Ekman, I.,
Salminen, M., Järvelä, S. and Ravaja, N., 2011. A
review of the use of psychophysiological methods in
game research. Journal of Gaming & Virtual Worlds,
3(3), pp.181-199.
Korobili, S., Togia, A. and Malliari, A., 2010. Computer
anxiety and attitudes among undergraduate students in
Greece. Computers in Human Behavior, 26(3),
pp.399-405.
Lin, T. and Hu, W., 2005. Do physiological data relate to
traditional usability indexes? Paper presented at the
Proceedings of the OZCHI 2005. Canberra, Australia,
23-25 November.
Longe, O. B. and Uzoma, O. V., 2007. Technophobia and
its impact on adults learning to use computers in south
western Nigeria. Journal of Information Technology
Impact, 7(1), pp.81-90.
Mayo Clinic, 2012. Anxiety. [online] Available at:
<http://www.mayoclinic.com/health/anxiety/DS01187
/DSECTION=symptoms> [Accessed 27 November
2013].
Merrill, D. B., 2013. Stress and anxiety. [online] Available
at:
<http://www.nlm.nih.gov/medlineplus/ency/imagepag
es/9951> [Accessed 26 November 2013].
Olufemi, O. A. and Oluwatayo, O. J., 2014. Computer
anxiety and computer knowledge as determinants of
candidates’ performance in computer-based test in
Nigeria. British Journal of Education, Society &
Behavioural Science, 4(4), pp.495-507.
Parayitam, S., Desai, K. J., Desai, M. S. and Eason, M. K.,
2010. Computer attitude as a moderator in the
relationship between computer anxiety, satisfaction,
and stress. Computers in Human Behavior, 26(3),
pp.345-352.
Peter C., et al., 2007. EREC-II in use – Studies on
usability and suitability of a sensor system for affect
detection and human performance monitoring. In J.
Jacko ed. Human- Computer Interaction, Part III,
HCII 2007, LNCS 4552. Heidelberg: Springer-Verlag.
pp.465-474.
Picard, R. W. and Healey, J., 1997. Affective wearables.
Personal Technologies, 1(4), pp.231-240.
Picard, R. W. and Scheirer, J., 2001. The galvactivator: A
glove that senses and communicates skin conductivity.
Paper presented at the Proceedings of the 9th
International Conference on Human-Computer
Interaction. New Orleans, USA, 05-10 August.
Princeton University, 2013. Wordnet – A lexical database
for English. [online] Available at:
<http://wordnetweb.princeton.edu/perl/webwn?s=galv
anic skin response> [Accessed 26 November 2013].
Rogge, T., 2011. Stress and anxiety. [Online]. Available
at:
<http://www.nlm.nih.gov/medlineplus/ency/article/00
3211.htm> [Accessed 27 November 2013].
SwordMedical, 2010. Introducing the enhanced
bodymedia sensewear system. [online] Available at:
<http://www.swordmedical.ie/PRODUCTS/upload/Fil
e/Body%20Media/SW- brochure.pdf> [Accessed 13
March 2011].
Ursavas, Ö. F. and Teo, T., 2011. A multivariate analysis
of the effect of gender on computer anxiety among
elementary school teachers. British Journal of
Educational Technology, 42(2), pp.E19-E20.
ComparingtheSensorGloveandQuestionnaireasMeasuresofComputerAnxiety
103
