
Graphical Debugging of Distributed Applications
Using UML Object Diagrams to Visualize the State of Distributed Applications at
Runtime
Andreas Koch and Albert Z
¨
undorf
Software Engineering Research Institute, Kassel University, Wilhelmsh
¨
oher Allee 73, Kassel, Germany
Keywords:
Tool, Debug, Distributed, UML2, Objectdiagram, Eclipse.
Abstract:
While debugging is one of the most time consuming tasks software developers perform, the tool support,
especially for distributed applications, is lacking according to many professional developers. The Visual De-
bugger is an approach to provide an easy-to-use tool which gives software developers an abstract view on the
current state of their application in debugging sessions. While similar tools for non distributed applications al-
ready exist, the Visual Debugger addresses the more complex debugging scenarios in distributed applications.
Therefore, several views with different levels of abstraction of the current state of an application are provided.
Although the approach may be adapted to other object oriented programming languages, the current target of
the Visual Debugger is languages running on the Java Virtual Machine with the focus on Java.
1 INTRODUCTION
Debugging is one of the most time consuming tasks in
the daily work of a software developer. To tackle this
challenge, many tools were developed in research as
well as in the industry. Additionally, in each modern
IDE as Eclipse, IntelliJ IDEA or NetBeans some kind
of debugging support is already integrated. Although
so much work was invested into this area, there are
still many professional software developers not sat-
isfied with the provided support of debugging tools.
(Layman et al., 2013)
Started in a research project with industrial part-
ners, the Visual Debugger presented in this paper is
an approach to fill the gap of an easy-to-use, but help-
ful visualization of the state of distributed and non
distributed Java applications as a helper in debugging
sessions.
To explain the usage of the Visual Debugger, at
first it must be positioned in the debugging process.
This process can be separated into several steps:
1. An unwanted behaviour of an application takes
place.
2. The problematic part of the source code is located.
3. The source code is changed to prevent this be-
haviour.
4. The test scenario is reproduced to ensure this
changed behaviour is correct.
The steps 1, 3 and 4 are already well supported by
tools and frameworks like logging or testing frame-
works, mature source code editors and more. In con-
trast, the second step is the most crucial and most time
consuming part of this process because there are a lot
of different sources of an unwanted behaviour, that
must be considered: logical failures in algorithms,
performance issues, not catched exceptions and many
more.
Most of these sources result in the same simple
outcome: values are changed or not changed as ex-
pected. To find a reproducible test scenario to trigger
unwanted behaviour can be challenging. But even if
this scenario is found, the search for the erroneous
source code is difficult. One common problem is the
inability to understand the current state of the appli-
cation in a reasonable amount of time when the un-
wanted behaviour occurs.
Apart from the research area, in the industry, most
available debugging tools focus on a textual view on
the application state. One example, which can be
found in most IDEs and therefore is probably the most
used tool during debugging sessions, is a tree repre-
sentation of the runtime state of objects like the vari-
ables view in the Eclipse IDE in figure 1. This has
indeed proven to be useful in many debugging situa-
tions, but tends to be less helpful in object oriented
programming languages when the application state
becomes more complex. One reason is the visualiza-
223
Koch A. and Zündorf A..
Graphical Debugging of Distributed Applications - Using UML Object Diagrams to Visualize the State of Distributed Applications at Runtime.
DOI: 10.5220/0005233202230230
In Proceedings of the 3rd International Conference on Model-Driven Engineering and Software Development (MODELSWARD-2015), pages 223-230
ISBN: 978-989-758-083-3
Copyright
c
2015 SCITEPRESS (Science and Technology Publications, Lda.)
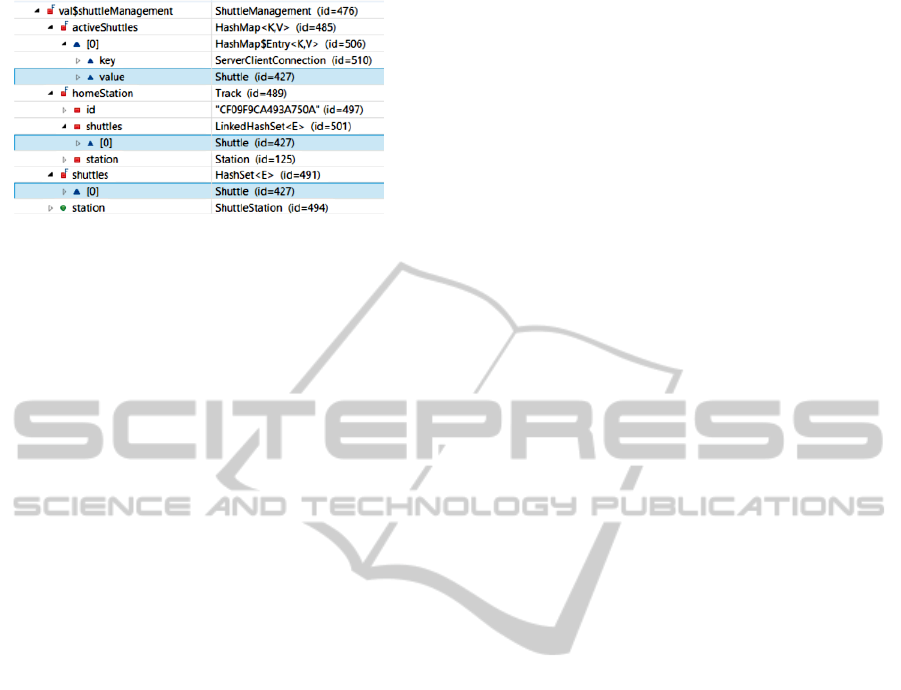
Figure 1: A snippet of the Java heap in the Eclipse variables
view.
tion of a graph structure in a tree. Relations between
objects are only visible from one object to another.
This results in duplications of objects in the variables
view, when different objects have relations with the
same child. As an example: browsing the state of the
topmost object in figure 1 (id=476), the highlighted
object with id 427 is reachable (and therefore visible)
three times with different paths. Another reason this
view is problematic in distributed (or concurrent) sce-
narios is, it only provides data for the current state
the user is looking at. Resuming the program exe-
cution results in losing the current viewpoint and the
state needs to be re-evaluated again at the next inter-
ruption of the execution. The situation is worsened
when a distributed application comes into play. This
increases the complexity of the state of an applica-
tion. Usually objects live on different Java Virtual
Machines (JVM) on the same or even on physically
separated devices.
Hereinafter, the terms object and instance are used
in the following way. While the term instance is used
to describe the instantiation of a class in a (single)
JVM, object is used when two or more equals in-
stances on different JVMs are meant.
Understanding the current state of a distributed
application becomes more difficult, because during
a debugging session much more state changes take
place. Each time the developer is forcedoo to re-
evaluate the state. The identification of different in-
stances of an object on different JVMs complicates a
debugging session as these state changes force devel-
opers to identify equal instances on different JVMs
again and again. Additionally, unexpected program
behaviour is more difficult to reproduce, which of-
ten results in repeatedly executed debugging sessions
until the unwanted behaviour appears again and the
source behind it can be located. During the debug-
ging sessions a lot of time is spent to understand the
current state. The focus of the Visual Debugger is to
provide an abstract view on the part of the application
state that is relevant for a debugging session.
Due to the different requirements distributed and
non distributed applications have, the Visual Debug-
ger provides two modes. One, which targets mainly
on applications running in a single JVM and another
mode, that adds additional functionality to support the
visualization of distributed applications. This paper
focuses on the second mode, but explains in the fol-
lowing sections some basic behaviour which is valid
for both modes and necessary to understand the sec-
tions focused on distributed scenarios.
2 RELATED WORK
Although graphical debugging tools are researched
quite well, they are rarely found as commercial prod-
uct. Especially when distributed applications come
into play, most existing tools are limited in their us-
ability. Besides, many of these tools focus on visu-
alizing program behaviour instead of the application
state.
Some tools that follow a similar idea as the Visual
Debugger are Jive (Gestwicki and Jayaraman, 2005)
and the eDobs (Geiger and Z
¨
undorf, 2002) (Geiger
and Z
¨
undorf, 2006). But both tools lack of support for
the special requirements of distributed applications.
There are tools, that are targeted at distributed ap-
plications, but serve a different use case. One ex-
ample for this tool section is the JRastro (da Silva
et al., 2003). While the Visual Debugger provides
an abstract view on the state of the application during
the execution, JRastro helps with finding performance
problems by visualizing the communication between
the different nodes of the application. Tools follow-
ing a similar idea than JRastro are Atropos (L
¨
onnberg
et al., 2011), JACOT (Leroux et al., 2003) or JaVis
(Mehner, 2001).
JAVAVIS (Oechsle and Schmitt, 2001) shows the
internal behaviour and state of an application with
UML sequence and object diagrams. But its usability
for distributed applications is limited as it is targeted
on sequential program execution.
JAN (L
¨
ohr and Vratislavsky, 2003) uses object di-
agrams to visualize the state of an application, but its
focus is on the animation of different states of an ap-
plication to understand the behaviour of a program in-
stead of debugging it.
3 ARCHITECTURE OF THE
VISUAL DEBUGGER
To visualize a complex graph structure like the Java
heap, an obvious choice is to use an object diagram.
MODELSWARD2015-3rdInternationalConferenceonModel-DrivenEngineeringandSoftwareDevelopment
224

In the Visual Debugger standard UML2 object dia-
grams are used. While this forced us to use a strongly
formalized and predefined syntax, it provides easy in-
teroperability with other tools. Each model created
during a debugging session can be used as input in
other UML compatible tools, for example as part of
the test documentation.
Three of the main design goals were to create ac-
ceptance, simplicity and usability. Creating accep-
tance is difficult because many software developers
have an existing workflow and a given set of tools
they use in their daily work. To get into this work-
flow a tight integration into the tools they use is nec-
essary. For Java developers this includes on the one
hand developing a tool for their IDE of choice and on
the other hand integrating the tool into already exist-
ing tools in the IDE itself. To achieve simplicity, the
information to be shown in the object diagram should
be as few as necessary for the current debugging ses-
sion and easily extendible/reducible by the user. Us-
ability can mainly be achieved with a well designed
UI. This is one point many existing research tools for
debugging are lacking of. Therefore, we decided to
use an existing object diagram editor and extended it
when necessary.
As already mentioned, the Visual Debugger was
not planned as stand-alone application but a tool in-
tegrated into existing IDEs. Due to their plug-in sup-
port, the first choice was to develop it as a plug-in
for the Eclipse IDE. The decision in favour of Eclipse
leads to several benefits. At first, it is well established
in the open source as well as in the commercial com-
munity. Eclipse is based on the Open Service Gate-
way initiative (OSGi) specification and has an easy to
use plug-in architecture. At last, with the Java Devel-
opment Tools for Eclipse (JDT) there is a layer avail-
able for the Java Debug Interface (JDI).
The drawback is that a tight entanglement with the
Eclipse IDE must be provided for a good usability.
To antagonise a too strong coupling the Eclipse and
JDT related parts of the Visual Debugger are split into
Eclipse specific and more general plug-ins.
With the focus on Java applications the data nec-
essary to visualize the heap must be retrieved directly
from the JVM. Running a JVM application in the de-
bug mode makes those data accessible via the JDI.
The JDI is a component in the Java Platform Debug-
ger Architecture (JPDA). It provides a set of inter-
faces for retrieving and requesting this information.
A common way to request data from a JVM is to reg-
ister EventRequests which notify each requester with
an Event, when they are triggered. There are several
types of events. The most important type for the Vi-
sual Debugger is the LocatableEvent. These are re-
lated to the source code and are triggered, for exam-
ple, when a specific line in the source code is exe-
cuted, a method is called or the field of an object is
changed. Besides, there are events that notify about
started/stopped threads respectively loaded/unloaded
classes in a JVM or state changes of the JVM itself.
On top of the JDI, Eclipse delivers with the JDT
an easy-to-use layer to access the heap of a JVM.
The JDT is a mature framework and used in almost
all debugging tools integrated into the Eclipse IDE.
It provides utilities to register requests, collect values
or control the program execution with customizable
breakpoints.
As written before the Visual Debugger uses no
own implementation of an object diagram editor, but
an already existing one. The UML Lab object dia-
gram editor is an intuitive editor with powerful lay-
outing mechanisms. Although it is a commercial tool
in general, it is completely free of charge when used
for academic purposes. Thus, it matches the needs of
the Visual Debugger to address academical users as
well as industrial ones. The editor is based on the
(open source) Graphical Editor Framework (GEF),
which is the de-facto standard for developing editors
for Eclipse. Therefore extensibility of the object dia-
gram editor in UML Lab is given without the need to
have any deeper knowledge about the (closed source)
editor itself.
4 EXAMPLE PROJECT
To show different use cases of the Visual Debugger,
an example project is explained briefly in the fol-
lowing. The project simulates transportation shuttles.
There are two kinds of nodes available: on the one
hand the Shuttle Management Node and on the other
hand the Shuttle Node. While the first kind only exists
once in this distributed application, the second one
can be started multiple times, one for each available
shuttle. The term Node means in this scenario a dif-
ferent Java Virtual Machine.
Both components share the majority of their data-
model, expecially all objects have the property id.
This property is used as an unique identifier to find
the same objects on different nodes. The simulation
itself is rather simple. Shuttles move from track to
track while people are waiting at stations, which may
be connected to a track. When a shuttle reaches a
track with a station, all people will enter the shuttle,
unless its maximum capacity is reached.
GraphicalDebuggingofDistributedApplications-UsingUMLObjectDiagramstoVisualizetheStateofDistributed
ApplicationsatRuntime
225
5 VISUALIZING A HEAP OBJECT
AS A DIAGRAM OBJECT
Before we have a deeper look into the visualization
of distributed applications, the visualization of a heap
object in general will be explained. Using the UML2
object diagrams, the formal specification is already
given. Each instance on the Java heap is mapped to an
object (InstanceSpecification) in the diagram. Each
primitive variable of an instance is mapped to an at-
tribute assignment in its object in the diagram. Each
reference to another non primitive Java instance is
translated into a link (InstanceSpecification) between
the two corresponding objects in the diagram.
According to the UML2 specification each In-
stanceSpecification in an object diagram must be re-
lated to a Classifier to define the type of this instance.
If the InstanceSpecification represents an object, this
has to be a Class, if it is a link, this has to be an Asso-
ciation. Similar requirements exist for the other arte-
facts in an object diagram like Slots or Types. As a re-
sult, it is necessary to maintain a class diagram while
the object diagram is created and modified.
To create this class diagram, the necessary in-
formation must be extracted from the runtime data.
As this diagram shall be accessible over at least one
whole debugging session, a mapping must be per-
sisted. Table 1 shows equivalent mappings of the dif-
ferent artefacts from the JDI, the JDT and the UML2
meta-model. While Class, Property and Interface can
be mapped easily, the empty spaces in the other rows
indicate that not for each element an exact one-to-one
mapping can be found. Especially associations must
be treated in a specific way. On the one hand, they can
be used uni- or bidirectional and on the other hand, a
bidirectional association can be a composition or an
aggregation. The last two examples are not supported
by the Visual Debugger, because they are in most sce-
narios not identifiable by inspecting only the runtime
data. An inspection of the source or byte-code would
be necessary. As the detection of those structures is
difficult, and the value of these additional information
is limited, we currently ignore these special cases. To
identify uni- and bidirectional associations different
approaches were tested. Finally, this led us to an ap-
proach where no association should be refactored af-
ter its definition. Therefore the object graph in the
JDT is analyzed as a whole and pairs of object in-
stances referencing each other are searched. Each of
those pairs results in a bidirectional association and
all other found references become an uni-directional
association.
In addition to the differentiation between uni- and
bidirectional, the cardinality of an association must
be determined; is it a one-to-one, a one-to-many
or a many-to-many association. This can be easily
achieved by looking at the type of a field. If it is a
Collection or an Array, the property of the associa-
tion is to-many; to-one otherwise. If one direction
is to-many, the collection instance in the heap is ab-
stracted into direct links to the contained objects.
Table 1: Comparison of the mapping artefacts from
JDI (com.sun.jdi), JDT (org.eclipse.jdt.internal.debug.core.
model) and the UML2 meta-model.
JDI/JDT UML2
ClassType / JDIClassType Class
Field / (JDIFieldVariable) Property
InterfaceType / JDIInterfaceType Interface
PrimitiveType / — PrimitiveType
ArrayType / JDIArrayType —
— / — Association
While the creation of the class diagram is done
automatically without the user noticing it, the object
diagram is usually only changed by direct input from
the user. To get a responsive UI for the tool the stor-
age of the mapping data of object diagrams is even
more important for providing a fast synchronization
process.
Table 2 shows the different mapping pairs between
the UML2 meta-model and the JDT interfaces. The
mappings are straightforward.
Table 2: Comparison of the mapping artefacts from JDT
and the UML2 meta-model.
JDT UML2
JDIObjectValue InstanceSpecification
JDIPrimitiveValue LiteralSpecification
JDIObjectValue InstanceValue
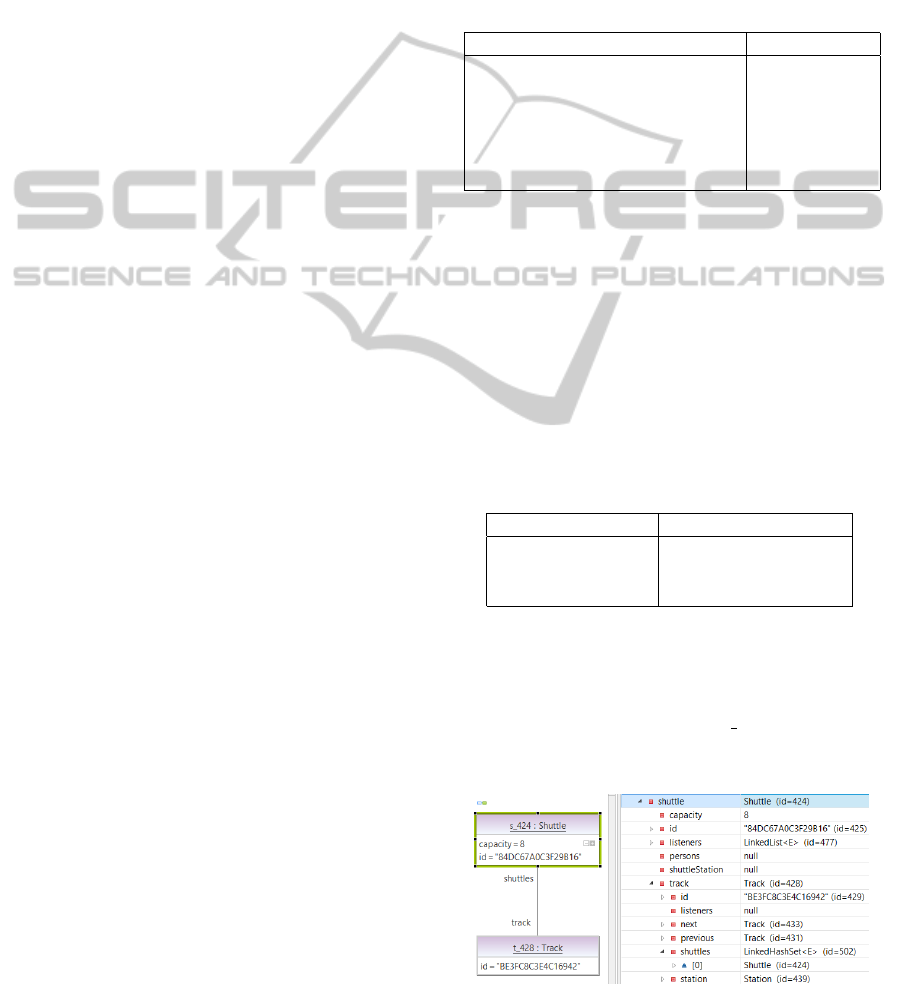
To give an example of a visualized object, figure 2
compares an instance of the type Shuttle in the Eclipse
variables view on the right side with the correspond-
ing object in the Visual Debugger on the left side. The
visualization of the object itself (s 424) and its prim-
itive variables id and capacity is a direct one-to-one
mapping. Links are treated differently. The reference
Figure 2: Comparison of the object diagram visualization
with the same data in a tree.
MODELSWARD2015-3rdInternationalConferenceonModel-DrivenEngineeringandSoftwareDevelopment
226

to the track (t 428) on the right side equals the link be-
tween the two objects on the left side. At the bottom
in the variables view a back reference from the track
instance to the shuttle instance via the shuttles collec-
tion indicates, that this link is bidirectional, which can
be seen in the diagram on the left side, too.
6 THE SYNCHRONIZATION
PROCESS
In the following section a deeper look into the under-
lying synchronization process of transforming heap
data to UML2 objects and vice versa is taken. This
process can be separated into two different modes.
As a short definition for these modes, one could
say:
Batch Mode. This mode is active when a whole JVM
or one or more separate threads are paused.
Live Mode. This mode is active when a JVM is not
paused in any kind.
Per definition both modes can be active at the
same time, when one or more threads are paused, but
not the whole JVM. Depending an the currently ac-
tive mode(s), the interaction with the object diagram
is significantly different.
Generally, the Visual Debugger is designed to be
fault tolerant to occurring errors within the synchro-
nization process. One quite regular error scenario
would be a failed data retrieval from a JVM while the
synchronization is in process. This specific task will
then be postponed and repeated later. The drawback
of this approach is that the object diagram may be in
an asynchronous state to the heap data for an unde-
fined time.
6.1 Batch Mode
With the IDebugEventSetListener the JDT provides
an easy method to react to state changes of the JVM
or single threads. Each time a state change indicates
a paused thread/JVM, the batch mode of the Visual
Debugger runs a full synchronization of the current
object diagram.
Each synchronization cycle is structured as fol-
lows: At first, each (visible and invisible) object in
the diagram is taken and its current data is synchro-
nized with the runtime heap data. When these tasks
are finished the post synchronization tasks are trig-
gered. The most important task is the synchronization
of links. As already said, links must be treated sepa-
rately, because a link is usually based on the combina-
tion of several artefacts in the runtime data. The link
synchronization consists of the following steps:
1. All existing links in the diagram are searched
2. For each, its existance is checked in the Java heap
3. For all objects in the object diagram, the runtime
object is retrieved and all non primitive fields with
a value not equal null are collected
4. For each non primitive field, it is considered part
of a new link
5. All possible link candidates found in the last step
are evaluated
(a) If the properties of two of them belong to the
same association, they are merged
(b) If the properties of two of them do not belong
to an association but they cross-reference each
other, they are assumed as bidirectional associ-
ation and they are combined. This is a trade-
off in the algorithm to detect bidirectional as-
sociations. This can lead to false positives, but
prevents object diagrams flooded with unidirec-
tional links.
6. For every remaining link candidate a link in the
object diagram is created, the other ones are
deleted
The described evaluation of the runtime data is exe-
cuted sequentially to ensure that all class and object
diagram parts are updated correctly before the link
evaluation starts.
Any interaction with the object diagram is only
available during batch mode. This includes adding
new objects to the object diagram as well as the au-
tomatic expansion of the object diagram based on the
already existing content.
6.2 Live Mode
The live mode is active when a JVM is not paused
entirely. As long as at least one thread is running,
the live mode is still active for this JVM. Its synchro-
nization behaviour is based on EventRequests from
the JDI. These requests can be registered in a run-
ning JVM to receive data updates without pausing
threads in the JVM. To be more precise threads are
actually stopped for a short amount of time to react
to events (triggered by the requests), but automati-
cally resumed afterwards. The event handling is done
asynchronously to minimize the effect on the runtime
behaviour of the JVM. This enables the object dia-
gram to be updated without the user noticing an im-
pact on the program execution. There are several re-
quest types available in the JDI, but only the Modif-
cationWatchpointRequest, AccessWatchpointRequest,
GraphicalDebuggingofDistributedApplications-UsingUMLObjectDiagramstoVisualizetheStateofDistributed
ApplicationsatRuntime
227

MethodEntryRequest and MethodExitRequest types
are used in the Visual Debugger.
The ModifcationWatchpointRequest can be regis-
tered on a field of a class. This can be a field in general
or restricted to a specific instance of a class to reduce
the number of events to evaluate. This request type
is used to supervise all primitive fields and all to-one
links.
The AccessWatchpointRequest, MethodEntryRe-
quest and MethodExitRequest types are used to su-
pervise to-many links. As mentioned earlier, to-many
links can be based on a variety of Java components;
each subtype of Collection, arrays or an own imple-
mentation of a data structure. To support each of them
with a reasonable effort, a general approach must be
available. Additionally, for specific types like Arrays
or commonly used subtypes of the Collection inter-
face like LinkedList or HashSet a specific handling is
implemented due to runtime reasons.
The general approach is mainly based on the
MethodEntryRequest and MethodExitRequest. For
each field identified as source of a to-many link, the
according instance is supervised by adding a Meth-
odEntryRequest and a MethodExitRequest to each
method the target type has. Every time a Method-
EntryRequest is triggered, the field value and all in-
stances it references are analysed. When the Method-
ExitRequest of the same method is triggered, the field
value is analysed again and the delta is calculated.
Any new contained object results in a new link, each
removed object triggers the deletion of the according
link. To optimize the general approach MethodEn-
tryRequests are only evaluated as long as no other
evaluation is in process. This prevents unnecessary
calculations during call chains within the same object.
For specific class types like LinkedList or HashSet the
knowledge about the source code of the class can be
used to improve the runtime of the analysis. Only
methods that affect the content of the underlying col-
lection need to be considered. This usually excludes
the majority of methods which access the collection
read-only.
As especially primitive values can change very of-
ten during runtime, not every event needs to be and
can be evaluated in detail. The evaluation is scheduled
with an interval from 500ms, which led to the best re-
sults for us. During this 500ms each event change is
represented as an internal LiveEvent. If a change af-
fects an already existing LiveEvent, the event is up-
dated, newly created otherwise. The mapping to a
LiveEvent must be done in the callback method of the
debug listener, because only during the callback the
JDI values of an event are stable. After each 500ms
all collected LiveEvents are evaluated asynchronously
and the object diagram is updated accordingly. To
prevent an unwanted behaviour during the synchro-
nization process because of an asynchronously up-
dated LiveEvent, each LiveEvent contains a stable and
an unstable state. The stable state is locked, when the
synchronization starts and unlocked, when it is fin-
ished.
7 CHALLENGES OF
VISUALIZING THE STATE OF A
DISTRIBUTED APPLICATION
All the previously explained behaviour does not differ
when debugging a distributed and a non distributed
application. However, a distributed application makes
additional demands on the Visual Debugger. This in-
cludes identifying shared objects as well as keeping
those shared objects updated in the object diagram.
In distributed applications some objects usually
exist on different JVMs, which means they are distinct
instances in separated JVMs. To work with these in-
stances the application must be able to identify them.
A common approach is to give an object an unique
identifier. This identifier is usually stored in the ob-
ject as a primitive value. Therefore the Visual Debug-
ger uses a couple of basic property names like id or
uuid to search for these identifiers. Additional prop-
erty names can be added via the preferences.
A significant difference between the visualization
of distributed and non distributed applications is the
usage of batch and live mode. In a non distributed
application the first entry point into a debugging ses-
sion is always the batch mode. As mentioned earlier,
adding objects to the diagram is only possible in batch
mode. A first breakpoint must be used to put all ob-
jects into the diagram which are interesting for this
session. At this point pausing all JVMs at once can
be necessary to avoid a race condition. When the pro-
gram execution is resumed the live mode is activated
and the visible objects are automatically updated until
the next breakpoint is reached or another event pauses
the program execution. This includes manually paus-
ing a JVM or a stepwise continuation. This debug-
ging cycle is repeated while the debugging session is
active.
Switching to a distributed application leads to a
more complicated data retrieval. The entry point into
a debugging session is still the batch mode, where first
objects from one or more JVMs are added into the ob-
ject diagram. The first difference at this point is the
behaviour after adding an instance. All existing mir-
rored instances of this object in all JVMs should be
MODELSWARD2015-3rdInternationalConferenceonModel-DrivenEngineeringandSoftwareDevelopment
228
supervised and updated as if they would be in live
mode. To achieve this, all instances of this object
must be found in other JVMs on the first hand. Here
we differ between two scenarios:
A JVM is started from within the Eclipse IDE.
Each of those JVMs can be supervised right from
their launch. Therefore, another subtype of EventRe-
quest is used, the ClassPrepareRequest. When this
request is registered events are fired as soon as a class
is loaded in the JVM. This class can be analysed for an
identifier property and if one is found changes to this
property can be tracked. As those identifier proper-
ties usually only change once for each instance (when
they are initialized) the overhead is reasonable. Each
class that does not own a valid identifier property will
not be supervised as they are not shared across JVMs.
A JVM is started from another IDE or on an-
other node and a remote debugging session is started.
This JVM is probably running for a long time and
all relevant classes for a debugging session are al-
ready loaded. Nevertheless, the process described
above is still initiated to keep track of newly loaded
classes. If an instance of a class is searched that was
already loaded before the remote debugging session
was started, it must be searched explicitly. Depending
on the amount of instances of a class this search can
be expensive. Therefore, this analysis is done asyn-
chronously.
Each object with an initialized identifier will be
stored internally and mapped with all its instances on
the other JVMs. This enables the Visual Debugger
to access these shared objects much faster during the
ongoing debugging session.
A special treatment is necessary when an object
from one JVM is added while not all other JVMs hav-
ing this class already loaded. In this scenario the class
is explicitly loaded (if available in this VM) and the
already explained supervising process is triggered.
8 THE DISTRIBUTED MODE
With the example project from chapter 4, the usage
of the Visual Debugger in different scenarios will be
shown. The following sections explain the two differ-
ent available view modes.
Detail Mode. The detail view mode is similar to the
behaviour of the Visual Debugger in a non distributed
application. Each instance in each JVM is displayed
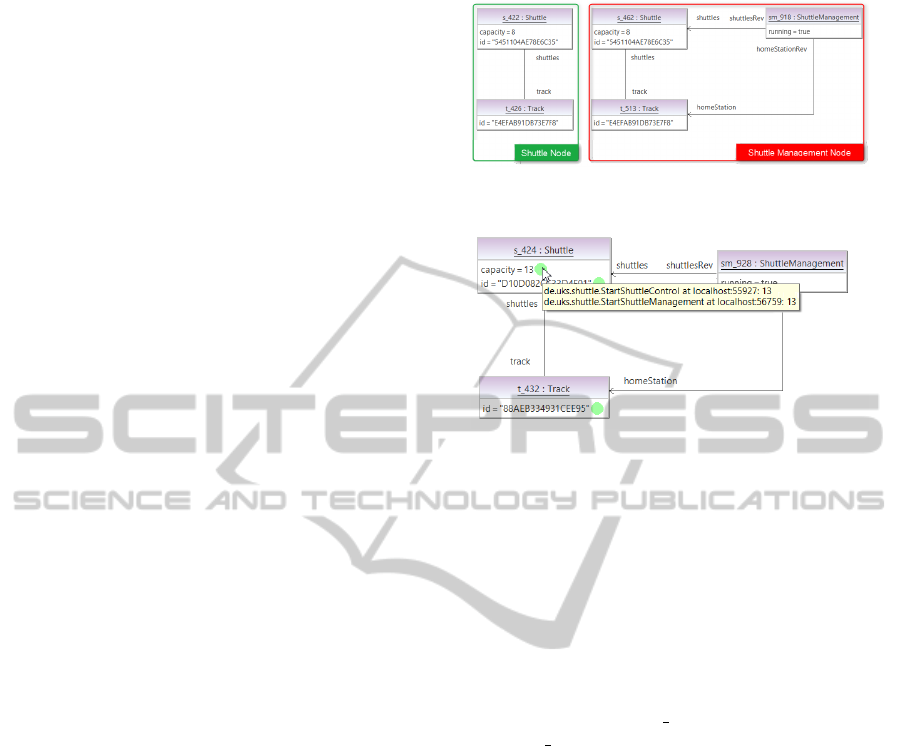
as an own object in the object diagram. In figure 3
a debug scenario with the shuttle simulation project
is shown. There are in total five objects, two from a
Shuttle Node running in one JVM (on the left) and
three from the Shuttle Management Node running in
Figure 3: Object diagram showing several objects from dif-
ferent JVMs with the detail mode activated.
Figure 4: Object diagram showing several objects from dif-
ferent JVMs with the combined mode activated.
another JVM (on the right). The highlights are added
after the screenshot was made to improve the visibil-
ity. Comparing the id properties of the objects reveals,
that the two Shuttle instances and the two Track in-
stances are the same objects on different JVMs. Due
to the naming conventions in the Visual Debugger, the
same objects have different names on different JVMs.
Each name usually includes the internal id of an in-
stance in the JVM. Regarding the Shuttle instances the
ids are 422 for the left (s 422) and 462 for the right
instance (s 462). This convention helps identifying
instances in other debugging tools, like the variables
view, faster.
This mode is especially useful, if it is important
to supervise the changes of one or more objects on
specific JVMs.
Combined Mode. When the combined mode is ac-
tivated all instances of the same object in different
JVMs are combined into one single object in the di-
agram. In figure 4 a similar scenario as in figure 3
is shown. Compared to the detail mode, the object
diagram is reduced from five to three objects.
To still get the information which value each prop-
erty and link has on the different JVMs an overlay is
added to each of these artefacts. In figure 4 the over-
lay for attribute assignments is active. Next to each
attribute assignment a small circle is drawn to give an
indicator of its stability. A green circle means that the
value is the same on each JVM. A red circle means,
that the value at least on two JVMs differs. This can,
but must not be problematic. If specific attribute val-
ues are not synchronized between (all) JVMs, an inte-
GraphicalDebuggingofDistributedApplications-UsingUMLObjectDiagramstoVisualizetheStateofDistributed
ApplicationsatRuntime
229

ger could probably stay at zero or a string value may
stay null. At this point it is up to the developer to
decide whether this is an unwanted and problematic
behaviour of the application or not. Additionally, a
tooltip is available if the attribute value of the instance
on each JVM is interesting for the user. In figure 4
the tooltip indicates, that the capacity property has in
both instances, in the Shuttle Node and the Shuttle
Management Node, the value 13.
9 CONCLUSIONS
In this paper the Visual Debugger and its usage with
distributed applications is presented. The main pur-
pose of the tool is to give a view on the current state of
an application by showing all relevant objects during
a debugging session. This is achieved with an UML2
object diagram visualizing objects on the Java heap.
Although the Visual Debugger has been proven to
be useful in a successful recent research project, there
are still open areas. During a debugging session a
regularly observed problem is that several changes in
the object diagram happen too fast to follow them.
Therefore an additional replay mode would be help-
ful where all changes in the object diagram during the
last debugging session can be repeated forwards and
backwards. If a debugging session must be repeated
several times to find the source of an unwanted be-
haviour, each restart forces the user to fill the object
diagram again with objects. An automatic restoration
of diagrams when the same debugging scenario is re-
peated would be helpful.
Nevertheless, the Visual Debugger should be seen
as addition to existing debugging tools and not as a
replacement. Thus, a tight integration into the Eclipse
IDE was an important design goal. During debug-
ging sessions which focus on supervising the state of
a specific, but known part of the application the Visual
Debugger delivers the most value.
One important lesson we learned so far is, that the
Visual Debugger has a steep learning curve; indepen-
dent from the experience of the software developer.
Students as well as professional developers (work-
ing in the industry for years) shared similar problems
when they are confronted with an unknown kind of
tool like the Visual Debugger. We currently develop a
tutorial addressing this problem.
REFERENCES
da Silva, G. J., Schnorr, L. M., and de Oliveira Stein, B.
(2003). Jrastro: A trace agent for debugging mul-
tithreaded and distributed java programs. In SBAC-
PAD, pages 46–54. IEEE Computer Society.
Geiger, L. and Z
¨
undorf, A. (2002). Graph Based Debugging
with Fujaba. Barcelona, Spain.
Geiger, L. and Z
¨
undorf, A. (2006). edobs - graphical de-
bugging for eclipse. ECEASST, 1.
Gestwicki, P. and Jayaraman, B. (2005). Methodology and
architecture of jive. In SoftVis ’05: Proceedings of
the 2005 ACM symposium on Software visualization,
pages 95–104, New York, NY, USA. ACM.
Layman, L., Diep, M., Nagappan, M., Singer, J., DeLine,
R., and Venolia, G. (2013). Debugging revisited: To-
ward understanding the debugging needs of contem-
porary software developers. In ESEM, pages 383–392.
IEEE.
Leroux, H., Rquil-Romanczuk, A., and Mingins, C. (2003).
Jacot: a tool to dynamically visualise the execution of
concurrent java programs. In Power, J. F. and Wal-
dron, J., editors, PPPJ, volume 42 of ACM Interna-
tional Conference Proceeding Series, pages 201–206.
ACM.
L
¨
ohr, K.-P. and Vratislavsky, A. (2003). Jan -java anima-
tion for program understanding. In HCC, pages 67–
75. IEEE Computer Society.
L
¨
onnberg, J., Ben-Ari, M., and Malmi, L. (2011). Java re-
play for dependence-based debugging. In Loureno, J.
and Farchi, E., editors, PADTAD, pages 15–25. ACM.
Mehner, K. (2001). Javis: A uml-based visualization and
debugging environment for concurrent java programs.
In Diehl, S., editor, Software Visualization, volume
2269 of Lecture Notes in Computer Science, pages
163–175. Springer.
Oechsle, R. and Schmitt, T. (2001). Javavis: Automatic pro-
gram visualization with object and sequence diagrams
using the java debug interface (jdi). In Diehl, S., ed-
itor, Software Visualization, volume 2269 of Lecture
Notes in Computer Science, pages 176–190. Springer.
MODELSWARD2015-3rdInternationalConferenceonModel-DrivenEngineeringandSoftwareDevelopment
230
