
PARSim, a Simulation Model of the Royal Canadian Air Force
(RCAF) Pilot Occupation
An Assessment of the Pilot Occupation Sustainability under High Student
Production and Reduced Flying Rates
René Séguin
Defense Research Development Canada Centre for Operational Research and Analysis,
101 Colonel By Drive, Ottawa, ON, Canada
Keywords: Simulation, System Dynamics, Pilot Production, Pilot Absorption, Military Occupation, Personnel
Management, Force Generation, Powersim.
Abstract: Training personnel to operate extremely complex and expensive equipment requires a large monetary
investment and takes lengthy periods of time. It goes without saying that careful planning is of the outmost
importance. Such is the case for military pilots. The Pilot Production, Absorption, Retention Simulation
(PARSim) model that was developed by the Centre for Operational Research and Analysis (CORA)
simulates the flow of pilots from recruitment, through training, onto the operational training units and into
the various operational fleets, accounting for attrition, instructor pilots and staff requirements. A key feature
of the model is that it simulates the acquisition of experience, dynamically adjusting the experience
acquisition rate in response to the existing experience level on the squadrons and the availability of
resources. The model is a tool that can be used to perform what-if analysis quickly and easily. This paper
describes the simulation model and reports on a study where the impact of high production combined with
reduced budgets is analysed.
1 INTRODUCTION
Training pilots in the Royal Canadian Air Force
(RCAF) as in many other air forces in the world
requires a large investment in time and resources. As
such the number of each type of pilots trained needs
to be carefully planned and managed. Pilots in the
RCAF go through several phases of training to
acquire their wings. They are then assigned to an
operational training unit (OTU) to learn to fly a
specific type of military aircraft and then to an
operational (ops) squadron to acquire superior skills.
This is accomplished by flying with or under the
supervision of an experienced pilot or mentor. Once
the required skills are obtained the need for
supervision is lifted, the pilot upgrades to a superior
level and can start mentoring new recruits himself.
The mentoring period for each pilot usually lasts
several months and for some aircraft types it may
take up to two years. The rate at which pilots
upgrade depends on the number of mentors and the
amount of flying hours available. The process of
training and mentoring pilots is part of what is
commonly known in military jargon as Force
Generation (FG) whereas the term Force
Employment (FE) is used for all operations,
missions and tasks that military personnel
accomplish.
The process of mentoring is often referred to as
the absorption of new recruits. The various schools
are responsible for the production of new pilots and
squadrons are responsible for their absorption for
final training. As squadrons have fixed size (known
as Preferred Manning Level (PML)), usually
established by the RCAF and government policies,
each new recruit posted to a squadron pushes
another pilot out of the squadron; usually an
experienced pilot which will be moving to another
posting requiring experience (instructor or staff).
The production and the absorption rates are
obviously closely linked but another crucial factor
also needs to be considered: the attrition of pilots.
Attrition mainly occurs for experienced pilots as
younger pilots are under contract and restricted from
being released. For steady state to be achieved,
Séguin, R.
PARSim, a Simulation Model of the Royal Canadian Air Force (RCAF) Pilot Occupation.
DOI: 10.5220/0005234700510062
In Proceedings of the International Conference on Operations Research and Enterprise Systems (ICORES 2015), pages 51-62
ISBN: 978-989-758-075-8; ISSN: 2184-4372
Copyright
c
2023 by His Majesty the King in Right of Canada as represented by the Minister of National Defence and SCITEPRESS – Science and Technology Publications, Lda. Under
CC license (CC BY-NC-ND 4.0)
51
production needs to match attrition and squadrons
need to be able to absorb all pilots produced;
otherwise, the pilot occupation becomes under or
over staffed. If production is not absorbed by
squadrons, pilot candidates accumulate in waiting
“queues” and gradually lose their skills. If
production is too high and pushed onto squadrons
anyway, the mentoring process is slowed down as
fewer and fewer mentors are available for a
constantly increasing number of mentees (as the size
of squadrons is fixed). Unless quickly corrected, this
process goes into an unstoppable downward spiral.
Similarly, but at a slower pace, if production is too
low to compensate for attrition, experienced pilots
are lost which slows down the mentoring process
and thus the rate at which younger pilots upgrade
and become mentors themselves. In summary, the
pilot occupation can be viewed as a system in a
delicate equilibrium and with a large inertia due to
the lengthy training and upgrade process.
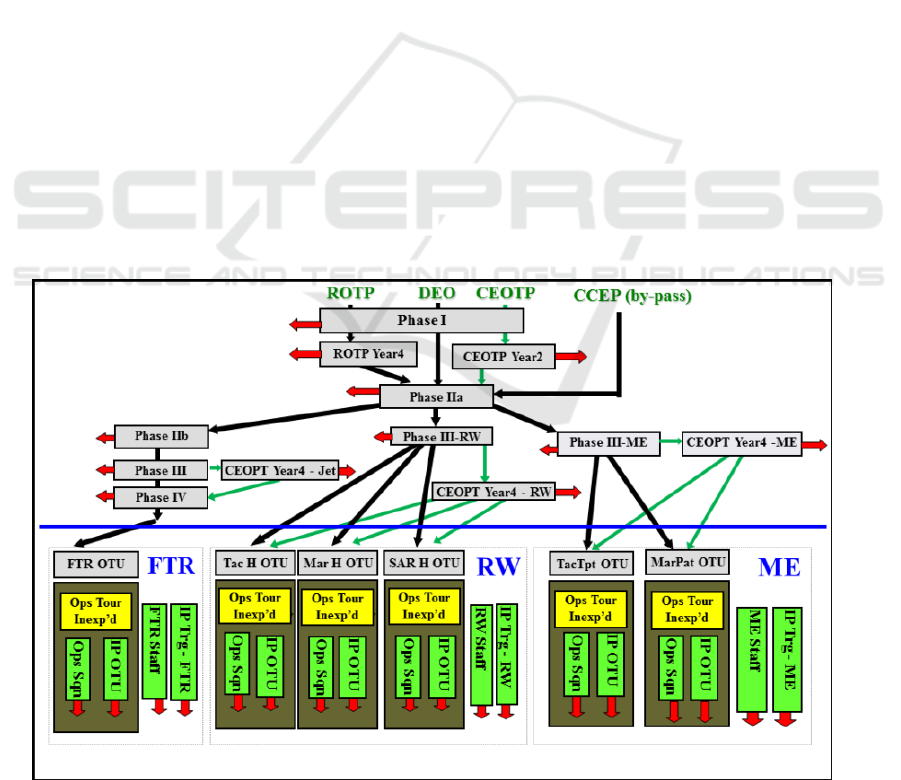
Figure 1 shows a high level diagram of the flow
of pilots through the system. The top half
corresponds to the undergraduate portion of pilot
training done at the various schools. The bottom half
represents all graduate pilots in all positions:
operational squadrons (Sqns), instructor pilots (IP) at
OTUs and in training (Trg) schools, and staff
positions. The diagram only shows a few of the
RCAF fleets: fighter (FTR), rotary-wing (RW)
tactical helo, maritime helo, search-and-rescue helo,
multi-engine (ME) tactical transport and maritime
patrol.
The terms in green at the top are the various
entry training programs (TPs) into the pilot streams:
Regular Officer TP (ROTP), Direct Entry Officer
(DEO) TP, Continuing Education Officer TP
(CEOTP), and Community College Entry Program
(CCEP). ROTP is the usual university education and
pilot training program; students usually attend
university for the first three years, then continue to
Phase I followed by their last year of university
before continuing with pilot training. DEO is for
officers that change occupation and already have a
degree. CEOTP is similar to ROTP with the
exception that members obtain their degree from a
community college rather than from a Military
College; as for ROTP, candidates of CEOTP go to
college between Phase I and II but also after Phase
III. Finally, CCEP candidates, as DEO candidates,
have already completed a college degree but they
also already have a pilot license which allows them
to bypass Phase I.
The red arrows indicate where attrition from the
occupation is possible. The yellow boxes contain the
inexperienced pilots (mentees) that need mentoring.
The light green boxes contain experienced pilots and
the olive green boxes represent operational
squadrons. More details will be provided below
when the model is discussed.
Numerous “external” factors affect the system
Figure 1: High-level diagram of the pilot occupation.
ICORES 2015 - International Conference on Operations Research and Enterprise Systems
52

and can result in significant issues if not carefully
managed. For example, attrition may increase
significantly if a large group of pilots leave the Air
Force to join civilian airlines once their contract is
completed. A second example would be if budgets
are decreased and pilots see a reduction of their
yearly flying rate (YFR). Another example is when
the Air Force fleet is modified due to the
introduction of a new type of airplane or the
transition from a legacy platform to a newer aircraft.
All these issues push the system away from steady
state and carefully crafted plans with timely actions
need to be devised to avoid serious consequences.
Pilot production and absorption issues have been
studied for decades (Mooz, 1969) but it seems that
increased efforts have started in the early 80’s
(Moscrip, 1980) with lots of studies in the last 20
years (Taylor, 1992a, 1992b; Graff et al., 1994; Thie
et al., 1995). Simulation work on pilot training has
started in Canada with the work of Boulet (1993,
1994a, 1994b). Following work done under the
RAND Corporation’s Project Air Force (Taylor,
Moore and Roll, 2000), CORA developed a dynamic
simulation model of the mentoring process
(Latchman, Corbett and Hunter, 2001) followed by a
more complete model of the pilot occupation
(Latchman and Hunter, 2002). The RAND
Corporation has continued to study pilot absorption
issues concentrating on the fighter community
(Taylor at el., 2002; Bigelow et al., 2003a; Bigelow
et al., 2003b; Marken et al., 2007; Taylor, Bigelow
and Ausink, 2009). At the same time, CORA
continued to evolve its model to simulate the whole
RCAF pilot occupation from recruitment to
retirement and to include all fleets employed. A
study on the effects of increasing UAV pilot
requirements on the fighter community can be found
in Garner and Villem (2005).
For several years the RCAF has experienced a
period of shortage of seasoned pilots for several staff
positions. In the last few years the RCAF has strived
to achieve a higher production of pilots at the
training schools to bring up the staffing level closer
to what it should be. Due to the inertia of the system
this is a lengthy process. Unfortunately, this year the
RCAF budget has been reduced which may impact
the amount of flying hours each fleet will be
allocated. Absorbing higher levels of newly winged
graduates is already difficult for squadrons, but
combined with reduced resources it is a very
difficult challenge. After describing the simulation
model, this paper reports on a study where the
impact of high production combined with reduced
budgets is analysed.
2 METHODOLOGY AND MODEL
Even though small individual pieces of the pilot
production and absorption system could potentially
be analysed analytically, the sheer complexity of the
problem with its feedback loops, conflicting
objectives, dynamic and stochastic nature, and
numerous concurrent events makes simulation the
only viable option to study the RCAF pilot
occupation in its entirety. At CORA, a System
Dynamics (Sternman, 2001) approach has been used
since the early stages of development of the pilot
system model. Initially, only the undergraduate
portion of pilot training was modelled, then a
separate OTU model was designed, followed by a
fully connected model of the training system and the
main fleets of the RCAF (Latchman and Hunter,
2002). Since then, the model has been known as the
Pilot Production, Attrition, Retention Simulation
(PARSim). Corbett (2013) documented the
mathematical foundations of the initial model. In
2006, with the imminent introduction of the new
strategic airlift fleet and the transition from the old
fleet of tactical airlift aircraft to a new platform, the
model was expanded to be able to study
modifications to the RCAF fleet. Further
refinements were implemented over the following
years, the latest being the capability to take into
account YFR constraints. Since its inception, 12
years ago, the model has been used numerous times
to study various issues such as how to overcome
high attrition (Latchman and Hunter, 2002), how to
get rid of large queues for courses, what are the
optimal fleet intake/absorption levels, how to
optimally plan the transition of platforms or the
introduction of a new capability.
The model has been implemented using the
Powersim Software simulation environment
(Powersim, 2014). It is comprised of four major
types of modules: 1) training phases modules where
pilots gradually learn to fly more complex missions
and more specific aircraft, 2) operational fleets
modules where pilots acquire experience through the
dynamic mentoring process, 3) cross-flow (CF)
modules to manage the transfer of experienced pilots
from one type of aircraft to another, and 4)
intermediary modules to calculate various quantities
used to obtain the correct behaviour from the other
modules.
The model is complex as it simulates the whole
pilot occupation from recruitment to retirement. It is
a high-level integrated model that does not track
individual pilots but rather groups of similar pilots
(for example, ME tactical transport pilots, fighter
PARSim, a Simulation Model of the Royal Canadian Air Force (RCAF) Pilot Occupation
53
demonstration team pilots, etc.). Therefore, it does
not track data such as years of service and time in
rank. It is designed to assess the health of the
occupation as a whole and ensure that every fleet is
staffed properly and at the right level of experience.
The model is used as an options test bed to perform
what-if analyses. Depending on the type of analysis
required the amount of input required can be
substantial. For long-term high-level issues,
approximate starting values can be used but for very
precise and shorter horizon studies, great care must
be taken to seed the model correctly. Since the
model is never used from scratch, it has to be seeded
with current values. For example, the number of
pilots of each type, the number of students in each
course, the number of people waiting in queues, etc.
In several studies, transitioning issues had to be
analysed. For this, the ability to vary the values of
“elements” over time is essential. In Powersim, this
is done by cloning constants at the appropriate time.
For example, when standing up a new fleet, the
number of pilots and thus the number of students
required for the OTU will be slowly increased from
year to year and the model will slowly start sending
newly winged graduates (NWGs) to the new fleet.
Obviously, a few more elements need to be cloned
to complete the task of standing up a new fleet and
they need to be carefully timed but the principle is
the same.
2.1 Operational Fleet and Cross-Flow
Modules
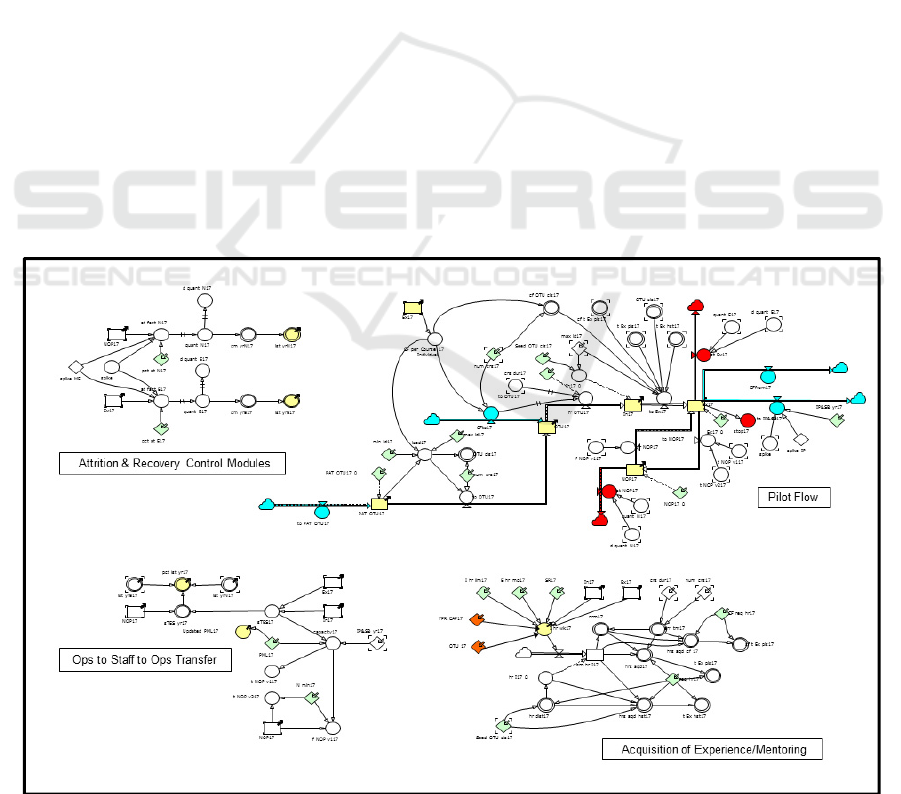
As an illustration, Figure 2 shows a module for one
of the operational fleets; the whole model consists of
33 such modules. Specific details of the figure are
not important here, the goal is to provide an
appreciation for the model. In this particular module,
the main portion is at the top right and flows of
pilots come in from and go out to other modules of
the model through the cyan coloured flows. The
main entry is through the leftmost cyan “cloud”
flow, where pilots arrive from the school and are put
in a queue (first yellow block) for the next OTU
course (second yellow block). Once this course is
completed, pilots are qualified on a specific aircraft
but need to acquire experience through the
mentoring process. While acquiring this experience
they are dubbed inexperienced and “stored” in the
third yellow box. After upgrading to the experienced
status, they move to the fourth yellow box. The flow
of pilots between these two stages is a crucial piece
of the model and is controlled via the mentoring sub-
model at the bottom right where every week the
resources (level of YFR and number of mentors
(experienced operational pilots)) are assessed to find
out how much flying hours can be allocated to each
mentee for the upgrade process.
Figure 2: A fleet sub-model.
ICORES 2015 - International Conference on Operations Research and Enterprise Systems
54

There is a second cyan inflow of pilots in the
diagram which is connected directly to the OTU
box; this second flow corresponds to experienced CF
pilots arriving from another fleet (transfers). This is
a minor input channel for the large majority of fleets
but can be used extensively if a fleet has a need for
very experienced pilots. This flow is connected
directly to the OTU as it is not modelled as a push
from the school but rather as a pull from the fleet
and as such these pilots have priority over NWGs.
The model always verifies the health of the provider
fleets before allowing the transfers out to ensure that
no fleet is disadvantaged in the process. The health
is assessed using the ratio of mentors to mentees (or
experience ratio) and the manning ratio of the
trained effective strength (TES) (number of ops
pilots (mentors plus mentees)) to the PML of the
fleet. The experience ratio should always be above
50% and the manning ratio should be close to 100%.
There are two cyan flows out of the Experienced
block: one that sends pilots out to the various
schools to become IPs to compensate for IP attrition
and one for CFs out to satisfy the pull for CFs from
other fleets. Note that since CFs are defined as
pulled quantities and the health of the various fleets
may not allow for all requests to be satisfied, the
model has to decide how many and which requests
can be satisfied, and from which fleets.
Every time there are requests for CFs from
OTUs, the model first evaluates how many pilots
can be provided for CF purpose. This is based on a
proportion of the number of experienced ops pilots
that each healthy fleet can provide. This establishes
the proportion of the total CF requests that can be
satisfied by these fleets. In a second step the model
calculates what proportion of these achievable
requests can be filled by each healthy fleet. Then a
random process based on these proportions is used
to determine which fleet will actually be providing
the CFs. In a very healthy situation, the probability
of a large fleet to be a provider is greater than that of
a small fleets and the use of randomness ensures that
small fleets provide some CFs some of the time.
It is worth noting that the model also deals with
the following two elements of the CF process: 1) a
fleet may simultaneously be a provider of CFs as
well as a receiver and, 2) CF requests for fleets are
defined annually but the pilots pulled in as CFs must
be spread over OTU courses offered throughout the
year. Finally, a constraint (that is rarely restrictive)
has been used to simplify implementation of the CF
process: a provider fleet is allowed to give a
maximum of one pilot per course per requesting
fleet.
Red flows are for attrition; they are controlled by
the top left sub-model and can happen any time over
the year. In the main flow there is a loop for
experienced pilots to move between the sets of
operational and staff positions. Movement of pilots
between these two groups is managed with the sub-
model on the bottom left. It ensures first that a
mandated minimum number of staff positions are
always filled. Then, it verifies if there are enough
pilots in the ops squadron or too many. If any of the
manning levels are incorrect, the model transfers
pilots from one group to the other. This adjustment
is done once a year to mimic the re-assignment
posting cycle of the RCAF.
In the key mentoring sub-model at the bottom
right, resources are evaluated each week to find out
how many flying hours can be allocated to each
individual pilot for the upgrade process. It is also in
this sub-model that the verification of the hours
acquired is done to grant upgrade to mentees. Even
though in practice mentees may upgrade with
varying levels of flying hours due to their individual
skills, an average value is used in the simulation for
all mentees. Note that only flying hours are
considered in the model to grant the upgrade. In
practice, simulation hours may also be used and
required. As flying hours is a much scarcer resource,
it is assumed that the simulation hours required can
be acquired during the several months it takes to
acquire the flying hours.
The number of weekly hours available for the
upgrade process depends on the number of
experienced pilots (mentors) e available (which
varies due to attrition, posting and upgrade of
pilots), on the number of inexperienced pilots i to
upgrade, on the annual flying budget allocated to the
specific fleet y and on flying limits ̅ and ̅ imposed
on pilots (both mentors and mentees). For the budget
component, only hours that can be used for FG are
included which means that pure FE hours (pure FE
is taken to mean here that none of these FE hours
can be used for training purposes (for example,
expeditionary operations)), OTU hours and any
other reserved hours (for example, Standardization
and Evaluation Team) have to be removed. Some
fleets may also allow a mentor to train two mentees
at a time on some flights; p is the percentage of
flights where this is allowed. Even though pilots
may fly at different rates in practice, it is assumed
that all mentors fly at the same rate as well as all
mentees (however, mentors and mentees may fly at a
different rate). The equation for the weekly number
of hours for each mentee is:
PARSim, a Simulation Model of the Royal Canadian Air Force (RCAF) Pilot Occupation
55
min
̅
,
1
∗
̅
∗
,
1
∗
52
(1)
Some fleets also have augmentees which are
experienced pilots that can help in the upgrade
process but at a reduced flying rate compared to
normal mentors. For those fleets, equation (1) would
be slightly modified. Furthermore, experienced
pilots that come in from other fleets also need to
upgrade on the new aircraft type but they require
less time than NWGs and thus have to be tracked
separately. This means a portion of the mentoring
sub-model is repeated. Finally, as the model is
seeded with the current number of pilots, some of
them will be at various stages of the upgrade
process. The bottom section of the mentoring sub-
model tracks those groups of pilots that have been
seeded with a varying number of flying hours
already acquired at the start of the simulation.
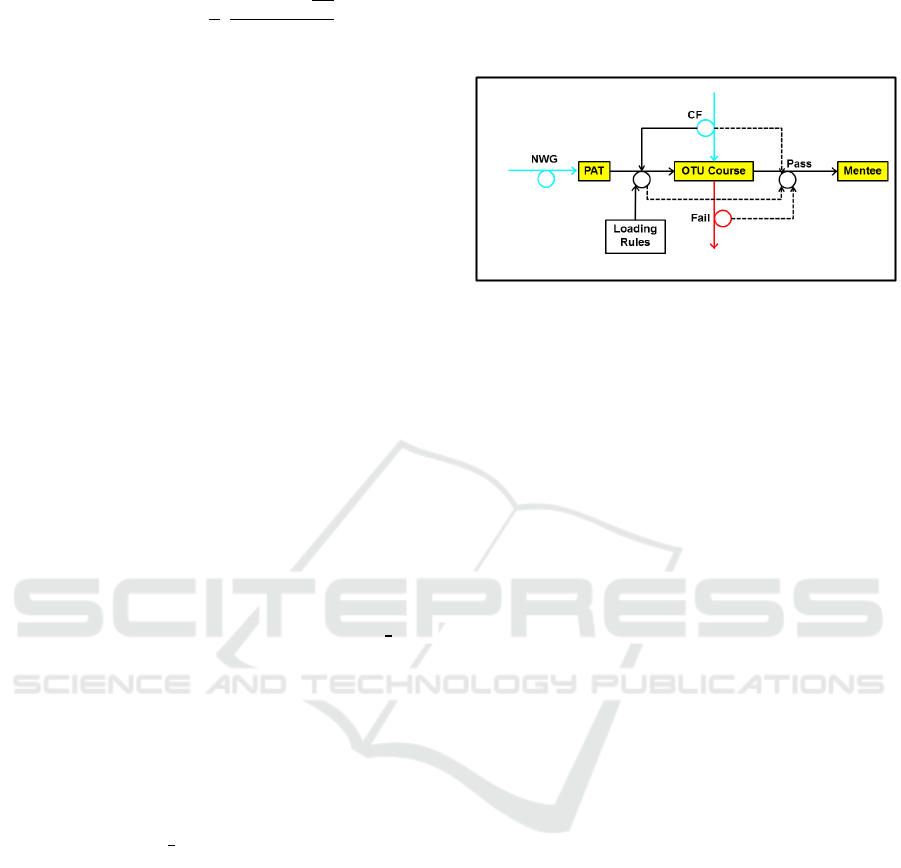
We will now discuss the section of the main flow
where NWGs are moving from the queue (the term
PAT, for Personnel Awaiting Training, is commonly
used in military settings) to the OTU course. This
section is structurally the same for all courses in all
phases of training and is illustrated in Figure 3.
As can be seen in the figure, rules are used to
govern the flow between the queue and the course.
These include such elements as the minimum
and
the maximum
̅
number of students on each course,
the frequency of the course and the number of CFs c
the OTU was actually successful in obtaining from
other fleets for this specific offering of the course. If
q is the number of students in the queue, the
dynamic equation used for calculating the student
loading is the following:
0
min,
̅
(2)
Student course failures need to be implemented
carefully as the majority of the classes are small and
using simply a proportion of students would be
inaccurate. A binomial distribution has been
implemented using a vector of Bernoulli random
variables (Corbett, 2013; Law and Kelton, 2000). It
is also worth mentioning that failures at more
advanced stages of jet training result in students
being moved to another stream rather than being
removed from the pilot occupation.
Finally, it is important to mention that in
thistraining section (as in numerous other training
sections of the model) the flow of students that
successfully complete the course and move on to the
next block is linked to the load into the course and
“controlled” by a delay defined by the length of the
course duration. This delayed link (illustrated by the
dash lines in Figure 3) plays a similar role as
delayed signals in discrete event simulations.
Figure 3: OTU portion of a fleet sub-model.
2.2 Operational Fleet – Special Case
Modules
Some fleets have extra elements in their module. For
example, the current ME tactical airlift fleet is
connected directly to the new tactical airlift fleet to
be able to directly and gradually transfer pilots.
Usually an initial cadre of experienced pilots and
some staff positions are first transferred to establish
the new training capability (Standardization and
Evaluation Team and IPs) for the fleet. Then, more
experienced pilots are transferred to be trained and
establish an operational squadron. The initial
training for the new aircraft may be accomplished
through a shorter conversion course if the new
aircraft is not too drastically different. Some NWGs
are slowly being sent to the new OTU. Gradually all
remaining experienced pilots (ops and staff) are
moved to the new fleet. The legacy OTU is closed at
some stage and NWGs are then only sent to the new
fleet. When the legacy fleet is completely retired,
some mentees may not have completed their upgrade
process. Unless they are very close to completion,
they may have to start over on the new aircraft. This
is a waste of time and resource and shows how
important it is to precisely plan the transition from
the legacy fleet to the new one.
Another important special case is the feeder
fleet. Two different variations are possible: pilots are
either fed just after the OTU or only after they have
acquire experience. The first case is for fleets that
use the same aircraft but in different roles. In this
situation, once basic training at the OTU is
completed, pilots are streamed to squadrons for the
upgrade process. In the model, this is reflected by
having one fleet with an OTU that feeds other fleets
directly at the mentee stage; the modules of these
receiving fleets do not have an OTU portion. The
ICORES 2015 - International Conference on Operations Research and Enterprise Systems
56

second case is for a fleet sending experienced pilots
to another fleet in a very similar fashion as was done
in the case of the transition from a legacy aircraft to
a new model. However, in this case, the feeder fleet
is not retired and continues operation. This model
can be used to start a new capability that is similar to
an existing one or for a specialized capability that
requires previous experience in another capability.
In the first case, the link between the feeder fleet and
the receiving fleet may be severed after some time.
In all cases, the receiving fleet has an OTU as it uses
a different aircraft. Depending on the situation, the
OTU may or may not receive NWGs, but
experienced pilots fed in usually have to go through
a full OTU course.
2.3 Training and Intermediary
Modules
The top portion of Figure 1 provides a high-level
view of the training system which will now be
discussed in more details. As already mentioned, all
courses are modelled on the pattern shown in
Figure 3. The various courses are successively
linked as presented in Figure 1. There is a split after
Phase IIa where students are assigned to one of the
three generic types of aircraft: RW, ME or FTR. The
proportion sent to each type is based on the relative
size of each community and is usually entered as a
constant, but can be changed over time in the rare
cases where the proportion is expected to change
due to a significant modification of the RCAF fleet
composition.
There is another split at the junction of the
training and fleet sections. This is where pilots are
assigned to specific military aircraft types. For
example, in Figure 1, students who finish Phase III
RW are assigned to one of the three RW fleets.
These splits are calculated dynamically by the model
in intermediary modules and based on the size of the
fleets involved. The dynamic nature of these splits is
really useful for fleets transitioning from a legacy
aircraft to a new model as the flow going to the old
model is gradually stopped while the flow going to
the new model is increased (aircraft models are
usually retired in a tiered fashion). Various
constraints and rules may be added and used in these
dynamic calculations to prevent, for example, the
assignment of NWGs to fleets that only use
experienced pilots.
2.4 Running the Simulation
Inputs and outputs are accomplished through
Microsoft Excel workbooks, and Powersim interacts
directly with those. Usually around 20 workbooks
are used: one for each operational fleet, one for the
undergraduate portion of pilot training and a few for
specialized output analysis. Further input values are
defined as clones and several control variables are
defined directly in the model itself.
The simulation step is one week. The model is
run for 30 years to ensure that no unwanted
behaviour is slowly building. Each run takes only a
few seconds on a standard laptop computer. Usually,
about ten runs are done but as the pilot occupation is
a system in delicate equilibrium, the results of each
run are nearly identical: the system collapses, the
system is stable or a trend is observable. On rare
occasions, one of the runs may display a different
behaviour but it is rare and it is always a collapse
caused by extreme factors combining with an
already undesirable trend visible on all other runs.
Table 1 summarizes the input data required for
each fleet and training phase, as well as some
miscellaneous inputs.
Table 1: Input table.
FLEET DATA
Initial number of ops pilots
Initial number of staff positions filled
Minimum number of staff positions that have to be filled
Initial number of mentees
Initial size of the OTU PAT queue
Established number of ops positions
Attrition rate for experienced ops pilots
Attrition rate for staff
Maximum number of flying hours allowed for mentors
Maximum number of flying hours allowed for mentees
FG YFR for the fleet
Number of cross flow pilots requested per year
Number of hours required of a NWG to upgrade
Number of hours required of a CF pilot to upgrade
Percentage of times a mentor can train two mentees
OTU course duration
Number of courses per year
Maximum loading
Minimum loading
Minimum experience ratio to be consider healthy
TRAINING PHASE DATA
Course duration
Number of courses per year
Maximum loading
Minimum loading
Failure rate
EXTRA DATA
Yearly recruitment values for each entry program
IP requirement for each school
IP attrition rate
Source of IP as proportion
Breakout percentage after Phase IIa
A large amount of output is produced by the
model and several graphs spanning the 30 year
PARSim, a Simulation Model of the Royal Canadian Air Force (RCAF) Pilot Occupation
57
horizon are automatically produced by Excel based
on the data generated by the simulation. A series of
graphs is produced for each fleet and each training
phase. The majority of these charts are also provided
in an aggregated form on a single graph to help an
experienced analyst quickly assess the health of the
occupation for the issue under study. Another series
of graphs show results where values have been
summed for all fleets. Finally, one graph showing
the staffing transition can be produced for fleets
being converted from a legacy model to a new
model of aircraft.
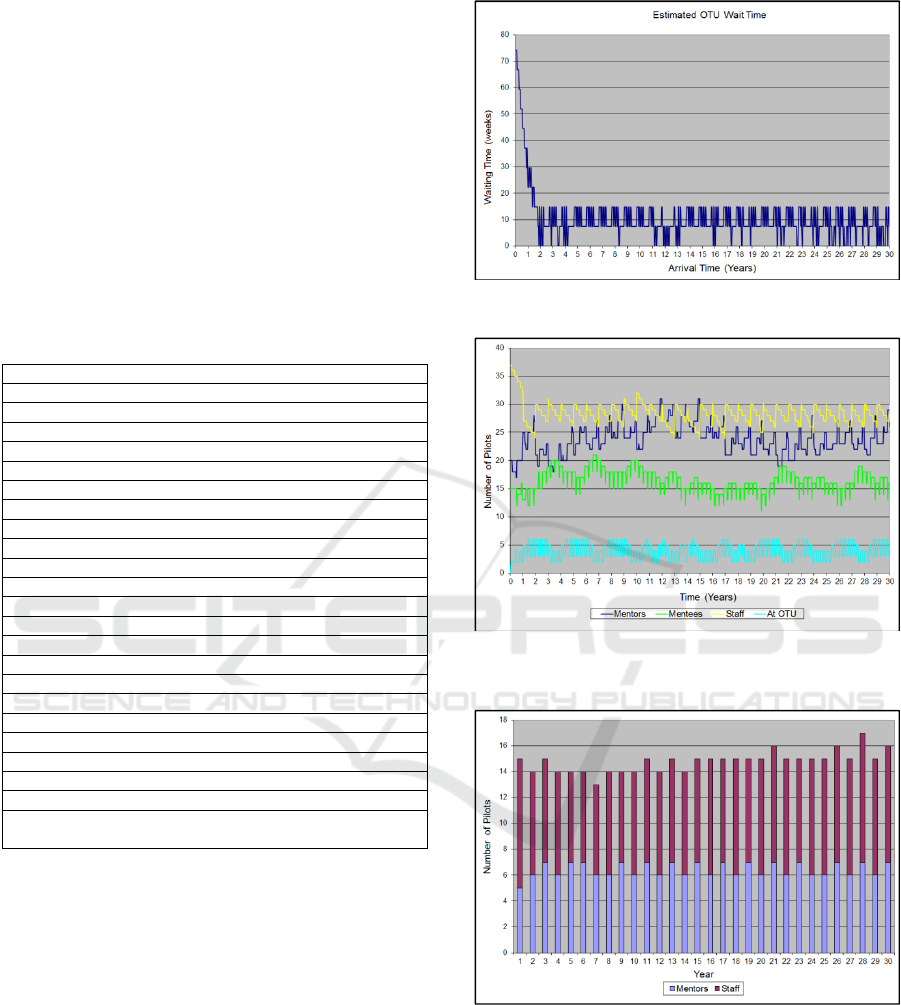
Table 2 summarizes the various graphs available
and Figures 4 to 7 illustrate a few of these graphs.
Table 2: Output graphs.
TRAINING GRAPHS
Throughput
PAT pool size
PAT pool size for all training phases on a single graph
Average wait
FLEET GRAPHS
OTU intake
PML vs. TES (PML tracking)
Experience ratio
Number of staff position filled
Flying hours used and remaining
Upgrade time
Attrition
CF provided and received
PAT pool size
Waiting time
AGGREGATED GRAPHS
Number of NWGs
PML vs. TES
Number of staff position filled
Attrition
OTU PAT pool size
TRANSITION FLEETS (sum of the two fleets)
Mentors, Mentees, Staff positon filled, PML vs. TES, OTU
throughput
In Figure 4, student wait time to get onto an
OTU is shown. The curve illustrates the case where
a large pool of students initially had to wait for more
than a year. Once an issue was corrected, the
situation vastly improved over the next two years.
In Figure 5, the level of staffing for a single fleet
is shown for the four categories of pilots tracked by
the model. The case illustrated here is for a scenario
that is relatively stable. The constant variations
noted on every curve are mainly due to pilots
moving from one category to another but also due to
attrition.
In Figure 6, the attrition for experienced staff
and ops pilots is displayed. This scenario is for a
case where attrition is constant and where attrition of
staff officers is slightly higher than for ops pilots.
Figure 4: Wait time at a fleet OTU.
Figure 5: Number of pilots in each type of position for a
single fleet.
Figure 6: Attrition for experienced pilots of a single fleet.
In Figure 7, flying hours usage is displayed.
Hours used at the OTU as well as on squadron for
the mentoring process are shown. Using the fleet’s
YFR allocation, the remaining hours that can be
used for pure FE are also displayed. This graph
illustrates a situation where around 75% of the YFR
allocation is required for FG.
ICORES 2015 - International Conference on Operations Research and Enterprise Systems
58
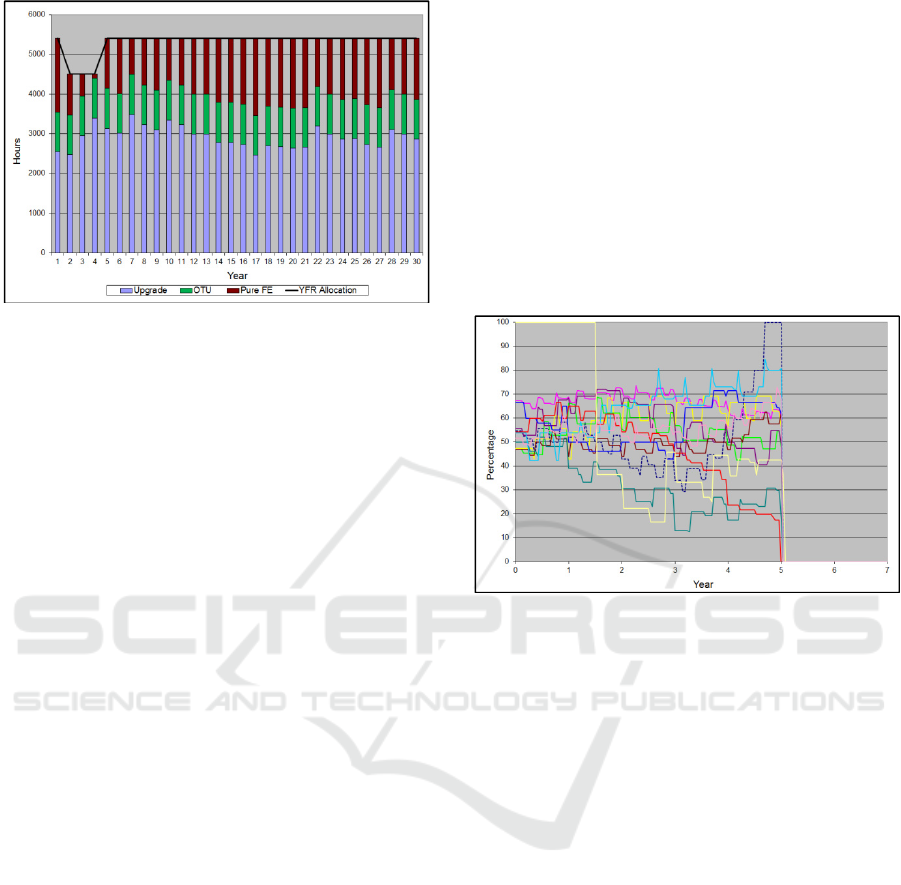
Figure 7: Flying hours usage for various tasks.
3 RESULTS
As stated earlier, the aim of the study was to assess
the impact of planned YFR reductions while the
RCAF had started the process of increasing the size
of the occupation by producing more NWGs at the
training schools. The targeted increase in NWG
production was planned to gradually reach around
35% in the next five years and the imminent planned
reduction in YFR was on average 16% with some
fleets seeing as little as 5% reduction but others as
much as 39%. As it is anticipated that these two
factors would make it very difficult for squadrons to
absorb NWGs, the model was allowed to use all
YFR for FG and measure how much would be left, if
any, for pure FE.
In the first scenario, the production increase and
the YFR reductions were permanent. The simulation
stopped after five years (See Figure 8) due to the
complete collapse (experience ratio down to 0%) of
one of the fleets (red curve on the graph). As was
explained in the introduction, this is due to too many
NWGs being pushed into the squadron in turn
pushing too many mentors out and continuously
slowing down the upgrade process until there are no
mentors left. Two other fleets displayed extremely
low experience ratios for extended periods of time
which entails significant risks (pale yellow and teal
curves).
In view of these results, a second scenario was
assessed where the YFR reduction would be in
effect for only three years rather than permanently.
This easing was not sufficient to help the troubled
fleet recover. As the RCAF was already committed
to four years of higher production reaching an
increase of around 25% but future years were still
uncommitted, the next scenario was set with those
four years at the higher levels of production
followed by a return to a normal level for the rest of
the simulation. The YFR reduction was applied for
only three years as in Scenario 2 to assess first if this
relaxed YFR reduction scenario would be feasible. If
so, a permanent YFR reduction scenario could be
assessed. To prevent the rapid erosion of experience
observed in the previous scenarios for some fleets,
OTU intake was greatly reduced during the three
years of YFR reduction. For subsequent years,
intake of NWGs at the squadrons was set to allow
fleets to “survive” with absolute minimal
capabilities.
Figure 8: Experience ratios for Scenario 1.
Contrary to the first two scenarios, experience
levels were relatively satisfactory with only two
fleets experiencing levels below 50% for some
periods. However, as shown in Figure 9, two fleets
had difficulties maintaining sufficient staffing levels
(green and blue curves) and portrayed trends dipping
well below 10% under PML. The red curve is also
showing low levels in the first few years. This curve
is linked to a fleet that is being stood up and is
having difficulties meeting its scheduled growth
planned before YFR cuts were announced. These
difficulties are due to lower NWG intake required to
survive with a low YFR. However, the fleet
eventually meets its target PML after a few years.
Another issue, that is evident in Figure 10, is the
fact that four fleets need to use virtually all their
flying hours to be able to absorb NWGs. This is
shown by the blue and orange curves never straying
far from the 0% mark and the green and yellow
curves being generally above the -10% mark. It is
also clear that the three years of YFR reduction are
strongly affecting several fleets as all curves show
an upward trend in the first few years indicating that
all the fleets graphed needed virtually all of their
YFR allocation just for the upgrade process.
PARSim, a Simulation Model of the Royal Canadian Air Force (RCAF) Pilot Occupation
59
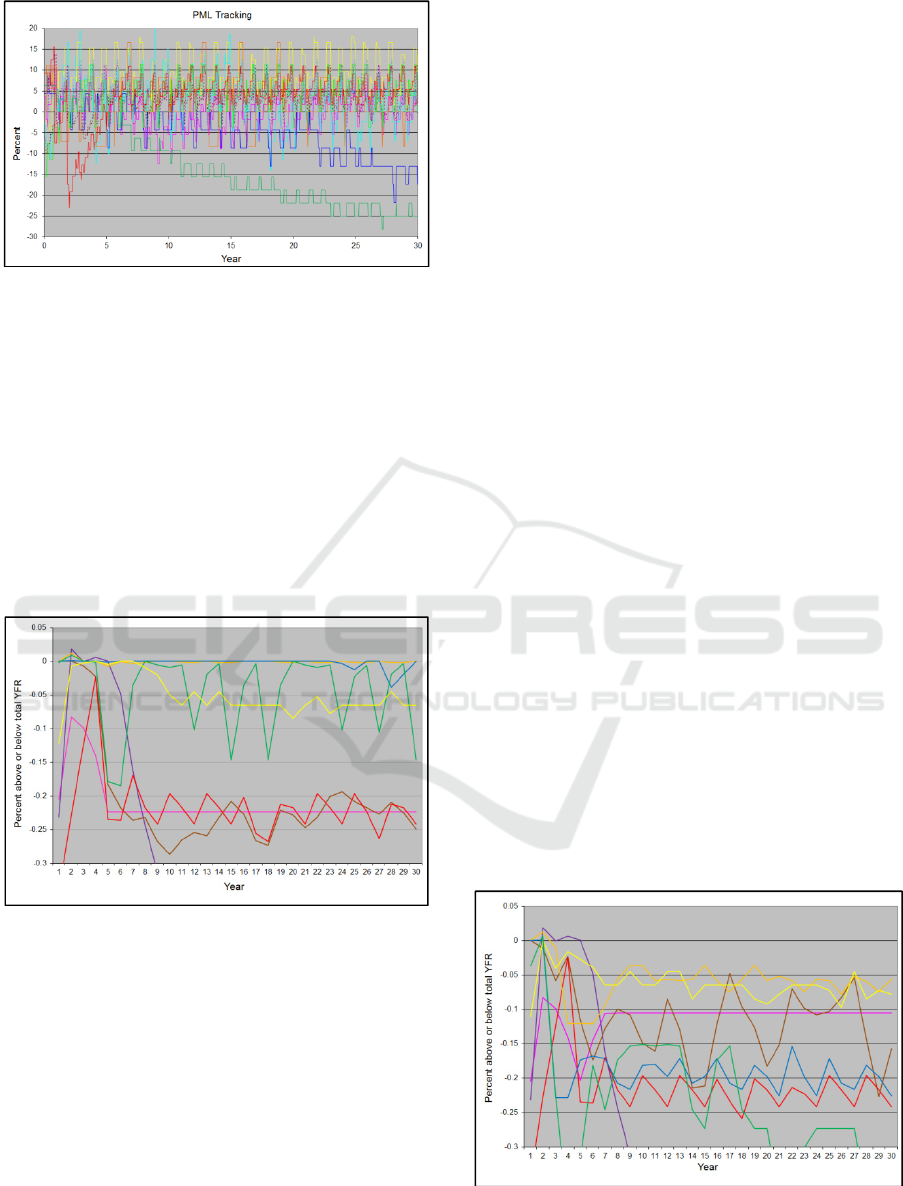
Figure 9: PML tracking for Scenario 3.
Finally, an important outcome of this scenario
which is resulting from the intake reduction strategy
is that the queues of pilots waiting to start their OTU
course are growing as intake is now insufficient to
absorb production. In this scenario, the total intake is
annually about 10% too low. This implies that
queues would quickly build up to levels that are
unacceptable as students would have to wait longer
and longer before starting they course. If the wait is
too long, pilots lose their skills and have to be at
least partially retrained at extra cost and further
burden to the training resources.
Figure 10: YFR usage in Scenario 3.
In view of the poor performance observed for
Scenario 3, a permanent YFR reduction was not
examined as alluded to in the description of that
scenario. Therefore, for the last scenario that was
run, the goal was to generate a plan where: 1) NWGs
would all be absorbed, 2) all fleets would have some
hours available for pure FE, 3) upgrade would be
completed in 30 months or less, 4) all fleets would
be staffed at 95% or more and, 5) experience ratios
would be at least 50%.
Production of NWGs was similar as in
Scenario 3: four years at a higher level and back to
normal levels after that. Intake of NWGs was
reduced for the three years of YFR reduction but
was subsequently increase to at least match
production to prevent the growth of large queues at
OTUs. However, to achieve the plan some extra
measures had to be adopted for certain fleets. The
growth of a fleet that was in the process of being
stood up was slowed down. For five of the fleets, the
YFR reduction had to be applied only for a single
year rather than three. Furthermore, for three of
these five fleets, the YFR had to be increased to
levels higher than before the reduction. Although the
percentage of increase was significant for these three
fleets with an average of 29%, the total number of
flying hours added was modest since these fleets are
not the most intense flyers.
On the positive side and despite the reduced
production (compared to what was planned), the
occupation was still able to grow by about 15% in
seven years. However, even though the scenario’s
objectives were met, the situation was not perfect.
As can be seen in Figure 11, some fleets still do not
have many hours available for pure FE and several
have virtually none during the first few years. As for
OTU queues, even though no build-up was observed
in the long run, the total number of pilots waiting did
increase during the first years due to the YFR
reduction and associated lowered OTU intake. The
increase was equivalent to about 70% of the total
annual intake and it took a very long time to clear
up. This implies that some pilots would experience
long wait times; a further indication that the scenario
is far from completely satisfactory.
All these results are signs that the original YFR
allocation was too low to allow the absorption of a
high pilot production by the schools and that actions
of a more strategic nature are necessary to obtain a
sustainable plan for the pilot occupation.
Figure 11: YFR usage in Scenario 4.
ICORES 2015 - International Conference on Operations Research and Enterprise Systems
60

4 CONCLUSIONS
Training air force pilots is costly and lengthy. The
relationships between school production, OTU
absorption, flying rates, experience levels, cross-
flows and attrition are complex and volatile. The
pilot occupation is a system in a delicate equilibrium
and with a large inertia. A single action or decision
may have drastic long-term effects. Complex,
concerted and multi-faceted efforts are often
required to solve problems encountered. In view of
all this, simulation is a necessity.
The PARSim simulation model has been
presented. It is a realistic high-level representation
of the pilot occupation. It is an efficient, powerful
and versatile what-if analysis tool. It can help assess
what combination of actions may provide the
maximum benefit, how quickly can changes be
implemented and, what side-effects decisions taken
for a portion of the occupation may have on the rest
of the system.
The tool has been used for several projects over
the years and results were provided here on one of
the studies: assessment of the impact of reduced
budget and thus flying rates combined with the
simultaneous absorption of a high production of
students at the training school. A feasible but not
completely satisfactory plan was devised. It showed
that actions of a more strategic nature are necessary
to obtain a sustainable plan for the pilot occupation.
The tool will undoubtedly continue to be
improved. Currently the model does not directly take
into account hours acquired in simulators and it
could be beneficial to include this element in the
model to assess directly the impact of their use. It
could also be useful to implement the cross-flow
feature between the rotary wing fleets and
potentially between all fleets.
ACKNOWLEDGEMENTS
I would like to thank my colleagues Charles Hunter,
Sonia Latchman, Norman Corbett and Pieter De
Jong for their work and help on previous versions of
the tool. Acknowledgements are also due to the
numerous officers of the RCAF who have over the
years provided invaluable information to allow the
tool to be developed and improved.
REFERENCES
Bigelow, J. H., Taylor, W. W., Moore, S. C., Thomas, B.,
Models of Operational Training in Fighter Squadrons,
RAND Corporation, MR-1701-AF, 2003a.
Bigelow, J. H., Taylor, W. W., Moore, S. C., Thomas, B.,
Estimating the Operational Training Needs of Air
Force Fighter Squadrons, RAND Corporation, RB-
107-AF, 2003b.
Boulet, D., The Undergraduate Pilot Training Flow
Simulator and the PAT Problem, Air Command
Headquarters, Winnipeg MAN (CAN) Operational
Research Division, AIRCOM ORD SN 93/4,
September 1993.
Boulet, D., The UPT Flow Simulator and Proposed
Changes to the Undergraduate Pilot Training System,
Air Command Headquarters, Winnipeg MAN (CAN)
Operational Research Division, AIRCOM/ORD SN
94/3, September 1994a.
Boulet, D., The OTU Flow Simulator and Impacts from
the Undergraduate Pilot Training System, Air
Command Headquarters, Winnipeg MAN (CAN)
Operational Research Division, AIRCOM/ORD SN
94/4, September 1994b.
Corbett, N. C., Modelling the production and Absorption
of Pilots: The Development of the Production,
Absorption and Retention Simulation (PARSim),
DRDC CORA, TR 2013-023.
Garner, R. S., Villem, P. A., Fighter Pilot Inventory and
Requirements Model; A Ten Year Look with Impact
of UAV increase, Graduate School of Engineering and
Management, Air Force Institute of Technology, TR-
05-02, 2005.
Graf, C. M. II, Thie, H. J., Taylor, W. W., Levy, C. M.,
Nataraj Kirby, S., A Critical Assessment of Total
Force Pilot Requirements, Management, and Training,
RAND Corporation, DB-121-OSD, 1994.
Latchman, S., Corbett, N.C., Hunter, C., A Briefing on
Pilot Production / Absorption / Retention Simulation
(PARSim) Model Development, 1 Canadian Air
Division / Canadian NORAD Region Headquarters,
Winnipeg MB (CAN) Centre for Operational Research
and Analysis, 1CAD;CORA RN 0102, August 2001.
Latchman, S., Hunter, C., Preliminary Results from the
Pilot Production / Absorption / Retention Simulation
(PARSim) Model, 1 Canadian Air Division / Canadian
NORAD Region Headquarters, Winnipeg MB (CAN)
Centre for Operational Research and Analysis, 1CAD
RN 0202, March 2002.
Law, A. M., Kelton, W. D., Simulation Modeling and
Analysis 3
rd
edition, McGraw-Hill, Boston, 2000.
Marken, R. S., Taylor, W. W., Ausink, J. A., Hanser, L.
M., Anderegg, C. R., Wickman, L., Absorbing and
Developing Qualified Fighter Pilots: The Role of the
Advanced Simulator, RAND Corporation, MG-597-
AF, 2007.
Mooz, W. E., The Pilot Training Study: Personnel Flow
and the PILOT Model, RAND Corporation, RM-6080-
PR, 1969.
PARSim, a Simulation Model of the Royal Canadian Air Force (RCAF) Pilot Occupation
61

Moscrip, J., Simple Models for Training Systems (A
Pipeline Perspective of Pilot Production), Operational
Research and Analysis Establishment, Ottawa ONT
(CAN) Directorate of Air Operational Research,
DAOR SN 80/6, May 1980.
Powersim Software A S, www.powersim.com, accessed
11 September 2014.
Sternman, J., Business Dynamics: Systems Thinking and
Modeling for a Complex World, McGraw-Hill,
Boston, 2002.
Taylor, I., A Model of Pilot Training in ATG, Air
Transport Group Headquarters, Trenton ONT (CAN)
Operational Research Branch, ATGOR WP 1/92,
January 1992a.
Taylor, I., A Flow Model of the Pilot Career Path in Air
Transport Group, Air Transport Group Headquarters,
Trenton ONT (CAN) Operational Research Branch,
ATGOR WP 11/92, August 1992b.
Taylor, W. W., Bigelow, J. H., Ausink, J. A., Fighter
Drawdown Dynamics: Effects on Aircrew Inventories,
RAND Corporation, MG-855-AF, 2009.
Taylor, W. W., Bigelow, J. H., Moore, S. C., Wickman,
L., Thomas, B., Marken, R. S., Absorbing Air Force
Fighter Pilots: Parameters, Problems, and Policy
Options, RAND Corporation, MR-1550-AF, 2002.
Taylor, W. W., Moore, S. Craig, Roll, C. R. Jr., The Air
Force Pilot Shortage: A Crisis for Operational Units?,
RAND Corporation, MR-1204-AF, 2000.
Thie, H. J., Taylor, W. W., Levy, C. M., Nataraj Kirby, S.,
Graf, C. M. II, Total Force Pilot Requirements and
Management: An Executive Summary, RAND
Corporation, MR-646-OSD, 1995.
ICORES 2015 - International Conference on Operations Research and Enterprise Systems
62
