
Malware Classification Method Based on Sequence of Traffic Flow
Hyoyoung Lim
1
, Yukiko Yamaguchi
2
, Hajime Shimada
2
and Hiroki Takakura
2
1
Graduate School of Information Science, Nagoya University, Furo-cho, Chikusa-ku, Nagoya, Japan
2
Information Technology Center, Nagoya University, Furo-cho, Chikusa-ku, Nagoya, Japan
Keywords:
Malware Classification, Sequence alignment, Clustering, Traffic Flow.
Abstract:
Network-based malware classification plays an important role in improving system security than system-based
malware classification. The vast majority of malware needs a network activity in order to accomplish its pur-
pose (e.g., downloading malware, connecting to a C&C server, etc.). Many malware classification approaches
based on network behavior have thus been proposed. Nevertheless, they merely rely on either a request URL
or payload for signature matching. To classify the network activity of malware, the patterns of network be-
havior must be understood and the changes in behavior observed. Therefore, the sequence of flows and their
correlation caused by the malware should be analysed. In this paper, we present a novel malware classification
method based on clustering of flow features and sequence alignment algorithms for computing sequence simi-
larity, which represents network behavior of malware. We focus on analysing the sequence similarity between
the sequence patterns of malware traffic flow generated by executing malware on the dynamic analysing sys-
tem. We also performed an evaluation by using malware traffic collected from a real environment. On the basis
of our experimental results, we identified the most appropriate method for classifying malware by similarity
of network activity.
1 INTRODUCTION
One of the major security threats on the Internet is
malware, i.e., malicious software. According to a re-
port in Q1 2014 by McAfee (McAfee, 2014), the total
number of variants of malware in McAfee Labs ex-
ceeded 200 million. Security of the Internet systems
critically depends on the capability to keep anti-virus
software (AVs) up-to-date and maintain high detec-
tion accuracy against new malware. However, mal-
ware variants evolve so fast they cannot be detected
by conventional signature-based detection. Further-
more, in contrast to the growing number of mali-
cious codes, the number of analysts is markedly lim-
ited. Therefore, malware classification techniques
have been proposed as solutions to deal with these
problems.
Classification systems based on malware behav-
ior are generally divided into two approaches. One
relies on features extracted from the behavior of a
system level, and the other depends on features ex-
tracted from network traffic. The vast majority of
malware needs a network activity in order to accom-
plish its purpose (e.g., downloading other malware,
connecting to a C&C server, sending spam, stealing
personal information, port scanning, and other typi-
cal network tasks). Many malware classification ap-
proaches based on network behavior have thus been
proposed. Nevertheless, they merely rely on either
a request URL or payload for signature matching.
To classify the network activity of malware, the pat-
terns of network behavior must be understood and the
changes in behavior observed. Therefore, the flow se-
quence should be analysed that provides interactive
information of flow parameters caused by the mal-
ware and their correlation.
In this paper, we present a novel malware clas-
sification method that is based on clustering of flow
and sequence alignment of sequence patterns that rep-
resent network behavior of malware. We focus on
analysing the sequence similarity among the sequence
patterns of malware traffic flow that is generated by
executing malware on a dynamic analysing system.
We performed an evaluation by using malware traffic
collected from the real environment. On the basis of
our experimental results, we identified the most ap-
propriate method for classifying malware by similar-
ity of network activity.
The rest of this paper is organised as follows.
Section 2 introduces the related work on behavioral
malware classification and sequence alignment algo-
rithm. Section 3 describes our malware classification
230
Lim H., Yamaguchi Y., Shimada H. and Takakura H..
Malware Classification Method Based on Sequence of Traffic Flow.
DOI: 10.5220/0005235002300237
In Proceedings of the 1st International Conference on Information Systems Security and Privacy (ICISSP-2015), pages 230-237
ISBN: 978-989-758-081-9
Copyright
c
2015 SCITEPRESS (Science and Technology Publications, Lda.)

method. Section 4 details experiments that were con-
ducted and analyses their results to measure the ac-
curacy of the method. We finally conclude this paper
and mention our future work in Section 5.
2 RELATED WORKS
2.1 Network Behavior-based Malware
Classification
Reliably extracting the features is a considerable chal-
lenge in malware classification. The features of mal-
ware are difficult to extract using only the static anal-
ysis, because the malware is often encrypted, com-
pressed, or complicatedly described to obstruct mal-
ware analysis. Accordingly, many techniques have
been explored by executing malware to extract its fea-
tures. For malware classification, network behavior-
based approaches have been proposed in the literature
for classifying malware samples.
Although most AVs use signature matching tech-
niques for detecting malware, Berger-Sabbatel and
Duda (Berger-Sabbatel and Duda, 2012) revealed that
this approach can be easily evaded. They (Berger-
Sabbatel and Duda, 2012) presented the method for
observing the communication patterns of executing
malware with DNS replies. Other papers (Stakhanova
et al., 2011; Nari and Ghorbani, 2013) investigated
malware behavior using network activity graphs and
graph similarity analysis. To focus on more spe-
cific information of network behavior, Perdisci et al.
(Perdisci et al., 2010) addressed the malware clus-
tering system by extracting HTTP traffic traces and
analysing their similarity. Different from previous
works, Rafique et al. (Rafique et al., 2014) proposed
a framework for extracting the features from the pro-
tocol and traffic state in order to use the information
obtained from all protocols.
However, they did not consider the dependency
on network flow or capture malware’s network behav-
ior well enough to distinguish between different mal-
ware. In contrast to these approaches, we use only
network traffic flow data and generate representations
of malware’s network behavior for appropriate classi-
fication.
2.2 Sequence Alignment in
Bioinformatics
Sequence alignment is a method that compares two or
more character sequences to obtain their similarities
and dissimilarities.
First, Needleman and Wunsch (Needleman and
Wunsch, 1970) proposed pair-wise global alignment,
which evaluates amino acids by match/mismatch
scores and gap penalties. Then, Smith and Waterman
proposed pairwise local alignment (Smith and Water-
man, 1981). Both are based on dynamic program-
ming.
The Smith-Waterman algorithm replaces all the
negatives in the similarity matrix with 0. Despite the
increased length of alignment results, if the similarity
values no longer increase, this algorithm terminates
backtracking and outputs the results. In accordance
with the differences between the two algorithms, we
could obtain better precision to analyse the pattern of
network activities.
Malware classification using sequence alignment
has been extensively studied by malware analysis and
detection researchers to classify normal, misuse, or
unknown behavior. Several studies have proposed
malware detection or classification. Inspired by the
Smith-Waterman local alignment algorithm, Coull et
al. presented a detection approach (Coull et al., 2003).
The authors later enhanced it and presented a se-
quence alignment method using a binary scoring and
a signature updating scheme to detect masquerade
attacks (Coull and Szymanski, 2008). Another re-
cent approach for detection is analysing API call se-
quences and classifying them as benign or malicious
(Shankarapani et al., 2011).
Two techniques for malware classification us-
ing sequence alignment have recently been proposed
(Iwamoto and Wasaki, 2012; Pedersen et al., 2013).
Both extract more detailed information from binaries,
including sequences of API calls and the graphical
representations of control flow. We extend the pre-
vious studies that focused on network activity of se-
quencing features.
3 MALWARE CLASSIFICATION
In this section, we describe the proposed method for
malware classification based on network behavior.
Figure 1 shows an outline of the proposed method,
which is composed of the training and classification
phases. Both phases consist of four steps, which are
summarised below.
1. Feature Extraction: Extracts the network flow that
reflects the network behavior of malware.
2. Feature Clustering: Classifies the extracted flow
data to the closest cluster.
3. Sequence Generation: For the set of the malware’s
flow, generates a sequence pattern by using the
clustering result.
MalwareClassificationMethodBasedonSequenceofTrafficFlow
231
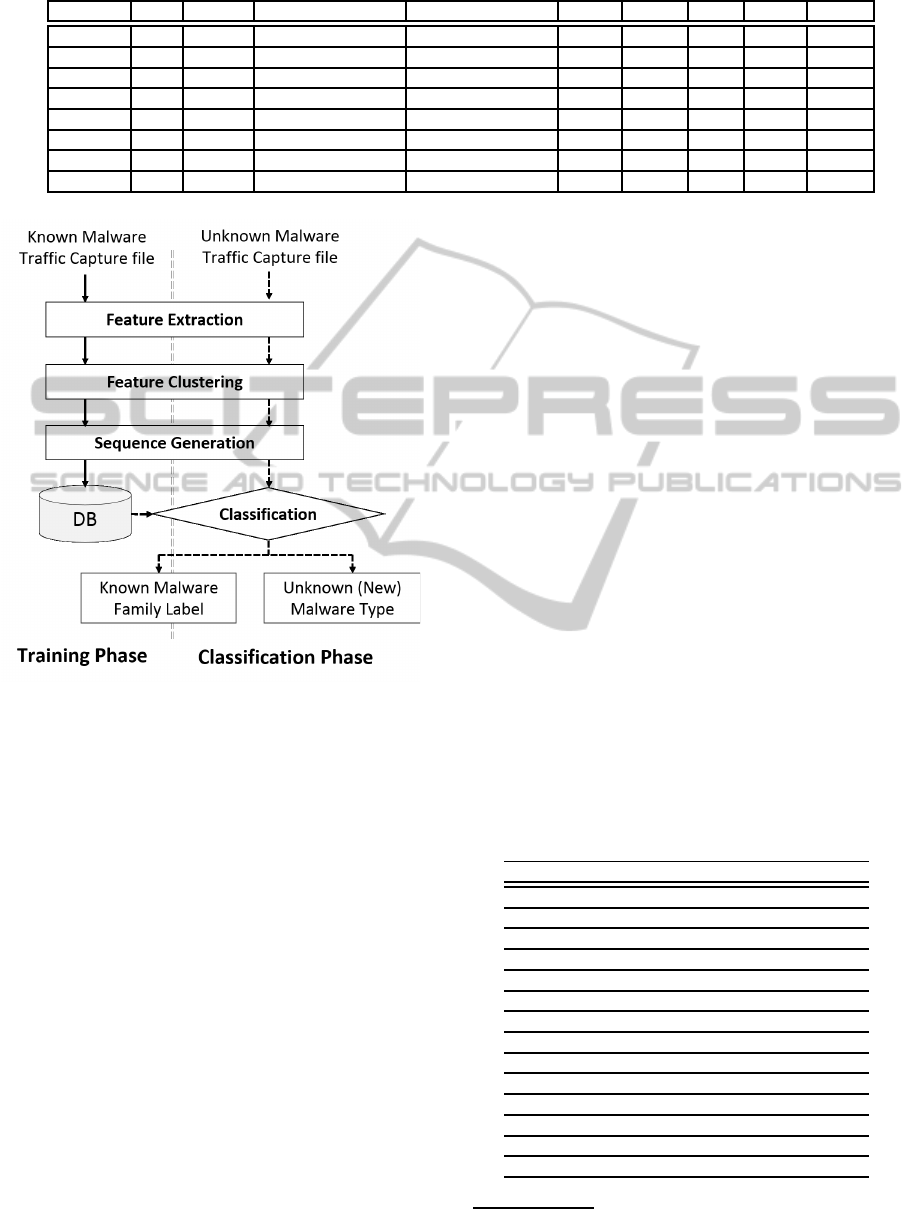
Table 1: Examples of Flow Data.
Dur Seq Proto SrcAddr DstAddr Sport Dport Dir State TotPk
2.99995 1 RARP 00:0c:29:89:7d:fa 00:0c:29:89:7d:fa - - who INT 2
0.00000 2 IGMP 10.0.0.0 224.0.0.1 - - → INT 1
0.00033 3 ARP 192.168.1.1 192.168.1.2 - - who CON 2
0.75628 4 UDP 192.168.1.2 10.0.0.1 1037 53 ↔ CON 2
0.00350 5 TCP 192.168.1.2 *.*.*.158 1035 80 → CON 5
0.00071 5 TCP 192.168.1.2 *.*.*.158 1035 80 → RST 5
0.00005 6 UDP 192.168.1.2 192.168.1.255 138 138 → INT 3
0.00013 6 UDP 192.168.1.2 192.168.1.255 138 138 → REQ 3
Figure 1: The Overview of Malware Classification.
4. Classification using Sequence Alignment: Classi-
fies the sequence data with similarity on the basis
of the sequence alignment algorithm.
3.1 Feature Extraction
The goal of this work is to classify unknown malware
in accordance with a sequence pattern of observable
features. The features are extracted from the network
traffic flow generated by a dynamic analyser during
the execution of the malware. To classify malware
meticulously on the basis of its behavior, the malware
analysis system is recommended to suitably reflect
malware activities. Furthermore, to classify malware
effectively, the features must be easy to extract and
provide sufficient information to discriminate among
different malware families. We have gained both the
header and payload of network packets. However,
when using the payload, it requires a lot of storage
space and time for analysing. On the other hand,
the header information of the packets can be analysed
even if the communication is encrypted. Accordingly,
we decided to use the flow sequence that is most suit-
able to observe the flow of packets.
We suppose that the malware samples were ex-
ecuted by the dynamic malware analyser to collect
network traffic capture files. Our method, therefore,
adopts traffic data collected by Botnetwatcher (Aoki
et al., 2010), which has been developed by NTT Se-
cure Platform Lab and connected to the Internet.
The pcap format file is analysed through Argus
1
,
which extracts flow data from network traffic files.
Table 1 provides examples of flow data extracted from
real malware samples. Note that IP addresses are
sanitised for privacy protection. As shown in Table
1, the flow extracted by Argus contains all types of
protocols of traffic that are invoked by the malware.
Among these protocols, TCP and UDP can deeply
correlate with behavior of malware, thus we adopt
them as features for clustering.
The feature used for the clustering is not a char-
acteristic that only determines whether the packets
are normal or malicious. Rather, it is used as a rep-
resentative attribute of the flow element. Therefore,
our method only requires appropriate extraction of the
flow characteristics as a preprocessor. We defined the
Table 2: Feature based on Flow Data.
Feature Name Explanation
Dur Record total duration
Seq Argus sequence number
Proto Transaction protocol
SrcAddr Source IP address
DstAddr Destination IP address
Sport Source port number
Dport Destination port number
Dir Direction of transaction
State Transaction state
TotPkts Total transaction packet count
SrcPkts Src → dst packet count
DstPkts Dst → src packet count
SrcLoad Source bits per second
DstLoad Destination bits per second
1
http://qosient.com/argus/
ICISSP2015-1stInternationalConferenceonInformationSystemsSecurityandPrivacy
232
Table 3: Result of Flow Clustering (k=8).
Cluster
A B C D E F G H Total
Number of Flows
3,810 15,545 3,265 3,827 2,541 4,665 12,615 8,342 54,610
Percentage (%)
6.9 28.5 6.0 7.0 4.6 8.5 23.1 15.2 100
Table 4: Example of Sequence Data (k=8).
The name of Malware Sequence data
Virus.Sality.gen.1
BGGBGGBBBGGBGGBGGBGGEEEEEEEEEBEEEEEEEEEEEEBE...
Virus.Sality.gen.2
CBGHBGGBBBGGBGGBGGBGGEEEEEEEEEEEEEEEEEEEEECEBE...
Backdoor.Simda.abxr
DCCCDBAACAAADABAGGADDDDGGBDDCCBD
Backdoor.Simda.acak
DGHGGGHGGGGGGGGGHGGGGGDGGGGGGGGGGGGGBGGHH...
Backdoor.Simda.acam
DGHGGGHGHHGGGGGGHGGGGGGGGGGGGGGGGGGGGBGB...
Backdoor.Simda.acbg
GHGGGHHHGGGGGGGHGGGGGCGGGGGGGGGGGGGGGBGB...
Trojan-Spy.Win32.Zbot.rfjs
DDEEEEEEBBEEEEEEBEEEEBBHBBBBBBBBBBBBBBBBBBBBBBBBBBBBB...
Trojan-Spy.Win32.Zbot.rncv
EEEEEEEEEEEEEEEEEEEEBGHBBBBBBBBBBBBBBBBBBBBBBBBBBBBBB...
Trojan-Spy.Win32.Zbot.rofw
BEEEEEBEBBEEEEEEBBHBBBBBBBBBBBBBBBBBBBBBBBBBBBBBBBBBB...
Trojan-Spy.Win32.Zbot.qtpy
EEEEEEEEEEEEEEEEEEEBHBBBBBBBBBBBBBBBBBBBBBBBBBBBBBBBB...
Trojan-Spy.Win32.Zbot.qtuj
DEEEEEEEEEEEEEEEEEEEEBHBBBBBBBBBBBBBBBBBBBBBBBBBBBBBB...
following 14 features as listed in Table 2. In addi-
tion to the five-tuple (SrcAddr,DstAddr, Sport, Dport,
Proto) and direction (Dir) information that can be au-
tomatically extracted from a packet header, eight fea-
tures are defined, including the duration of the flow
(Dur), the Argus sequence number from the partic-
ular session (Seq), and the transaction state of flow
(State).
3.2 Feature Clustering
To cluster flow data, we use a K-means algorithm
that is commonly used for unsupervised learning tech-
niques. In the work of Erman et al.(Erman et al.,
2006), K-means is suitable to classify the traffic flows
faster than the other algorithm. It proceeds by select-
ing k initial cluster centers and then iteratively refin-
ing them through the following steps.
1. Select an initial partition with k cluster centers;
repeat steps 2 and 3 until clusters stabilise.
2. Generate a new partition by assigning each ob-
ject to its closest cluster centre by minimising the
square-error.
3. Compute new cluster centers
The formula for the square error V is shown by
Equation (1).
V =
k
∑
i=1
∑
j∈S
i
|x
j
− µ
i
|
2
(1)
The square error is calculated as the distance
squared between each object x and the centre of its
cluster µ
i
. Object µ
i
represents the respective centre
of each cluster.
Table 3 shows an example of clustering under the
condition of k = 8. In this example, K-means algo-
rithm is applied to a Botnetwatcher dataset, which
consists of 54,610 flows generated by 515 malware
samples. As shown in Table 3, clusters are labelled
by A ∼ H.
3.3 Sequence Generation
In this step, a sequence pattern for each variants of
malware is generated by using the clustering result.
The sequence represents the abstracted behavior of
the malware. When two sequence patterns are sim-
ilar, the same network activity may be the cause. We
can identify a malware family with distinctive net-
work behavior.
Table 4 shows an example of sequence patterns
generated by K-means clustering with k = 8. As
shown in Table 4, similar sequences can possibly be-
long to the same malware family.
In the next step, therefore, the sequence patterns
are used to identify the malware families.
3.4 Classification using Sequence
Alignment
For similarity measurement between variant of mal-
ware, our research adopted two sequence alignment
algorithms introduced in Section 2.2: Needleman-
Wunsch and Smith-Waterman algorithms (Needle-
man and Wunsch, 1970; Smith and Waterman, 1981).
These two algorithms belong to the dynamic pro-
gramming, which is a method for solving complex
problems gradually using recurrences.
MalwareClassificationMethodBasedonSequenceofTrafficFlow
233

These algorithms do not simply find the longest
subsequence shared by two sequences. They have
three factors: gap, match, and mismatch. The gap
factor defines a penalty given to alignment when we
have insertion or deletion. Similarly, the gap, the
match, or mismatch factor is added to the score. The
match, mismatch, and gap factors should be defined
in advance. In this paper, we defined the factors as
follows: match = 10, mismatch = −5, gap = −5.
The Needleman-Wunsch algorithm computes the
similarity between two sequences X
n
and Y
m
by us-
ing the score of similarity. The score of similar-
ity N
i, j
(0 ≤ i ≤ n, 0 ≤ j ≤ m) between sequences
X = {x
1
, x
2
, . . . x
n−1
, x
n
} and Y = {y
1
, y
2
, . . . y
m−1
, y
m
}
can be computed by Evaluation (2). The subsequence
with the highest score is defined as a common subse-
quence between the two sequences.
N
i, j
= max
N
i−1, j−1
+ P(X
i
, Y
j
),
N
i−1, j
+ gap,
N
i, j−1
+ gap.
(2)
P(X
i
, Y
j
) =
(
match (X
i
= Y
j
),
mismatch (X
i
6= Y
j
).
(3)
On the other hand, the Smith-Waterman algorithm
shows that a local alignment can be computed using
essentially the same idea employed by Needleman-
Wunsch. The recurrence relation is slightly altered
because an empty string is a suffix of any sequence,
so a score of zero is always possible. Evaluation (4) is
used to compute the score S
i, j
using Smith-Waterman.
S
i, j
= max
S
i−1, j−1
+ P(X
i
, Y
j
),
S
i−1, j
+ gap,
S
i, j−1
+ gap,
0.
(4)
For example, we have aligned the
malware samples Virus.Sality.gen.1 and
Trojan-Spy. Win32.Zbot.rfjs in Table 4 by using
two algorithms. Figures 2 and 3 represent results
of Needleman-Wunsch and Smith-Waterman algo-
rithms, respectively. In these figures, the symbols −
and | indicate the gap and match. The Needleman-
Wunsch algorithm attempts to align every element in
every sequence.
Figure 2: The Alignment Result using Needleman-Wunsch.
On the other hand, for the alignment result by the
Smith-Waterman algorithm, this algorithm attempts
to align a part of the two sequences. Therefore,
the Smith-Waterman algorithm obtains a shorter to-
tal alignment than the Needleman-Wunsch algorithm.
Figure 3: The Alignment Result using Smith-Waterman.
In both methods, the similarity between two se-
quences is given as follows:
Similarity =
Length of subsequence with highest score
Total length of sequence used by alignment
These two algorithms have drawbacks when ap-
plied to our method. When the difference between
lengths of the sequences is large, they are difficult to
define as similar even if their similarity is 100%.
For the Unified algorithm, we calculate the av-
erage of the similarity of the two algorithms. The
similarity of the Unified algorithm is given as fol-
lows (Similarity
N
: Needleman-Wunsch, Similarity
S
:
Smith-Waterman, Similarity
U
: Unified algorithm):
Similarity
U
=
Similarity
N
+ Similarity
S
2
For example, the results of similarity between
the variants of Sality and Zbot in Table 4 (Sality 1:
Virus.Sality.gen.1, Sality 2: Virus.Sality.gen.2, Zbot:
Trojan-Spy.Win32.Zbot.rfjs) are shown in Table 5.
Table 5: Example of Similarity Results (%).
Similarity
S
Similarity
N
Similarity
U
Example 1 91.2 91.0 91.1
Example 2 94.7 5.6 50.2
Example 1: Sality 1 and Sality 2
Example 2: Sality 1 and Zbot
As shown in Table 5, the Unified algorithm over-
comes the shortcomings of the two algorithms.
4 EXPERIMENTS AND RESULTS
In this section, we demonstrate the results of our
experiments. We first generate training and testing
Table 6: Number of the Training and Testing Datasets.
Training Testing Total
# of Family 23 23
# of Sample 58 383 441
ICISSP2015-1stInternationalConferenceonInformationSystemsSecurityandPrivacy
234

Table 7: Family Name and Number of Samples in the Training and Testing Datasets.
No. Family Label # of Sample # of Training # of Testing Average Similarity
1 Backdoor.Androm 4 1 3 44.3
2 Backdoor.DarkKomet 5 1 4 45.1
3 Backdoor.Simda 6 1 5 60.1
4 AdWare.NSIS.Agent 3 1 2 51.1
5 AdWare.Agent 3 1 2 41.9
6 nMonitor.Ardamax 2 1 1 78.5
7 Packed.Katusha 3 1 2 39.9
8 Trojan.Agent 5 1 4 43.1
9 Trojan.Badur 4 1 3 75.2
10 Trojan.Inject 8 1 7 45.8
11 Trojan.Neurevt 3 1 2 58.7
12 Trojan.Pakes 2 1 1 73.8
13 Trojan.VB 3 1 2 65.4
14 Trojan.Yakes 206 21 185 74.7
15 Trojan-Downloader.Agent 2 1 1 51.2
16 Trojan-FakeAV.FakeSysDef 67 7 60 73.8
17 Trojan-PSW.Tepfer 2 1 1 33.6
18 Trojan-Ransom.Agent 11 2 9 72.1
19 Trojan-Ransom.Foreign 81 9 72 73.2
20 Trojan-Spy.Zbot 9 1 8 53.5
21 Virus.Sality 2 1 1 91.1
22 HEUR:Trojan-Downloader 6 1 5 49.5
23 HEUR:Trojan 4 1 3 64.3
Total 441 58 383 -
datasets from real malware samples. The datasets for
measuring the effectiveness of experiment are impor-
tant, because they are to be the criteria for classifica-
tion. We then discuss the classification accuracy of
the proposed classification method. Finally, we dis-
cuss the experiment results.
4.1 Family Labeling and Datasets
For evaluation, we used the malware dataset provided
by NTT Secure Platform Lab. This dataset consists of
the network traffic (pcap file) gathered by 30-minute
execution of each malware sample using a dynamic
malware analysis system, namely Botnetwatcher.
The dataset also includes labels assigned by 11
kinds of antivirus software that scanned each mal-
ware sample. Among them, we used the labels from
Kaspersky to create the labelled dataset, because the
classification criteria applied to Kaspersky are based
on the behavior of malware.
Kaspersky has classified malware using all fea-
tures of malware, including network traffic flow. In
contrast, our method only focuses on the network be-
havior of malware extracted from network flow. In
the experiment, we compared the classification of
Kaspersky and our classification method. If the re-
sults of the comparison are similar to the labeling of
Kaspersky, it is possible to prove the effectiveness of
the classification based on the network behavior.
We identified 23 families of malware samples with
Kaspersky. We divided them into training and test-
ing datasets. We extracted 10% of samples from each
23 families of malware samples in the training dataset
(58 samples) and the remaining samples from the test-
ing dataset (383 samples). To obtain a balanced train-
ing dataset, we limited the distribution of each family
in the training dataset to 40% of the entire dataset.
Table 6 shows the number of families and samples in
the training and testing datasets. Table 7 shows the
families of samples in the training and testing dataset.
Table 8 shows similarity between the variants of
Backdoor.Simda, which is one of the families we
identified. The maximum and minimum values of the
similarity are 89.7% and 31.1%. The average percent-
age of similarity is 60.1%. Table 7 indicates the av-
erage percentage of similarity calculated for malware
samples in each family.
Table 8: Similarity between Variants of BS (%, k=8).
BS
1
BS
2
BS
3
BS
4
BS
5
BS
1 - - - - -
BS
2 76.5 - - - -
BS
3 89.7 75.6 - - -
BS
4 77.5 69.3 78.9 - -
BS
5 32.0 37.2 33.4 31.1 -
BS
: Backdoor.Simda
MalwareClassificationMethodBasedonSequenceofTrafficFlow
235
0
20
40
60
80
100
Top 1 Top 3 Top 5 Top 10 Top 30
Accuracy (%)
Smith-Waterman Algorithm
Needleman-Wunsch Algorithm
Unified Algorithm
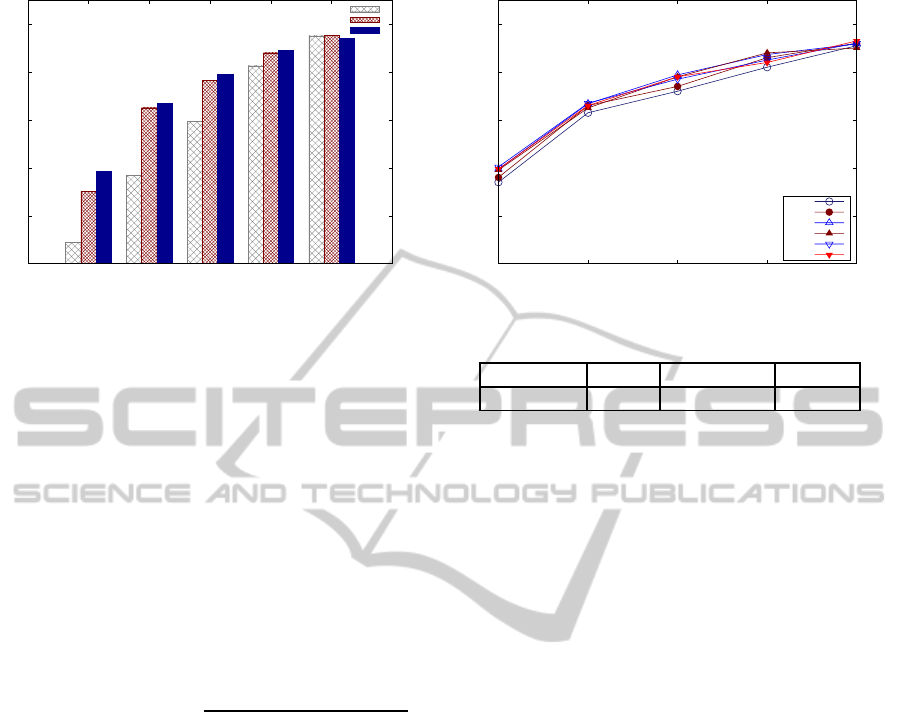
Figure 4: Classification Accuracy with Ranking.
4.2 Classification Accuracy
We measured the similarity between the training and
testing datasets, that is, we calculated similarity be-
tween one testing dataset and each individual train-
ing dataset. Then, we sorted them by the rankings
from No.1 to No.58 in decreasing order of similarity
and made comparisons by using the labels assigned
by Kaspersky. By taking comparison results into ac-
count, the testing data are classified into the fam-
ily with the highest degree of similarity. We define
the following indices for performance comparison (T:
malware samples of the Testing dataset). The results
are shown Table 9.
Classification Accuracy =
# of T classified correctly
# of T
To calculation algorithms, we used the three al-
gorithms referred to in Section 3.4. We obtained
8.9% and 30.1% by using Smith-Waterman and
Needleman-Wunsch algorithms, respectively. By us-
ing the Unified algorithm, which is the average value
of the two algorithms, we obtained the highest result,
38.4%.
Figure 4 indicates the classification accuracy with
the three algorithms. According to Figure 4, when we
take care of classification within the Top 3, the classi-
fication accuracy exceeds 60%. This result shows the
feasibility of our method by improving our algorithm.
4.3 Discussion of Classification Results
The results of our experiment show that malware can
be classified on the basis of network flow sequence
with sequence alignment.
First, we have examined the impact of cluster k on
the classification accuracy. Figure 5 shows the accu-
racy of each rank for when the cluster k changed from
0
20
40
60
80
100
Top 1 Top 3 Top 5 Top 10 Top 30
Accuracy (%)
k=6
k=7
k=8
k=9
k=10
k=11
Figure 5: Classification Accuracy with Cluster k(k).
Table 9: Classification Accuracy (%).
Algorithm Smith Needleman Unified
Accuarcy 8.9 30.1 38.4
Smith: Smith-Waterman Algorithm
Needleman: Needleman-Wunsch Algorithm
Unified: Unified Algorithm
6 to 11. As shown in Figure 5, there is no signifi-
cant impact on the accuracy under the difference on
k. This means that our clustering of flow is stable.
From Table 7, the majority of families have a few
samples. On the other hand, Trojan.Yakes accounts
for almost half the samples. Also, some families, such
as Trojan.Yakes (14) and Trojan-Ransom.Foreign
(19), have much larger numbers of samples than the
other families. This is because the dataset that we
used is real malware collected from October 2013 to
March 2014, focusing on specific distribution of mal-
ware samples. For future work, we will complement
the distribution of malware samples.
As the results in Table 9 show, the highest clas-
sification accuracy was obtained by the Unified al-
gorithm, which is the average value of the two algo-
rithms and not the method using only one algorithm.
This shows that using the Unified algorithm can over-
come the shortcomings of the two algorithms. We ob-
tained a low accuracy, less than 40%, which we must
devise measures to improve. This should be solved
by improving the algorithm to take advantage of the
accuracy in the Top 3 rankings shown in Figure 4.
Finally, the method needs to be improved to clas-
sify unknown malware. In this study, we performed
experiments with only the known families. For future
work, we need to improve the classification method
for new malware.
ICISSP2015-1stInternationalConferenceonInformationSystemsSecurityandPrivacy
236

5 CONCLUSIONS
In this paper, we proposed a malware classification
method based on sequence pattern generated by net-
work flow of malware samples. The goal was to clas-
sify malware only by using its network behavior. The
method begins by extracting flow data from traffic ex-
tracted by a dynamic analyser of malware. We ex-
tract features of flow and cluster them by a K-means
algorithm. On the basis of the clustering result, the
sequence patterns are generated. These patterns rep-
resent the network behavior of a malware family. Fi-
nally, we classify the malware’s behavior by using a
sequence alignment algorithm. Although our experi-
ment is preliminary, its results show that it can clas-
sify new types of malware into appropriate families as
their variants.
Our future work will focus on studying the clas-
sification of unknown malware against known mal-
ware families using network behaviors. We intend to
continue developing and testing the classification sys-
tem, while expending our malware samples and refin-
ing our classification algorithm. We are also going
to compare our method with other classification sys-
tems that use malware behavior. Our classification
method has the potential to accurately analyse mal-
ware behavior, which should assist developers of anti-
malware software to catch up with the rapid evolution
of malware.
ACKNOWLEDGEMENTS
This work is supported by R&D of detective and an-
alytical technology against advanced cyber-attacks,
administered by the Ministry of Internal Affairs and
Communications.
Also, we thank Dr. Takeshi Yagi, who is a re-
searcher in NTT Secure Platform Lab., for providing
us the traffic capture data of malware samples.
REFERENCES
Aoki, K., Kawakoya, Y., Iwamura, M., and Itoh, M. (2010).
Investigation about malware execution time in dy-
namic analysis. In Computer Security Symposium.
Berger-Sabbatel, G. and Duda, A. (2012). Classification of
malware network activity. In Multimedia Communica-
tions, Services and Security, pages 24–35. Springer.
Coull, S., Branch, J., Szymanski, B., and Breimer, E.
(2003). Intrusion detection: A bioinformatics ap-
proach. In Computer Security Applications Confer-
ence, 2003. Proceedings. 19th Annual. IEEE.
Coull, S. E. and Szymanski, B. K. (2008). Sequence align-
ment for masquerade detection. Computational Statis-
tics & Data Analysis, 52(8):4116–4131.
Erman, J., Arlitt, M., and Mahanti, A. (2006). Traffic clas-
sification using clustering algorithms. In Proceedings
of the 2006 SIGCOMM workshop on Mining network
data, pages 281–286. ACM.
Iwamoto, K. and Wasaki, K. (2012). Malware classification
based on extracted api sequences using static analy-
sis. In Proceedings of the Asian Internet Engineeering
Conference, AINTEC ’12, pages 31–38, New York,
NY, USA. ACM.
McAfee (2014). Mcafee labs threats report: June 2014.
Nari, S. and Ghorbani, A. A. (2013). Automated malware
classification based on network behavior. In Comput-
ing, Networking and Communications (ICNC), 2013
International Conference on, pages 642–647. IEEE.
Needleman, S. B. and Wunsch, C. D. (1970). A gen-
eral method applicable to the search for similarities
in the amino acid sequence of two proteins. Journal
of molecular biology, 48(3):443–453.
Pedersen, J., Bastola, D., Dick, K., Gandhi, R., and Ma-
honey, W. (2013). Fingerprinting malware using
bioinformatics tools building a classifier for the zeus
virus. The 2013 International Conference on Security
& Management (SAM2013).
Perdisci, R., Lee, W., and Feamster, N. (2010). Behavioral
clustering of http-based malware and signature gener-
ation using malicious network traces. In NSDI.
Rafique, M. Z., Chen, P., Huygens, C., and Joosen, W.
(2014). Evolutionary algorithms for classification
of malware families through different network be-
haviors. In Proceedings of the 2014 conference on
Genetic and evolutionary computation, pages 1167–
1174. ACM.
Shankarapani, M. K., Ramamoorthy, S., Movva, R. S., and
Mukkamala, S. (2011). Malware detection using as-
sembly and api call sequences. Journal in computer
virology, 7(2):107–119.
Smith, T. F. and Waterman, M. S. (1981). Identification of
common molecular subsequences. Journal of molec-
ular biology, 147(1):195–197.
Stakhanova, N., Couture, M., and Ghorbani, A. A.
(2011). Exploring network-based malware classifi-
cation. In Malicious and Unwanted Software (MAL-
WARE), 2011 6th International Conference on, pages
14–20. IEEE.
MalwareClassificationMethodBasedonSequenceofTrafficFlow
237
