
Computer Annotation of Nucleic Acid Sequences in Bacterial
Genomes Using Phylogenetic Profiles
Mikhail A. Golyshev
1
and Eugene V. Korotkov
1,2
1
Bioinfomatics laboratory, Centre of Bioengineering, Russian Academy of Sciences, Prospect 60-letiya Oktyabrya 7/1,
Moscow, 117312 Russian Federation
2
Department of Applied Mathematics, National Research Nuclear University “MEPhI”, Kashirskoe shosse 31, Moscow,
115409 Russian Federation
Keywords: Genes, Annotation, DNA Similarity, Bacterial Genpmes, Phylagenetic Profile.
Abstract: Over the last years a great number of bacterial genomes were sequenced. Now one of the most important
challenges of computational genomics is the functional annotation of nucleic acid sequences. In this study
we presented the computational method and the annotation system for predicting biological functions using
phylogenetic profiles. The phylogenetic profile of a gene was created by way of searching for similarities
between the nucleotide sequence of the gene and 1204 reference genomes, with further estimation of the
statistical significance of found similarities. The profiles of the genes with known functions were used for
prediction of possible functions and functional groups for the new genes.We conducted the functional
annotation for genes from 104 bacterial genomes and compared the functions predicted by our system with
the already known functions. For the genes that have already been annotated, the known function matched
the function we predicted in 63% of the time, and in 86% of the time the known function was found within
the top five predicted functions. Besides, our system increased the share of annotated genes by 19%. The
developed system may be used as an alternative or complementary system to the current annotation systems.
1 INTRODUCTION
Recent advances in genome sequencing have
provided access to a wide variety of nucleic acid
sequences (Eisenhaber, 2012). Thousands of
complete bacterial genomes, as well as numerous
eukaryotic genomes are now available for use. But
to effectively apply this knowledge, we must
understand the functions of genes in cells, which
makes functional characterization, i. e. annotation of
the already sequenced genes, our top priority (Janitz,
2007). There are two methods to solve this task. The
first one is in vitro – the experimental biological
approach, which allows us to receive the most
reliable information about the functions of genes and
other sequences (Saghatelian and Cravatt 2005).
However, these researches are quite time-consuming
and expensive. In silico approach is the other option:
computer-based annotation is rather low-cost and the
results can be obtained much faster. Yet, the
reliability is not high compared to the experimental
approach. Besides, there are genes which cannot be
annotated with the computer approach, and their
share in bacterial genomes, though varying for
different genomes, averages 45% (Galperin and
Koonin 2010). Our purpose is to develop new
mathematical and computational techniques in order
to increase the share of annotated genomes and
improve the annotation reliability (Richardson and
Watson 2013). The bacterial genes computer
annotation is based on one main principle: if two
sequences are similar, the probability of their
biological functions being similar is very high. This
idea underlies all of the currently used mathematical
annotation methods (Pandit et al., 2004; Friedberg
2006) of which the most widespread are those based
on the heuristic similarity search algorithm, multiple
sequence alignment, hidden Markov model (HMM)
and complex systems combining several methods.
These methods were used to assign functions to
nearly 60% of sequenced bacterial genes, while
around 40% are not yet characterized. Let’s examine
the main computer annotation methods in more
detail.
134
A. Golyshev M. and V. Korotkov E..
Computer Annotation of Nucleic Acid Sequences in Bacterial Genomes Using Phylogenetic Profiles.
DOI: 10.5220/0005236201340143
In Proceedings of the International Conference on Bioinformatics Models, Methods and Algorithms (BIOINFORMATICS-2015), pages 134-143
ISBN: 978-989-758-070-3
Copyright
c
2015 SCITEPRESS (Science and Technology Publications, Lda.)

1.1 Dynamic Programming and
Heuristic Algorithms
The main principle behind the annotation is as
follows: if a known sequence in a database is similar
to the one under study, their functions are likely to
be similar too. Methods used to detect similarities
between nucleotide sequences include global and
local alignment, both of which are based on dynamic
programming (Needleman & Wunsch 1970),(Smith
& Waterman 1981). These methods are the most
precise ones, but are not very efficient due to their
extensive computational complexity. Therefore, the
heuristic programming tools for pairwise alignment
such as BLAST (Altschul et al. 1990) and FASTA
(Pearson & Lipman 1988) with various Expect value
thresholds, and others are more widespread. As a
source of sequences with known functions they use
the following databases: RefSeq (Pruitt et al. 2005),
GenBank (Benson et al. 2013), KEGG Genes
(Kanehisa et al. 2004), UniProt (The UniProt
Consortium 2011), Swiss-Prot (Bairoch & Apweiler
1999). Compared to the dynamic programming,
however, the heuristic algorithms discover much
fewer significant alignments. At the same time, this
is the only approach allowing us to analyze all the
gene sequences available so far.
1.2 HMM-based Systems
PFAM (Finn et al. 2010) and TIGRfam (Haft 2003)
– these are both protein families databases
containing multiple alignments, HMM models, and
related information for automatic classification and
annotation of new proteins. The search for the most
probable models is carried out with HMMER3 (Finn
et al. 2010) or PSI-BLAST (Altschul et al. 1997)
software tools. To annotate genes using HMM, it is
necessary to form the training and validation gene
sets, train the HMM models and conduct cross-
validation. Then the best match between the HMM
and the gene under study is used for functional
annotation. This approach inherits all of the features,
advantages and disadvantages of machine learning:
importance of forming original samples correctly,
avoiding system retraining, etc. At the same time,
the quality of functions prediction with HMM is
much higher than in some machine learning
algorithms (Ali 2004).
1.3 Phylogeny-based Methods
One of these methods uses the COG database
(Tatusov et al. 2000), which contains clusters of
orthologous genes. Three or more genes are grouped
into one cluster if they are found in different
genomes and are more similar to each other than to
other genes in these genomes. Currently there are
about five thousand COG clusters with known
biological functions. The main idea is that
orthologous genes are likely to have the same
biological functions. The method used to define such
functions is similar to the methods described above.
To annotate a gene, initially there is a database
created containing clusters of orthologs of known
genes. Further, the functions of the gene under study
as well as its COG cluster are defined by way of
searching for similarities between this gene and the
known genes from the database. The sequences are
compared by searching for significant alignments
with the BLAST software. One of the disadvantages
of the approach is the need to analyze a significant
number of organisms before a phylogenetic tree and
COG clusters can be created; the other one is that to
conduct the search for significant alignments the
heuristic tools are used, and they cannot guarantee
that all statistically significant alignments are
discovered.
1.4 Pipelines
InterPro (Hunter et al. 2012) is a system that uses the
protein families database with known functions,
signatures and GeneOntology (Ashburner et al.
2000) terms (GO) to determine features of new
proteins. InterPro contains 11 different databases:
Pfam, TIGRfam, SUPERFAMILY, and others. For
search and annotation the InterProScan tool is used
(Quevillon et al. 2005).
IMG(-ER) (Markowitz et al. 2012) is a system
for automatic annotation of new genomes and expert
functions review. It includes native IMG terms
derived from Pfam, TIGRfam, COG, SWISS-PROT,
GO, KEGG, and is used for annotation of
completely new genomes and for complementation
of existing annotations. The database contains more
than four thousand various gene functions; about
20% of all genes are covered by IMG terms.
J.Craig Venter Institute metagenomics analysis
pipeline (Tanenbaum et al. 2010) is a system for
structural and functional annotation of genes.
Functional annotation is based on BLAST, RPS-
BLAST, HMM, and other systems for homology
search between nucleotide sequences. As a result of
annotation, the gene is assigned a name, symbol, GO
terms, EC number, and JCVI functional role
categories.
RAST (Aziz et al. 2008) is a fully automated
ComputerAnnotationofNucleicAcidSequencesinBacterialGenomesUsingPhylogeneticProfiles
135

service for annotating bacterial and archaeal
genomes. It uses manually curated subsystems of
functional roles and protein families (FIGfams)
largely derived from the subsystems. This service is
developed by the SEED project, which also provides
convenient tools for viewing and analyzing results of
the annotations.
GenDB (Meyer et al. 2003) is an open source
project that provides a web interface and API for
gene annotation. For functional annotation it uses
BLAST, HMMER, InterProScan, and other
prediction tools.
Although by using several annotation methods
we can increase the number of genes with predicted
functions, complex systems inherit features and
drawbacks of their subsystems. Besides, it is
sometimes difficult to choose between the results
from different algorithms.
1.5 Phylogenetic Profiles
When the similarity between two nucleic or amino
acid sequences is not strong (usually that means
below 70%), we cannot be sure that these sequences
have the same biological roles notwithstanding the
number of similarities found. However, we shall
consider the fact that not a separate gene, but a
combination of genes involved in a genetic process
is relevant for the viability of bacteria. This means
that genes found in one and the same combination in
different bacterial genomes are most probably
involved in the same genetic process. Hence, the
information about the gene under study being
involved in a group of genes present in genomes of
different bacteria may be critically important for
prediction of its function.
To obtain this information, we form the so called
phylogenetic profiles (Gaasterland and Ragan, 1998;
Weiller 1998). They are created for every gene of
the bacterial genome using the following method.
First, certain genome sequences are selected, which
we will call the reference group. Then a
phylogenetic profile is built for every gene in these
sequences; this profile is a vector of ones and zeros
with the length equaling the size of the reference
group. Thus, every gene from the group matches "0"
or "1" in the corresponding phylogenetic profile: a
zero means the bacterial genome contains no
homolog for the gene under study; if a similar gene
is found, the entry is a one.
After constructing profiles for the reference
group, we build one for the gene under study. Using
a similarity metric we can now compare the profiles.
If the gene under study is part of a combination
involved in one genetic process, its profile will be
similar to one or several profiles in the reference
group. Otherwise no similarities will be found.
This approach was first used by (Gaasterland and
Ragan 1998) and than M.Pellegrini for protein
sequences (Pellegrini et al. 1999) and was
sufficiently developed over the last ten years in
terms of the creation, comparison and analysis of
phylogenetic profiles. Particularly, the concept of
using real vectors or matrices instead of binary
vectors was developed. Also, various approaches to
comparison of phylogenetic profiles were suggested,
such as the mutual information approach, Jaccard
coefficient, Pearson correlation, hypergeometric
distribution and others. The detailed review of the
approaches was given in studies (Pellegrini 2012;
Kensche et al. 2008).
However, the results very much depend on the
similarity search method used. In this study, we used
the phylogeny-based method, though a little
amended. Firstly, with the help of BLAST we
searched for homologs with different values of
reward and penalty, which ensured the reasonable
search speed and allowed us to find a large number
of local alignments. Secondly, we used the dynamic
programming algorithm (Needleman & Wunsch
1970) with the PuPy substitution matrix (Rastogi et
al. 2006) to see if a statistically significant global
alignment could be found where BLAST had
discovered a local one. The reason we looked for
global alignments only was that local alignments
often indicate partial similarities, not the whole gene
homologs. To define statistical significance of a
global alignment, the Monte Carlo method was used
(Raeside 1976). Thirdly, we compared the annotated
gene to the bacterial genomes, not to single genes,
which saved us from mistakes associated with the
structural annotation of bacteria, i. e. with genes
demarcation. Following this analysis, a phylogenetic
profile was built for every gene under study, which
was then compared to the profiles of the reference
group genes. Our study resulted in annotation of an
additional 19% of genes which couldn’t be
annotated with any of the previously used methods.
At the same time, we were unable to assign
statistically valid functions to 9% of the genes.
2 MATERIALS AND METHODS
2.1 Phylogenetic Profiles
Phylogenetic profiles are used to create sets of genes
that are involved in the same genetic process. This
BIOINFORMATICS2015-InternationalConferenceonBioinformaticsModels,MethodsandAlgorithms
136
approach was first applied in 1998 by M. Pellegrini
and his colleagues (Pellegrini et al. 1999). To create
a phylogenetic profile of a gene, it is necessary to
form a binary vector as follows: if a gene has been
detected in the i-th genome, the i-th position of the
vector contains 1; if there is no gene found, it is 0.
We assume that the genes involved in the same
genetic process will have similar phylogenetic
profiles constructed from the same set of reference
genomes. The assumption is derived from the fact
that the gene normally performs its function not
alone, but in conjunction with other genes as part of
one metabolic pathway. In the course of evolution
this process is inherited by different organisms; as a
result, more functional groups emerge containing
genes of similar profiles (Eisen 1998).
In this paper, for the predicted function we take
one of the most probable predicted functions from
the gene’s functional group. As you can see, the
phylogenetic approach does not use direct
comparison of the coding sequences of genes against
each other, but takes into account the co-occurrence
of certain genes in the genomes. So, this approach
can supplement the annotation methods discussed in
the previous section and predict functions for those
genes, for which the best similarity is significantly
lower than 70%.
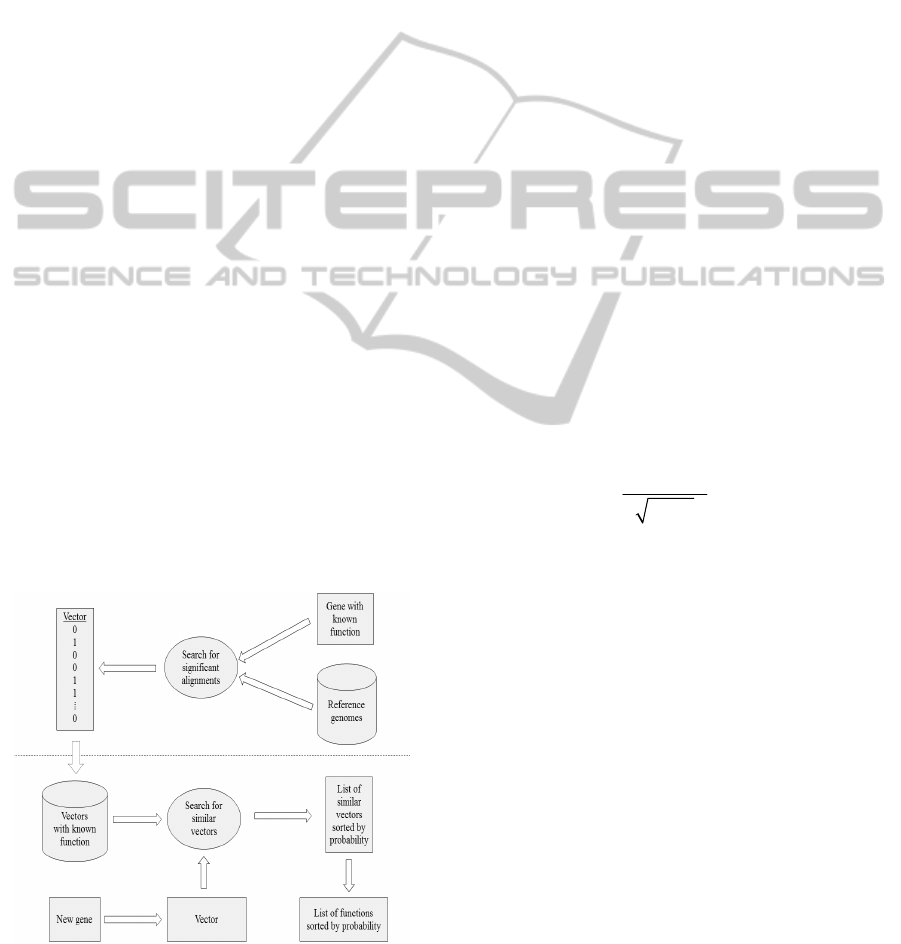
2.2 The Method Description
Our work in this study had two stages: creation of a
database containing phylogenetic profiles of genes
with known functions and prediction of the functions
for genes using the previously created database
(Figure 1).
Figure 1: Creation of the phylogenetic profiles database
for genes with known functions. Function prediction for a
new gene.
To create a phylogenetic profile of a gene, it is
necessary to determine a set of reference genomes.
As of this writing, there were more than 2,100
bacterial genomes sequenced; however, using close
genomes, for example strains of one organism,
impairs precision of predictions because occurrences
of the gene in such genomes are not independent.
And we also could not use all available genomes, as
the algorithm used for creating profiles for all genes
has O(n
2
) time complexity. Since we had to find all
genes in all of the selected genomes, the number of
comparisons made was N
2
, where N is the number of
all genes. So from all bacterial genomes we only
selected 1,204 as reference genomes. To create the
database of phylogenetic profiles, we used all the
genes with known functions from the 1,204
reference genomes: 3.7 million genes in total.
The major task in the database creation process
was to determine the similarity significance for each
pair of genes and genomes. First, we used BLAST
with different options to search for significant local
alignments. After that we extended the found local
alignments to global alignments and for each global
alignment we calculated scores F of dynamic
programming (Needleman-Wunsch algorithm
(Needleman & Wunsch 1970)) using the PuPy
matrix. Using the Monte Carlo method and Equation
1, we calculated statistical significance for each
global alignment on the assumption that the
distribution of the score F was normal (Feller 1968):
()
()
F
MF
Z
DF
(1)
where F is the score of alignment, M(F) and
D(F) are the sample mean and sample variance of
the random value F. The sequences sample was
created from the original sequence by randomly
shuffling its symbols. M(F) and D(F) were
calculated on the samples with size 1000.
Further, we created binary vectors for each gene
by the following rule: we assigned "1" to the i-th
element of the vector if the statistical significance of
the global alignment between the gene and the i-th
genome exceeded the chosen minimal value, and "0"
if no similarity was found or if its significance did
not exceed the chosen minimal value. Therefore, for
each gene we created a binary vector with length N,
where N is the number of referent genomes. We
chose the minimal value of statistical significance
Z=5.0, so that the probability to find more than one
1 for random sequences was 5%.
Since the names of the same functions may vary
in different annotation systems, we unified them by
using the Gene Ontology terms (GO). As a result,
ComputerAnnotationofNucleicAcidSequencesinBacterialGenomesUsingPhylogeneticProfiles
137

the predicted functions in our system are represented
as GO terms.
To predict a function, we first create a binary
vector for the gene in the same manner as when
creating the database of known functions, after
which we search for similar vectors in this database
using the probability measure that will be described
below. Let N be the size of the reference group and
the vector length, n
1
be the number of "1" in the
vector (i. e. in the phylogenetic profile) of the first
gene, n
2
be the number of "1" in the vector of the
second gene, n
12
be the number of common "1" (i. e.
placed in the same positions) in the first and second
genes. As measure of similarity between two
vectors, we chose the probability P of observing n
12
or greater co-occurrences between two profiles
purely by chance. As is known, the random variable
of common "1" follows the hypergeometric
distribution (Shuster 2005), hence the probability P
can be calculated by Equation 2:
2
12
11
2
12
min( , )
12
()
nk
k
nn
nNn
n
kn
N
CC
Pn n
C
(2)
where
!
!!
k
n
n
С
knk
– is the number of k-
combinations from the given set of n elements.
Vectors of the genes, the probability P for which
didn’t exceed the chosen threshold, participate in
determining the potential function of the annotated
gene. The result of the prediction is a list of possible
functions, sorted by the probability P. For
phylogenetic profiles filtering, we chose the P
0
threshold of 10
-7
. The vector pairs with P > P
0
are
considered different. We tested the selected
threshold on a set of random vectors: the selected P
0
value provides such level of significance, in which
of 10
7
comparisons of two random phylogenetic
profiles no more than one has the level of P < P
0
.
We tested how many phylogenetic profiles can
be created from "random genes" which have at least
one "1". For this purpose we mixed gene sequences
from referenced genomes and than created
phylogenetic profile for each mixed sequence using
the reference genomes. Only 0.4% sequences
contain at least one "1". The remaining profiles
contain only zeros. After that, we compared the
profiles of “random genes” which have at least one
"1" with profiles of genes from referenced genomes.
Only 39 “random genes” have profiles with P < P
0
.
2.3 Comparison of the Current Work
to Previously Conducted
Annotations
To evaluate the quality of the developed method, we
used it to predict possible functions for the genomes
which had already been annotated. Since the system
database already contained genes from these
genomes, for testing purposes we excluded them
from the reference group. The method detects a
functionally linked group of genes rather than the
one most probable function. That is why we
compare the known function not to the single
predicted one, but to the first K of more probable
functions. Below we describe the approach in more
detail.
Of 1204 reference genomes we selected at
random 104 bacterial genomes from various
families. For every genome, we defined the method
it was formerly annotated with and then grouped the
genomes accordingly (Table 1). It was essential so
that we could afterwards compare our results to the
results obtained from the previous annotations based
on different methods.
Table 1: Bacterial genomes grouped by annotation
method.
Annotation
methods
Number of
genomes
Group ID
NCBI, UniProt,
TIGRFam, Pfam,
PRIAM, KEGG,
COG, InterPro,
IMG-ER
38 GRP_1
BLAST,
homology
28 GRP_2
GenDB, BLAST,
COG, COGnitor
7 GRP_3
InterPro(Scan) 5 GRP_4
Total 104 GRP_ALL
The system presents the predicted function as a
set of GeneOntology terms. Let’s see what the GO
terms are in more detail. Each term may belong to
one of the three domains: cellular component (C),
molecular function (F), and biological process (P).
Hence, every function may be presented as a set of
terms from these domains, though not necessarily
from all three of them at once. It is worth noting that
GO terms in each domain are structured as a tree,
where each term is a leaf or an internal vertex.
We were mostly interested in molecular
functions of genes, therefore in this study we will
only cover results for terms of this type (F);
however, similar results were obtained for every
BIOINFORMATICS2015-InternationalConferenceonBioinformaticsModels,MethodsandAlgorithms
138
type (C, F, P) separately and for the combination of
all three together. To compare sets of terms, we used
two approaches: perfect match, when all the terms
should match for the sets to be equal, and fuzzy
match, when the sets are considered equal if at least
one pair of terms match one another.
By the known function we will mean the
previously annotated function, and by the predicted
function, the one obtained in this study. To define
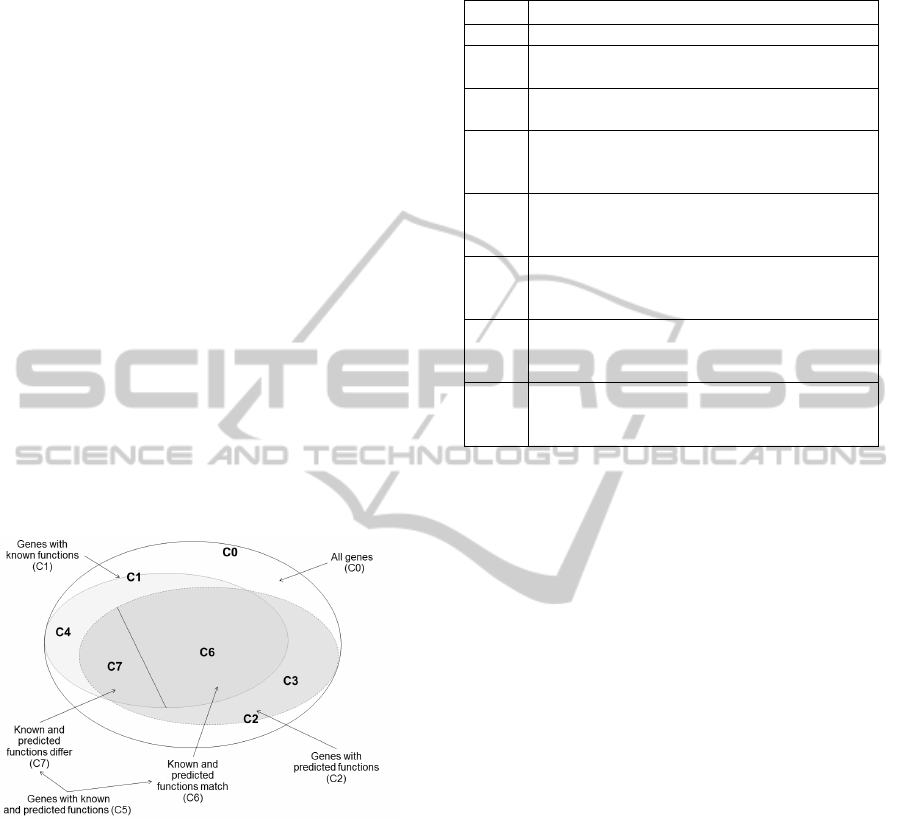
the system characteristics, we introduced subsets,
which are displayed in Figure 2 and described in
detail in Table 2. Since the annotation results are
presented as a list of possible functions, we consider
the functions equal if the known function is found
within the first N most probable predicted functions.
The list was arranged by probability P (see Equation
2 below); for this study we take N=5.
To evaluate the precision of predictions, we split
the C5 set into two subsets. Let the C6 set be a
subset of genes for which the known function was
found within the top five (N=5) predicted functions.
Therefore, C7=C5−C6 is a subset of those genes
from C5 for which the known function differs from
the predicted function (the known function was not
found within the top five predicted functions).
Figure 2: Subsets of genes under study.
In Table 2, we would like to highlight the two
sets and two subsets of genes which are essential for
estimating the quality characteristics of our
annotation system in comparison with the
annotations that have been made previously. These
are sets C3 and C4, and subsets C6 and C7. The C3
set contains the genes that have predicted functions,
but no known functions. The C4 set contains the
genes that have known functions, but no predicted
functions. The C6 and C7 subsets were defined in
the previous paragraph.
Table 2: Subsets of genes used to compare the current and
previous annotations.
Name Description
С0 All genes under study
С1
The subset of genes from the С0 set that have
known functions
С2
The subset of genes from the С0 set that have
predicted functions
С3
The subset of genes from the C2 set that have
predicted functions, but no known functions. С3
= С2 − С1
С4
The subset of genes from the C1 set that have
known functions, but no predicted functions.
C4= С1 − С2
С5
The subset of genes from the C0 set that have
both known and predicted functions. C5 = C1 ∩
C2
С6
The subset of genes from the C5 set for which
the known function was found within the top
five predicted functions.
С7
The subset of genes from the C5 set for which
the known function was not found within the
top five predicted functions. C7 = С5 – С6
This section contains prediction results grouped
by method of their original annotation and by
method of comparison of their known function with
the predicted ones. In all tables we define the size of
the C
i
sets as N
i
. Tables 3 and 4 show the share of
various gene sets in the total number of genes: these
are the set of previously annotated genes, the set of
genes annotated with our system, as well as their
intersections and subsets. The obtained results can
be visualized with the diagram in Figure 3 (the
perfect match method of functions comparison is
used).
It is clear that the share of genes from the C3 set
varies from 16.9% to 21.4% and averages 19%
(Table 3). The share of genes from the C4 set varies
from 6.8% to 11.3% and averages 9%. To determine
the equality of known and predicted functions, we
used the two above-described ways, perfect match
and fuzzy match (Table 4). The share of genes from
the C6 set varies from 37.7% to 44.4% and averages
40% (Table 4). The share of genes from the C7 set
varies from 3.8% to 8.5% and averages 7%. As you
can see from Table 4, these results vary slightly
depending on the comparison approach (perfect
match or fuzzy match). The major difference
between the known and predicted functions (i. e. the
maximum ratio of N7/N6) is observed for the group
of genes defined in Table 1 as GRP_4.
ComputerAnnotationofNucleicAcidSequencesinBacterialGenomesUsingPhylogeneticProfiles
139
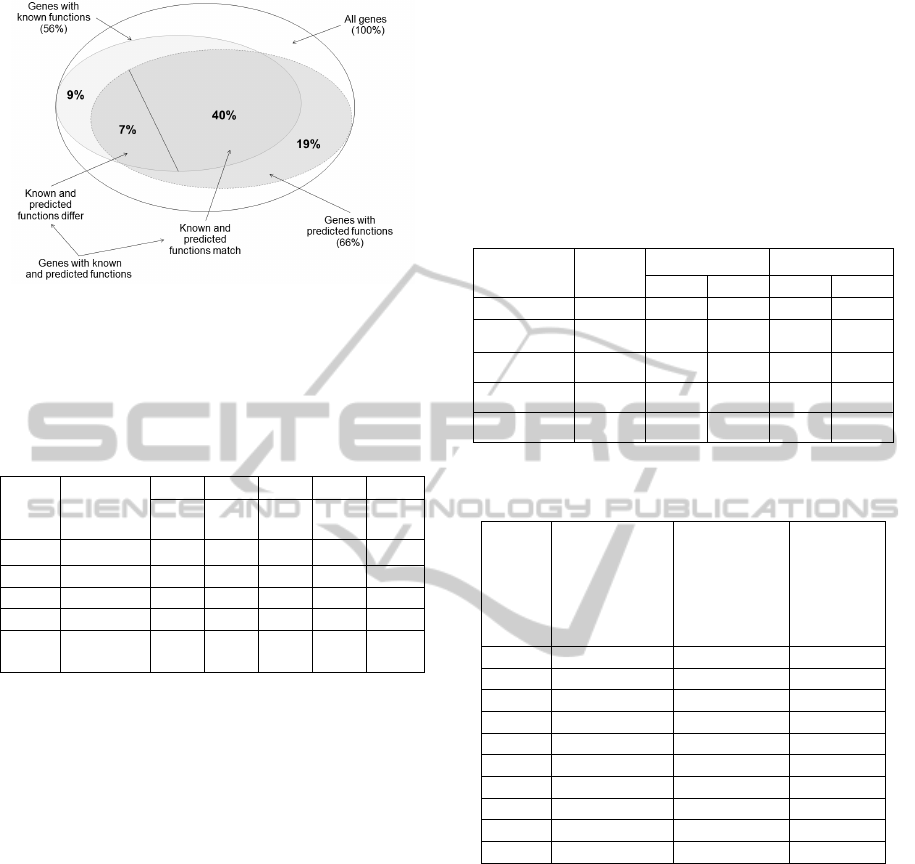
Figure 3: Visualization of annotation results.
Table 3: Shares of C1–C5 subsets in the total number of
genes (N0). N1/N0 is the share of genes from the С1 set;
N2/N0 is the share of genes from the С2 set; N3/N0 is the
share of genes from the С3 set; N4/N0 is the share of
genes from the С4 set; N5/N0 is the share of genes from
the С5 set.
Group
ID
N0
(number of
genes)
N1N0 N2/N0 N3/N0 N4/N0N5/N0
С1 С2 С3 С4 С5
GRP_1 144157 0.551 0.613 0.169 0.113 0.444
GRP_2 82170 0.573 0.668 0.186 0.091 0.482
GRP_3 24657 0.568 0.714 0.214 0.068 0.500
GRP_4 20592 0.549 0.663 0.194 0.080 0.469
GRP_
ALL
375151 0.563 0.658 0.186 0.091 0.472
It is also interesting to estimate the precision of
predictions for the top one (N=1) function of the
genes from the C3 set. For this purpose we analyzed
the genes from the C5 set (which consists of the
genes that have both known and predicted functions)
and found for each gene the minimum size of the
predicted functions list so that it contained the
known function. This dependence in terms of
percentage points is presented in Table 5. The size
of the C5 set is designated as 100%; each row shows
the share of each place in the list where the known
function was found. As can be seen from Table 5,
the known function was found on the top of the
predicted functions list in 63% of the time and in
Positions 2 to 5 in 23% of the time; 13% of cases
accrued to Position 6 and higher. These results show
that when we use the most probable predicted
function, the precision to predict the known function
is 63%. Therefore, we can conclude that precision
for genes from the C3 set may be the same.
These results also justify the choice of N=5 for
comparing the biological functions for the C5 set
genes (C6+C7). As you can see from Table 5, the
share of exactly predicted functions stops increasing
notably at N=3 and reaches saturation at N=5.
Table 4: Comparison of original and predicted functions.
N5/N0 is the share of genes from the С5 set (these genes
have both known and predicted functions), N6/N0 is the
share of genes from the С7 set (genes from C5 for which
the known function and the predicted function are equal),
N7/N0 is the share of genes from the С7 set (genes from
C5 for which the known function differs from the
predicted function).
Group ID N5/N0
Perfect match Fuzzy match
С6 С7 С6 С7
GRP_1 0.444 0.377 0.067 0.401 0.043
GRP_2 0.482 0.420 0.062 0.444 0.038
GRP_3 0.500 0.432 0.068 0.460 0.040
GRP_4 0.469 0.384 0.085 0.419 0.050
GRP_ALL 0.472 0.407 0.065 0.432 0.040
Table 5: Distribution of places in the list of predicted
functions where know function was found.
Position
of the
known
function
in the
list
Cumulative
percentage of
genes
Percentage of
genes
Number of
genes
1 63.23 63.23 108806
2 77.12 13.89 23894
3 82.06 4.94 8498
4 84.64 2.58 4446
5 86.23 1.59 2743
6 87.36 1.13 1949
7 88.19 0.83 1433
8 88.84 0.65 1127
9 89.40 0.56 962
10 89.87 0.47 783
The results of annotations for genes under study can
be freely accessed at
http://genefunction.ru/public_results/ .
3 DISCUSSION
First of all, it is interesting to consider the genes for
which functions predicted in our study differ from
the known functions. They fall into the subset of
genes which we defined as C7 in Table 2 and Figure
2. The share of this set is 7% from the total number
of the genes under study (Figure 3). The difference
can be explained by the fixed size of the top
predicted functions for each gene. To compare them
with the known functions we use the top five
BIOINFORMATICS2015-InternationalConferenceonBioinformaticsModels,MethodsandAlgorithms
140

predicted functions sorted by probability P. As you
can see from Table 5, a known function was found
within the top five predicted functions for 86% of
the genes. For 14% the five best predicted
candidates did not contain an already known
function. This may occur in three cases. Firstly, the
genes may be involved in several metabolic
pathways with different functions (i. e. functions of
the gene in these pathways are different). If one of
these metabolic pathways is more widespread in
genomes under study, than the others, the function
of the gene in this pathway may be predicted as
more probable, thus the previously predicted
(known) function may not be found among the top
five predicted functions. Secondly, the gene may
have a mutated copy (paralog), which takes part in a
different genetic process. Such paralog may
participate in a metabolic process that can be found
in a greater number of reference bacterial genomes
than the metabolic process in which the original
gene we study participates. Thirdly, there might be
an mistake made in previous annotations, but the
probability of that to happen is very small, which
may be explained by the high level of similarity
between sequences in the previous annotations.
It is also interesting to consider the C4 set which
contains genes for which no predicted functions
were found in the present work. The share of such
genes is 9% of the total number of analyzed genes.
There are two reasons to explain the absence of
predicted functions for these genes. The first is that
the search for similarities in this work was
performed by comparing the nucleotide sequences
rather than the amino acid sequences. Some
significant similarities of the amino acid sequences
may appear insignificant on the nucleotide level, and
their statistical value will be below the threshold
level. Secondly, this may be explained by the
specific feature of the approach: to create a group of
related genes it is necessary to find similar vectors
with a sufficient number of 1, i. e. the gene must be
found in sufficient number of different genomes. In
most cases when a group cannot be created, it is
because of few "1" in the profile of the gene rather
than due to the absence of similar vectors.
The most successful result of our work is the C3
subset of genes for which there were no previously
predicted functions before our study; the share of
this set is 19% of all genes that have been examined
in the present work. The fact that these functions
have never been predicted before can be explained
by the difference of approaches. The vast majority of
the existing annotation methods identifying
orthologs use amino acid sequences with the
sufficiently high level of similarity only, which
allows to predict the equality of their biological
functions with great probability: the higher the
similarity, the stronger the indication that these
sequences are exact orthologs. When the similarity
level is lower (though still statistically significant),
more potential homologs can be found: the greater
part of them are paralogs (mutated copies with
unrelated functions), but it is entirely possible that
orthologs may also be found among these
similarities. To separate one from another, some
additional information must be used. In this work,
such information is the similarity of phylogenetic
profiles. The similarity between the profiles will be
significant for orthologs and either missing or
statistically less significant for paralogs. Therefore,
this additional filtering by phylogenetic profiles
allows us to sort out paralogs and to predict
biological functions for genes using the similarities
not accounted by the existing annotation methods.
We also increased the number of significant
similarities by using several cycles of local
alignments search with different parameters,
including the purine-pyrimidine weight matrix for
global alignment. Besides, we compared each gene
with whole bacterial genomes rather than with sets
of previously selected genes from these genomes. It
allowed us to avoid errors during structural
annotations, i. e. when identifying the gene
sequences in the bacterial genomes. To sum it all up,
our success in annotating new genes is based on the
phylogenetic profiles comparison method, which
allowed us to find additional orthologs among a
great number of paralogs.
Let us also estimate the precision of biological
function predictions for genes from the C3 set. For
this estimation, we use as the prediction result the
first function in the list sorted by probability P. As
you can see in Table 5, the predicted biological
functions of 63% of all genes examined in the
present work coincide with known functions. It can
be expected that the precision of predictions for the
C3 genes will be the same (about 63%). The
obtained results looks reasonably better in
comparison to the similar studies; for instance, in a
previous study for the E.coli genome the known
function was found on the top of the predicted
functions list in 43% of the time and within the top
ten in 60% of the time; and for the S.cerevisiae
genome the known function was found within the
top fifty predicted functions in 60% of the time
(Kharchenko et al. 2006). However, in our study the
known function was on average found within the top
five predicted functions in 86% of the time.
ComputerAnnotationofNucleicAcidSequencesinBacterialGenomesUsingPhylogeneticProfiles
141

Although the developed system doesn’t make
exact predictions of gene functions (the precision is
about 63%, see Table 5), it may be used as an
alternative or complementation to the existing
annotation systems: the existing systems predict
functions for genes from sets C4 and C5, and our
system covers functions for genes from sets C3 and
C5. Therefore, the use of our system can increase the
share of annotated bacterial genes by 19% (by the
size of the C3 set).
63% predictions of gene functions was received
for P
0
=10
-7
and Z=5.0 (see 2.1). P
0
and Z
was chosen
with a large margin. It is possible to define an upper
limit for the number of false positives in C2 set. For
this purpose we can use the number of profiles
which have at least one "1" received for mixed genes
(see 2.1). The number of these profiles was 0.4 %
and other profiles contain only zeros. Profiles with
zeros have P>P
0
and automatically eliminated from
our consideration. But 39 “random genes” which
have at least one "1" received profiles with P < P
0
. It
means that less than 0.01% is upper limit of false
positives for N2 (C2 set). Thus, false positives have
a small effect on our results.
REFERENCES
Ali, H., 2004. A hidden markov model for gene function
prediction from sequential expression data.
Proceedings. 2004 IEEE Computational Systems
Bioinformatics Conference, 2004. CSB 2004., (Csb),
pp.639–640.
Altschul, S. F. et al., 1990. Basic local alignment search
tool. Journal of molecular biology, 215(3), pp.403–
410.
Altschul, S. F. et al., 1997. Gapped BLAST and PSI-
BLAST: a new generation of protein database search
programs. Nucleic Acids Research, 25(17), pp.3389–
3402. Available at: http://
www.pubmedcentral.nih.gov/articlerender.fcgi?artid=
146917&tool=pmcentrez&rendertype=abstract.
Ashburner, M. et al., 2000. Gene ontology: tool for the
unification of biology. The Gene Ontology
Consortium. Nature genetics, 25(1), pp.25–9.
Aziz, R. K. et al., 2008. The RAST Server: rapid
annotations using subsystems technology. BMC
genomics, 9, p.75.
Bairoch, A. & Apweiler, R., 1999. The SWISS-PROT
protein sequence data bank and its supplement
TrEMBL in 1999. Nucleic Acids Research, 27(1),
pp.49–54.
Benson, D. A. et al., 2013. GenBank. Nucleic acids
research, 41(Database issue), pp.D36–42.
Date, S. V & Marcotte, E. M., 2003. Discovery of
uncharacterized cellular systems by genome-wide
analysis of functional linkages. Nature biotechnology,
21(9), pp.1055–62.
Eisen, J. A., 1998. Phylogenomics: Improving Functional
Predictions for Uncharacterized Genes by
Evolutionary Analysis. Genome Research, 8(3),
pp.163–167.
Eisenhaber, F., 2012. A decade after the first full human
genome sequencing: when will we understand our own
genome? Journal of bioinformatics and computational
biology, 10(5), p.1271001.
Feller, W., 1968. An Introduction to Probability Theory
and Its Applications,
Finn, R. D. et al., 2010. The Pfam protein families
database. Nucleic Acids Research, 38, pp.D211–D222.
Friedberg, I., 2006. Automated protein function
prediction--the genomic challenge. Briefings in
bioinformatics, 7(3), pp.225–42.
Galperin, M. Y. & Koonin, E. V, 2010. From complete
genome sequence to “complete” understanding?
Trends in biotechnology, 28, pp.398–406.
Gaasterland, T. & Ragan, M. A., 1998. Constructing the
multigenome viewes of whole microbial genomes.
Microbial & Comparative Genomics 3, pp. 177-192.
Haft, D. H., 2003. The TIGRFAMs database of protein
families. Nucleic Acids Research, 31(1), pp.371–373.
Hunter, S. et al., 2012. InterPro in 2011: new
developments in the family and domain prediction
database. Nucleic acids research, 40, pp.D306–12.
Janitz, M., 2007. Assigning functions to genes — the main
challenge of the post-genomics era. Biochemical
Pharmacology, 159, pp.115 –129.
Jothi, R., Przytycka, T. M. & Aravind, L., 2007.
Discovering functional linkages and uncharacterized
cellular pathways using phylogenetic profile
comparisons: a comprehensive assessment. BMC
bioinformatics, 8, p.173.
Kanehisa, M. et al., 2004. The KEGG resource for
deciphering the genome. Nucleic acids research,
32(Database issue), pp.D277–80.
Kensche, P. R. et al., 2008. Practical and theoretical
advances in predicting the function of a protein by its
phylogenetic distribution. Journal of the Royal
Society, Interface / the Royal Society, 5(19), pp.151–
70.
Kharchenko, P. et al., 2006. Identifying metabolic
enzymes with multiple types of association evidence.
BMC bioinformatics, 7, p.177.
Markowitz, V. M. et al., 2012. IMG: the Integrated
Microbial Genomes database and comparative analysis
system. Nucleic acids research, 40(Database issue),
pp.D115–22.
Meyer, F. et al., 2003. GenDB--an open source genome
annotation system for prokaryote genomes. Nucleic
acids research, 31(8), pp.2187–95.
Needleman, S. B. & Wunsch, C. D., 1970. A general
method applicable to the search for similarities in the
amino acid sequence of two proteins. Journal of
Molecular Biology, 48, pp.443–453.
Pandit, S. B., Balaji, S. & Srinivasan, N., 2004. Structural
and functional characterization of gene products
BIOINFORMATICS2015-InternationalConferenceonBioinformaticsModels,MethodsandAlgorithms
142

encoded in the human genome by homology detection.
IUBMB life, 56(6), pp.317–31.
Pearson, W. R. & Lipman, D. J., 1988. Improved tools for
biological sequence comparison. Proceedings of the
National Academy of Sciences of the United States of
America, 85(8), pp.2444–8.
Pellegrini, M. et al., 1999. Assigning protein functions by
comparative genome analysis: protein phylogenetic
profiles. Proceedings of the National Academy of
Sciences of the United States of America, 96(8),
pp.4285–8.
Pellegrini, M., 2012. Using phylogenetic profiles to
predict functional relationships J. Helden, A.
Toussaint, & D. Thieffry, eds. Methods in Molecular
Biology, 804, pp.167–177.
Pruitt, K. D., Tatusova, T. & Maglott, D. R., 2005. NCBI
Reference Sequence (RefSeq): a curated non-
redundant sequence database of genomes, transcripts
and proteins. Nucleic acids research, 33(Database
issue), pp.D501–4.
Quevillon, E. et al., 2005. InterProScan: protein domains
identifier. Nucleic Acids Research, 33, pp.W116–
W120.
Raeside, D. E., 1976. Monte Carlo principles and
applications. Physics in Medicine and Biology, 21,
pp.181–197.
Rastogi, S. C., Mendiratta, N. & Rastogi, P., 2006.
Bioinformatics Methods and Applications: Genomics,
Proteomics and Drug Discovery, PHI Learning Pvt.
Ltd.
Richardson, E. J. & Watson, M., 2013. The automatic
annotation of bacterial genomes. Briefings in
bioinformatics, 14(1), pp.1–12.
Saghatelian, A. & Cravatt, B. F., 2005. Assignment of
protein function in the postgenomic era. Nature
chemical biology, 1(3), pp.130–42.
Shuster, J. J., 2005. Hypergeometric Distribution. In
Encyclopedia of Biostatistics.
Smith, T. F. & Waterman, M. S., 1981. Identification of
common molecular subsequences. Journal of
Molecular Biology, 147, pp.195–197.
Tanenbaum, D. M. et al., 2010. The JCVI standard
operating procedure for annotating prokaryotic
metagenomic shotgun sequencing data. Standards in
genomic sciences, 2(2), pp.229–37.
Tatusov, R. L. et al., 2000. The COG database: a tool for
genome-scale analysis of protein functions and
evolution. Nucleic acids research, 28, pp.33–36.
The UniProt Consortium, 2011. Ongoing and future
developments at the Universal Protein Resource.
Nucleic acids research, 39(Database issue), pp.D214–
9.
Weiller, G. F., 1998. Phylogenetic Profiles : A Graphical
Method for Detecting Genetic Recombinations in
Homologous Sequences. Molecular Biology and
Evolution, 15, pp.326–335.
ComputerAnnotationofNucleicAcidSequencesinBacterialGenomesUsingPhylogeneticProfiles
143
