
Improving Physiological Signal Classification Using Logarithmic
Quantization and a Progressive Calibration Technique
Nick Merrill
1
, Thomas Maillart
1
, Benjamin Johnson
2
and John Chuang
1
1
School of Information, UC Berkeley, Berkeley, California, U.S.A.
2
Cylab, Carnegie Mellon University, Pittsburgh, Pennsylvania U.S.A.
Keywords:
Bio-signal Processing, Signal Quantization, Logarithmic Binning, Calibration, Mobile Physiological Com-
puting.
Abstract:
This paper exhibits two methods for decreasing the time associated with training a machine learning classifier
on biometric signals. Using electroencephalography (EEG) data obtained from a consumer-grade headset with
a single electrode, we show that these methods produce significant gains in the computational performance
and calibration time of a simple brain-computer interface (BCI) without significantly decreasing accuracy. We
discuss the relevance of reduced feature vector size to the design of physiological computing applications.
1 INTRODUCTION
Bio-signals vary widely between individuals, and
their expression often changes within individuals over
time. Typically, brain computer interfaces (BCI)
serve as an excellent example of this phenomenon.
Regular calibration and re-calibration are critical to
achieving decent BCI accuracy (Dornhege, 2007; Mc-
Farland and Wolpaw, 2011).
Supervised learning algorithms have assisted sys-
tems in adapting to users’ personal physiology af-
ter a calibration period. In BCI, this approach has
yielded proof-of-concept systems ranging from brain-
controlled keyboards and wheelchairs to prosthetic
arms and hands (Blankertz et al., 2007; Millan et al.,
2010; D. Mattia, 2011; Hill et al., 2014; Campbell
et al., 2010).
However, in order to move BCI into broader con-
sumer markets, systems must work with more mo-
bile sensing equipment and wearable computing plat-
forms. Mobile device architectures limit computa-
tional complexity relative to lab-based systems, and
ergonomic considerations limit the number and qual-
ity of sensors on the device.
In this study, we simulate a simple brain-computer
interface using signals acquired from a low-cost, mo-
bile electroencephalograph (EEG) device with a sin-
gle electrode. Using a BCI that takes mental gestures
as input, we investigate how the processing of bio-
signals and the strategy for user calibration can im-
pact the computational performance, reliability and
calibration time of a bio-signal classification system.
First, we present a novel signal quantization tech-
nique in which we apply logarithmic binning to power
spectrum data from an EEG electrode. We find that
this technique can speed up the computational perfor-
mance of a classification-based BCI by 450% without
significant detriment to the system’s accuracy.
Second, we combine this technique with a pro-
gressive user calibration strategy, in which candidate
mental gestures are tested in an order designed to min-
imize calibration time. We calibrate 86.6% of users to
a threshold of BCI literacy (75% accuracy) (Vidaurre
and Blankertz, 2010) with under five minutes of train-
ing data, and 100% of users within half an hour.
This paper is organized as follows. We intro-
duce relevant background research in Section 2. We
present the power spectrum quantization method in
Section 3, and the data used for calibration in Section
4. We then evaluate the quantization method (Section
5), and we present a time-efficient calibration strategy
for our BCI apparatus (Section 6). We conclude with
limitations and future research directions.
2 RELATED WORK
2.1 Calibrating EEG-based BCI
Generally, BCI systems aim to recognize a user’s
mental gestures as one of a finite set of discrete sym-
44
Merrill N., Maillart T., Johnson B. and Chuang J..
Improving Physiological Signal Classification Using Logarithmic Quantization and a Progressive Calibration Technique.
DOI: 10.5220/0005238800440051
In Proceedings of the 2nd International Conference on Physiological Computing Systems (PhyCS-2015), pages 44-51
ISBN: 978-989-758-085-7
Copyright
c
2015 SCITEPRESS (Science and Technology Publications, Lda.)

bols, a problem that can be framed as a pattern recog-
nition task (Lotte et al., 2007). The difficulty of
this task stems primarily from the variable and non-
stationary nature of neural signals: the symbols are
expressed differently between individuals, and even
vary within individuals based on mood, stress, and
other factors (Vidaurre et al., 2011).
In order to compensate for variability in BCI sig-
nals, recent work has leveraged adaptive classification
algorithms to distinguish between mental gestures
(Lotte et al., 2007; Vidaurre et al., 2011; Friedrich
et al., 2013). Automated calibration procedures have
turned BCI novices into competent users over the
course of hours instead of days or weeks, and with-
out manual calibration (Vidaurre et al., 2011). During
calibration, users perform labeled (i.e. known) mental
gestures in order to produce samples for the classifier.
2.2 Statistical Signal Processing in
EEG-based BCI
To account for the nonstationarity of EEG signals and
the need for regular calibration, recent work has lever-
aged machine learning algorithms capable of adapting
to their inputs. Support vector machines (SVM) are a
set of supervised machine learning methods that take
labeled example data to create a model. This model
can be used to predict the classes of unlabeled data.
SVMs use a hyperplane (an n-dimensional construct
in an n+1 dimensional space) to draw discriminatory
boundaries between classes.
Past work has used linear SVMs in BCI appli-
cations (Garrett et al., 2003; Grierson and Kiefer,
2011). SVMs select the hyperplane that maximizes
distance from the nearest training points, which has
been shown to increase the model’s generalizability
(Burges, 1998).
SVMs suffer from a property known as “the curse
of dimensionality”: larger feature vectors require an
exponential increase in the amount of data needed to
describe classes (Jain et al., 2000). Traditionally, BCI
applications rely on dense, high-dimensional feature
vectors produced by multi-electrode scanning caps
with high temporal resolution (Lotte et al., 2007),
which threatens the responsiveness of BCI from a user
experience standpoint and places high requirements
on end-user hardware.
2.3 Brain-Computer Interface “In the
Wild”
Recent years have seen the emergence of a consumer
market for inexpensive, mobile EEG devices. Com-
pared to medical-grade scanning devices, these head-
sets have significantly fewer electrodes and there-
fore much lower spatial resolution. Most of them
employ dry contact electrodes, which produce nois-
ier signals (De Vos and Debener, 2014). Nonethe-
less, researchers have demonstrated several mobile-
ready BCI systems that use these devices to detect
emotional states, event-related potentials (ERP), and
demonstrate the feasibility of brainwave-based bio-
metric authentication (Crowley et al., 2010; Grierson
and Kiefer, 2011; Chuang et al., 2013; Johnson et al.,
2014).
However, the use of consumer EEGs for the direct,
real-time control of software interfaces has proven
more difficult, as the number of electrodes on these
headsets limit the spatial resolution required to dis-
criminate between mental gestures (Carrino et al.,
2012; Larsen and Hokl, 2011). Even with improve-
ments over successive generations of consumer-grade
EEG devices, the signal from these devices will re-
main noisier than professional scanning devices, as
users will be wearing and using them in everyday set-
tings, with ambient electromagnetic signals interfer-
ing with endogenous bio-signals.
3 SIGNAL QUANTIZATION FOR
RAPID CLASSIFICATION
Our objective is to maximize the accuracy of the clas-
sifier while minimizing its computational expense.
One way to reduce the computational requirements of
a classifier is to reduce the size of the feature vec-
tors on which it is trained and tested. We propose a
signal quantization method that allows us to directly
adjust the size of feature vectors. Since vector size di-
rectly impacts the runtime of the classifier, this tech-
nique operationalizes the tradeoff between computa-
tional speed and accuracy.
We average the power spectrum time series in the
temporal dimension and compute a discrete probabil-
ity density function (pdf) from the resulting power
spectrum in which each component is the mean of its
corresponding frequency components through time.
This results in a discrete pdf with 1024 components
for each trial, which can be quantized as described in
the following section.
3.1 Logarithmic Binning
Since EEG activity is associated with frequencies
from 1-40Hz, it is generally presumed that this range
contains the majority of relevant signal. However, this
frequency range can be polluted with non-neural sig-
nals (Ball et al., 2009), and we do not rule out the pos-
ImprovingPhysiologicalSignalClassificationUsingLogarithmicQuantizationandaProgressiveCalibrationTechnique
45
sibility that useful signal exists outside this frequency
range as well. Muscular activity, for example, might
be correlated with mental gestures in some cases. In
order to exploit the entire frequency spectrum while
preserving our bias toward known sources of useful
signal, we select log-spaced data bins through the log-
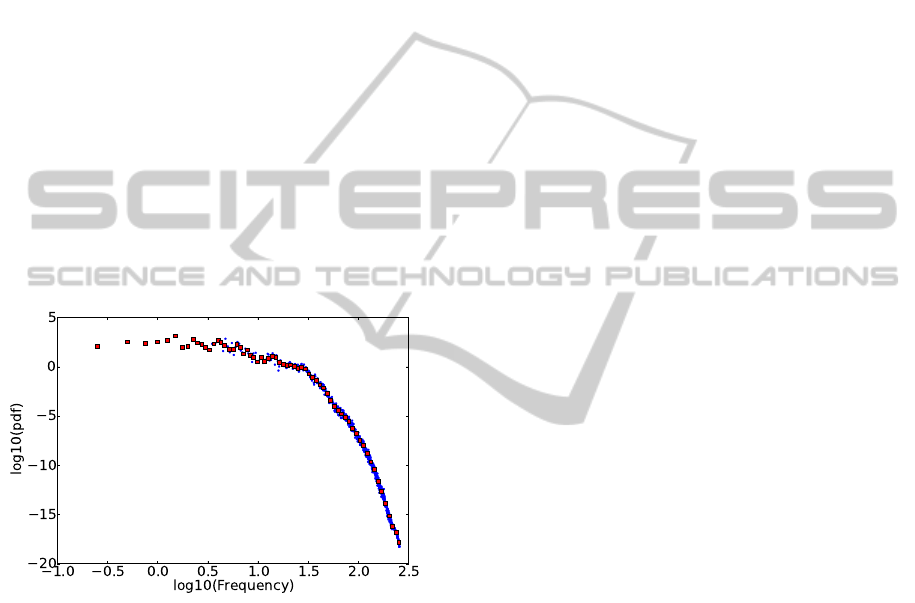
arithm of the frequency range. Figure 1 shows an ex-
ample of logarithmic binning with 65 bins. The origi-
nal, 1024-point pdf is compressed more than 10 times,
but its original structure is well-preserved.
Data binning offers a simple way to quantize the
information contained in the full signal. By taking
the mean of several adjacent points in the pdf, we are
left with a single bin that represents the local area of
spectrum. For example, four contiguous frequencies
(1Hz, 1.25Hz, 1.5Hz, 1.75Hz) of the values (4, 4, 5, 5)
average into a single bin with the value 4.5. The num-
ber of bins can be adjusted to produce feature vectors
of different sizes. This vector, which highlights the
statistical properties of the power spectrum for each
mental task, can be used as an input of variable size
to the classifier.
Figure 1: In double logarithmic scale, the original 1024
bins (blue) of the probability density function (pdf) obtained
from averaging the n power spectra of one recording, and
the quantized pdf with a resolution of 65 log-bins (red). The
quantized pdf preserves very well the structure of the origi-
nal, 1024-point pdf.
3.2 Binary BCI Classifier
Binary BCIs allow the user to select one of two op-
tions by thinking one of two predefined mental ges-
tures. Since any message can be expressed using bi-
nary selection (e.g. via morse code or binary), binary
BCIs allow a theoretically infinite expressive capacity
while minimizing the number of mental gestures the
user must calibrate.
To test the performance of the quantization
method, we build a binary BCI using a support vec-
tor machine (SVM) classifier, which we train indi-
vidually on each subject’s recordings while varying
the bin size. We use LinearSVC (Fan et al., 2008),
a wrapper for LibLinear exposed in Python through
the scikit-learn library (Pedregosa et al., 2011). We
chose LinearSVC because BCI classification prob-
lems are generally presumed to be linear (Garrett
et al., 2003; Lotte et al., 2007), and because LibLin-
ear’s underlying C implementation boasts among the
fastest train- and test-time performance among state-
of-the-art solutions (Fan et al., 2008). We use a hy-
perparameter of 100, found through a grid-search of
a randomly-selected sample of our dataset. We use
scikit-learn’s built-in cross-validation toolkit, which
performs seven cross-validation steps utilizing differ-
ent splits of data in each round.
Out of the seven mental gestures in the dataset, we
want to identify and select, for each individual sub-
ject, the two gestures (or classes) that we can most
reliably differentiate from one another. This results in
a personalized, binary classifier, where the SVM can
discriminate between two mental gestures performed
by the subject with the highest classification accuracy.
The gesture pairs may vary from subject to subject.
For example, one subject’s best-case pair may be song
and sport while another’s may be color and finger.
Subjects can then select one of two options by per-
forming one of the mental gestures in their gesture
pair.
4 DATA
We obtained an anonymized dataset of EEG record-
ings from 15 subjects, all students at UC Berkeley,
performing seven mental gestures in a sitting position
over two sessions (Chuang et al., 2013). The signals
were recorded using a consumer-grade EEG headset,
the Neurosky MindSet, with a dry contact EEG sen-
sor over the Fp1 position. The power spectrum time
series data were recorded using the Neuroview Soft-
ware. Participants performed each of the seven men-
tal gestures ten times. Each of the ten trials lasted ten
seconds. The seven mental gestures were: (i) breath-
ing with eyes closed; (ii) motor imagery of right in-
dex finger movement; (iii) motor imagery of subject’s
choice of repetitive sports motion; (iv) mentally sing
a song or recite a passage; (v) listen for an audio tone
with eyes closed; (vi) visual counting of rectangles
of a chosen color on a computer screen; and (vii)
any mental thought of subject’s choice (Chuang et al.,
2013).
The power spectrum time series data consists of
one power spectrum every 0.5 seconds. Therefore,
PhyCS2015-2ndInternationalConferenceonPhysiologicalComputingSystems
46
for a 10 second recording, we have a sequence of 20
power spectra. Each power spectrum contains fre-
quency components from 0 Hz to 256 Hz at 0.25Hz
intervals, so 1024 values are reported for each power
spectrum.
The dataset was further cleaned by removing all
readings marked as having suboptimal signal quality
by the Neuroview Software. The Neuroview Software
delivers a signal quality value that is greater than zero
when signal quality is suboptimal. Factors causing
this value to be greater than zero include lack of con-
tact between the electrode and skin, excessive non-
EEG noise (e.g., EKG, EMG, EOG, electrostatic),
and excessive motion.
At this point, each of the seven mental gesture
is represented by ten trials, each trial consisting of a
time series of 20 power spectra. 1024 frequency read-
ings comprise each power spectrum.
5 EFFECT OF QUANTIZATION
ON CLASSIFIER SPEED AND
ACCURACY
We hypothesize that both SVM training time and ac-
curacy increase with number of bins, i.e., the higher
the signal resolution, the higher the accuracy but the
longer the training time.
In order to make an optimal binary BCI for each
subject, we must find the two gestures that the SVM
distinguishes most reliably. For each subject, we gen-
erate every pair of two mental gestures and cross-
validate our SVM on the recordings for this pair.
Given seven candidate gestures, we have a total of 21
possible gesture pairs. For every pair processed, we
record mean classification accuracy across all rounds
of cross-validation. We record the best-performing
gesture pair for each subject, which yields the opti-
mal pair for the binary BCI.
We perform this process multiple times, varying
the signal resolution by varying the number of bins
from 1 to 1024. As an additional performance au-
dit, we measure the time needed to fit an SVM to the
data for two randomly selected gesture pairs across all
subjects. We repeat this process ten thousand times
at different resolutions, collecting the minimum time
observed in each series of attempts.
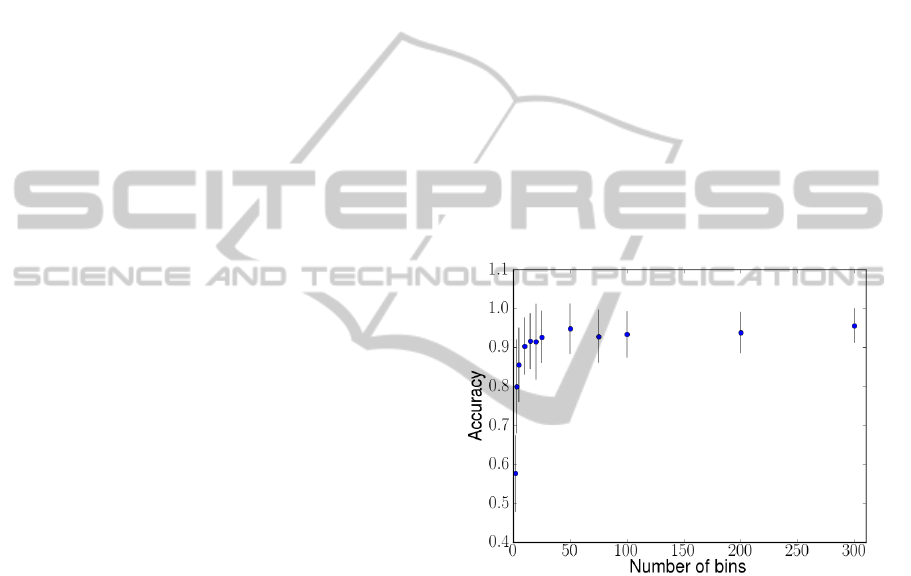
Figure 2 shows the mean best-case accuracy of the
classifier versus the number of bins. We can see that
the accuracy level remains above 90% even as we re-
duce the number of bins to 50. Although classifier ac-
curacy is positively correlated with signal resolution
(slope = 0.0013, R-squared = 0.773, p <0.001), this
effect appears only at resolutions lower than 50 bins.
We find no significant difference in SVM accuracy at
resolutions over 50 bins.
Figure 3 shows, in log-log scale, the SVM train-
ing time versus the number of bins. We see that the
log of the classifier training time is positively corre-
lated with the log of signal resolution (slope = 0.5,
R-squared = 0.947, p <0.001). We also observe an
increase in variance in the data, possibly due to vari-
ability in memory read and write times, which exac-
erbates SVM training time at larger vector sizes (as
more reads and writes are being performed).
Combining these two results, Figure 4 confirms
the tradeoff between classifier accuracy and classi-
fier training time. It also points to the existence of a
threshold resolution at around 50 bins that provides a
450% speed improvement over a non-quantized base-
line of 1024 bins without a significant detriment to
classifier accuracy.
Figure 2: Mean best-case accuracy among all subjects com-
pared to signal resolution. At resolutions of 50 points (bins)
and greater, we find no evidence of an increase in classifi-
cation accuracy.
Overall, we find that relatively small feature vec-
tors produced with our method (50 values) yield clas-
sifiers as accurate as full-resolution samples (1024
values), and that reducing vector size in this way can
dramatically increase computational speed.
6 PROGRESSIVE STRATEGY
FOR CALIBRATING A BINARY
BCI
In the previous section, we found that our compres-
sion technique can speed up an SVM classifier with-
out significant detriment to BCI accuracy. However, it
ImprovingPhysiologicalSignalClassificationUsingLogarithmicQuantizationandaProgressiveCalibrationTechnique
47
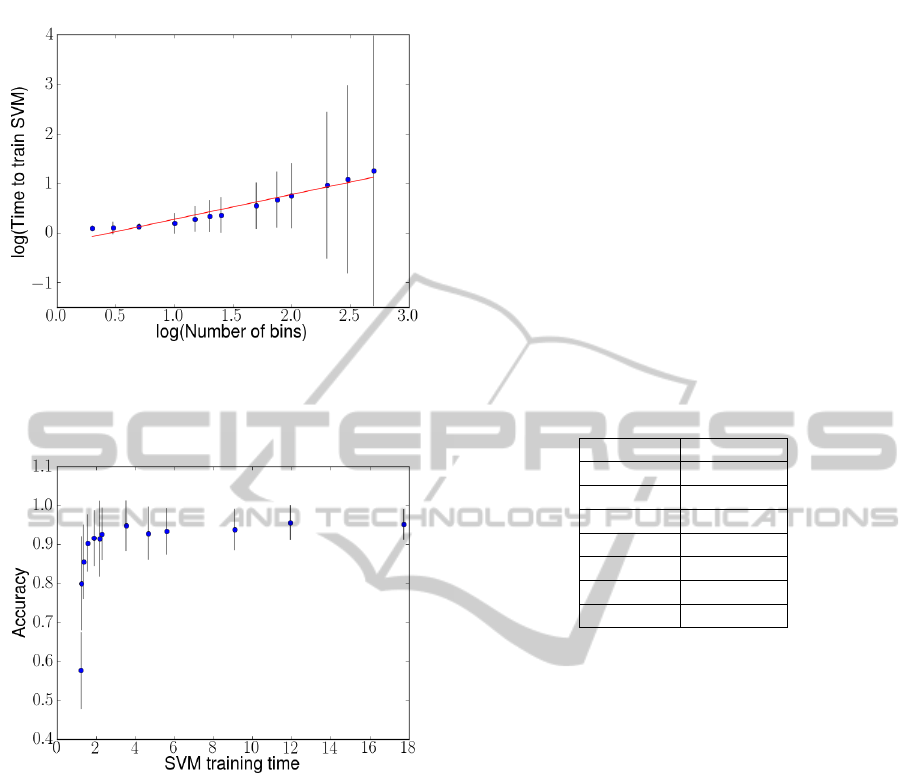
Figure 3: Log of mean classifier training time compared to
log of data resolution. The slope is 0.5, indicating that the
time needed to train the classifier increases at approximately
the square root of the signal resolution.
Figure 4: Best-case accuracy compared to the time needed
to train the classifier. By decreasing the number of bins in
the EEG data, we can decrease the time needed to train the
support vector machine up to nine times without without
significant detriment to classifier accuracy.
must also allow users to quickly calibrate the system
to their personal physiological signals.
In this section, we evaluate a strategy for user cal-
ibration in which mental gestures are recorded pro-
gressively on an as needed basis. Using quantized
signals with a resolution of 50 bins, we measure user
calibration time (the time it takes a user to achieve a
threshold accuracy with the BCI) and the classifica-
tion accuracy each user achieves after calibration.
Our calibration strategy takes sixty-second sam-
ple recordings of mental gestures and splices them
into 120
1
/2-second chunks. By performing seven-
fold cross-validation on sample data from a pair of
mental gestures, we make an estimate of how eas-
ily discriminable these gestures are by our classifier.
With this technique, we only need to identify the most
promising (highest-performing) of candidate gesture
pairs for further testing
In addition, we seek to minimize the amount of
time users spend recording samples of mental ges-
tures. One way to minimize this time is to first test
the subset of gestures most likely to yield strong per-
formance. For each subject, we perform an exhaus-
tive search of the 21 best-performing gesture pairs and
record the frequency of each gesture’s occurrence in
a best-case pair (Table 1). Assuming that we can es-
tablish a consistent ordering of best-performing men-
tal gestures for a target population, we use this data
to inform the order in which our calibration strategy
prompts the user to perform gestures.
Table 1: Frequency of each mental gestures’s occurrence
in a pair that achieves highest classification accuracy for a
subject.
Gesture Frequency
color 10
breathing 5
pass 4
sport 3
finger 2
song 2
audio 2
The progressive strategy starts with three ges-
tures most commonly associated with best-case per-
formance (color, breathing, pass) for an initial user
calibration time of 180 seconds (60 seconds per ges-
ture). We then cross-validate every permutation of
two of these gestures (i.e. color versus breathing,
color versus pass, breathing versus pass). The ges-
ture pair with the highest mean score across cross-
validation rounds is selected for an additional testing
session, in which the remaining 80 seconds of record-
ings for both gestures are used to generate an estimate
of the classifier’s accuracy on new EEG signals.
If the score on this additional testing procedure is
below 75%, a commonly used threshold for BCI lit-
eracy (Vidaurre and Blankertz, 2010), the user will be
prompted to record sixty seconds of the next candi-
date mental gesture (e.g. sport). We repeat the above
process on unexplored pairs until a pair achieves over
75% accuracy on post-calibration data, or until all
combinations have been evaluated.
Figure 6 shows the results from a subject’s per-
spective. Out of 15 subjects, the progressive calibra-
tion strategy allowed 66.7% (10 subjects) to be cali-
brated in under 5 minutes, and 86.7% (13 subjects) in
under 6 minutes. The system calibrated the remaining
two subjects in 11 minutes and 22 minutes, respec-
tively. All 15 subjects achieved a minimum of 75%
PhyCS2015-2ndInternationalConferenceonPhysiologicalComputingSystems
48

Start
Record
samples for
first 3 gestures
(3 x 60 sec)
Cross-validate
gesture pairs
Test best pair
(2 x 40 sec)
Best pair ≥
75%
accuracy?
Done
Record
sample of
next mental
gesture (1
x 60 sec)
no
yes
Figure 5: Progressive calibration routine. We begin with
60 second recordings of the three best-performing gestures
(Table 1). We then perform seven-fold cross-validation on
each pair of gestures. The pair that scored highest on cross-
validation is selected for testing on an additional 80 seconds
of data, 40 from each gesture. If this test fails to reach 75%
accuracy, we prompt the user to record a 60 second sam-
ple of the next highest-scoring gesture and repeat the cross-
validation process on all new (unexplored) gesture pairs.
classification accuracy. Six subjects (40%) achieve
100% accuracy.
Our strategy calibrates users to BCI control signif-
icantly more quickly than an exhaustive search, and
we do not find a significant difference in per-user ac-
curacy between our progressive strategy and an ex-
haustive search.
7 CONCLUSION
In this study, we investigated the effect of a signal
quantization technique on the performance of a bi-
nary BCI that uses a single, low-cost EEG electrode
as input. We found that our technique allows for a
BCI that is computationally efficient at training time,
66.7 %
4.5 minutes
20.0 %
5.5 minutes
6.6 %
11 minutes
6.6 %
22 minutes
Figure 6: Calibration time across subjects. The vast major-
ity of subjects subjects achieve acceptable accuracy in 4.5
or 5.5 minutes. The remaining two subjects require 11 min-
utes and 22 minutes to calibrate, respectively.
which can achieve good simulated accuracy for all
subjects in our dataset, and boasts quick user calibra-
tion times. Specifically, we showed that our quantiza-
tion method decreases the computational expense of
EEG-based calibration (from 18 ms to 2 ms for SVM
training time) without a significant detriment to accu-
racy and, using quantized data, our progressive user
calibration strategy achieves an average of 88.3% ac-
curacy across all subjects. All subjects required under
25 minutes of calibration time, and the system cali-
brated to all but one of these subjects in 15 minutes or
fewer.
The conclusions to be drawn from this study are
limited in a few regards. First, calibration and classi-
fication are performed offline, so factors involving the
user interface (such as feedback) are not taken into ac-
count. We cannot be sure, for instance, that our find-
ings based on the splicing of 10-second-long recorded
data will persist when a system solicits recordings of
only a second or under. Furthermore, a few of the ges-
tures (e.g., the color labeled gesture) relied on exoge-
nous stimuli, which may be impractical in naturalistic
settings for ergonomic reasons.
Our study indicates that practical BCI can be
achieved with as few as one, inexpensive EEG sensor,
minimal processing power, and a only a few minutes
of user calibration. Future work could build usable,
online BCI systems to test this claim more rigorously
(e.g. on mobile computing platforms or in natural-
istic settings). Since many types of bio-signals can
be represented as time series of power spectra (e.g.,
electrocardiography, electromyography), future work
could also test our quantization technique on different
types of biometric signals.
ImprovingPhysiologicalSignalClassificationUsingLogarithmicQuantizationandaProgressiveCalibrationTechnique
49

Reducing the size of feature vectors in physio-
logical computing applications could confer numer-
ous benefits to application developers. Smaller fea-
ture vectors could enable quick, cloud-based process-
ing, reducing the computational load on the end-user
hardware. Small feature vectors also lower the bound-
aries to achieving continuous, pervasive recording.
By quantizing signals from physiological sensors, de-
velopers can collect large corpa of biometric data
without expensive, high-performance server configu-
rations, enabling large-scale observations on physio-
logical data.
ACKNOWLEDGEMENTS
This research was supported in part by the Na-
tional Science Foundation under award CCF-0424422
(TRUST) and the Swiss National Science Foundation
under award PA00P2-145368
REFERENCES
Ball, T., Kern, M., Mutschler, I., Aertsen, A., and Schulze-
Bonhage, A. (2009). Signal quality of simultaneously
recorded invasive and non-invasive eeg. Neuroimage,
46(3):708–716.
Blankertz, B., Krauledat, M., Dornhege, G., Williamson, J.,
Murray-Smith, R., and Mller, K.-R. (2007). A note on
brain actuated spelling with the berlin brain-computer
interface. In Stephanidis, C., editor, Universal Ac-
cess in Human-Computer Interaction. Ambient Inter-
action, number 4555 in Lecture Notes in Computer
Science, pages 759–768. Springer Berlin Heidelberg.
Burges, C. (1998). A tutorial on support vector machines
for pattern recognition. Data Mining and Knowledge
Discovery, 2(2):121–167.
Campbell, A., Choudhury, T., Hu, S., Lu, H., Mukerjee,
M. K., Rabbi, M., and Raizada, R. D. (2010). Neuro-
Phone: brain-mobile phone interface using a wireless
EEG headset. In Proceedings of the second ACM SIG-
COMM workshop on Networking, systems, and appli-
cations on mobile handhelds, page 38. ACM.
Carrino, F., Dumoulin, J., Mugellini, E., Khaled, O., and
Ingold, R. (2012). A self-paced BCI system to control
an electric wheelchair: Evaluation of a commercial,
low-cost EEG device. In Biosignals and Biorobotics
Conference (BRC), 2012 ISSNIP, pages 1–6.
Chuang, J., Nguyen, H., Wang, C., and Johnson, B. (2013).
I think, therefore i am: Usability and security of au-
thentication using brainwaves. In Adams, A., Brenner,
M., and Smith, M., editors, Financial Cryptography
and Data Security, volume 7862 of Lecture Notes in
Computer Science, pages 1–16. Springer Berlin Hei-
delberg.
Crowley, K., Sliney, A., Pitt, I., and Murphy, D. (2010).
Evaluating a brain-computer interface to categorise
human emotional response. In ICALT, page 276278.
D. Mattia, F. Pichiorri, M. M. R. R. (2011). Brain com-
puter interface for hand motor function restoration and
rehabilitation. In Towards Practical Brain Computer
Interfaces. Springer, Biological and Medical Physics,
Biomedical Engineering.
De Vos, M. and Debener, S. (2014). Mobile eeg: towards
brain activity monitoring during natural action and
cognition. International journal of psychophysiology:
official journal of the International Organization of
Psychophysiology, 91(1):1–2.
Dornhege, G. (2007). Toward Brain-computer Interfacing.
MIT Press.
Fan, R.-E., Chang, K.-W., Hsieh, C.-J., Wang, X.-R., and
Lin, C.-J. (2008). LIBLINEAR: a library for large lin-
ear classification. J. Mach. Learn. Res., 9:18711874.
Friedrich, E. V., Neuper, C., and Scherer, R. (2013). What-
ever works: A systematic user-centered training pro-
tocol to optimize brain-computer interfacing individ-
ually. PloS one, 8(9):e76214.
Garrett, D., Peterson, D., Anderson, C., and Thaut, M.
(2003). Comparison of linear, nonlinear, and feature
selection methods for eeg signal classification. IEEE
Transactions on Neural Systems and Rehabilitation
Engineering, 11(2):141–144.
Grierson, M. and Kiefer, C. (2011). Better brain interfacing
for the masses: progress in event-related potential de-
tection using commercial brain computer interfaces.
page 1681. ACM Press.
Hill, N. J., Ricci, E., Haider, S., McCane, L. M., Heck-
man, S., Wolpaw, J. R., and Vaughan, T. M. (2014). A
practical, intuitive braincomputer interface for com-
municating yes or no by listening. Journal of Neural
Engineering, 11(3):035003.
Jain, A. K., Duin, R. P. W., and Mao, J. (2000). Statis-
tical pattern recognition: A review. Pattern Analy-
sis and Machine Intelligence, IEEE Transactions on,
22(1):437.
Johnson, B., Maillart, T., and Chuang, J. (2014). My
thoughts are not your thoughts. In Proceedings of the
2014 ACM International Joint Conference on Perva-
sive and Ubiquitous Computing: Adjunct Publication,
UbiComp ’14 Adjunct, pages 1329–1338, New York,
NY, USA. ACM.
Larsen, E. A. and Hokl, C.-s. J. (2011). Classification of
EEG Signals in a Brain- Computer Interface System.
Lotte, F., Congedo, M., Lcuyer, A., Lamarche, F., Arnaldi,
B., et al. (2007). A review of classification algorithms
for EEG-based braincomputer interfaces. Journal of
neural engineering, 4.
McFarland, D. J. and Wolpaw, J. R. (2011). Brain-computer
interfaces for communication and control. Commun
ACM, 54(5):60–66.
Millan, J. D. R., Rupp, R., Muller-Putz, G. R., Murray-
Smith, R., Giugliemma, C., Tangermann, M., Vidau-
rre, C., Cincotti, F., Kubler, A., Leeb, R., Neuper,
C., Muller, K.-R., and Mattia, D. (2010). Combining
PhyCS2015-2ndInternationalConferenceonPhysiologicalComputingSystems
50

brain-computer interfaces and assistive technologies:
State-of-the-art and challenges. Front Neurosci, 4.
Pedregosa, F., Varoquaux, G., Gramfort, A., Michel, V.,
Thirion, B., Grisel, O., Blondel, M., Prettenhofer, P.,
Weiss, R., Dubourg, V., Vanderplas, J., Passos, A.,
Cournapeau, D., Brucher, M., Perrot, M., and Duch-
esnay, . (2011). Scikit-learn: Machine learning in
python. J. Mach. Learn. Res., 12:28252830.
Vidaurre, C. and Blankertz, B. (2010). Towards a cure for
BCI illiteracy. Brain topography, 23(2):194198.
Vidaurre, C., Sannelli, C., Mller, K.-R., and Blankertz, B.
(2011). Machine-learning-based coadaptive calibra-
tion for brain-computer interfaces. Neural Computa-
tion, 23(3):791–816.
ImprovingPhysiologicalSignalClassificationUsingLogarithmicQuantizationandaProgressiveCalibrationTechnique
51
