
The Palm Vein Graph
Feature Extraction and Matching
Arathi Arakala, Hao Hao, Stephen Davis and K. J. Horadam
School of Mathematical and Geospatial Sciences, RMIT University, Melbourne, Australia
Keywords:
Biometric Graph, Graph Matching, Authentication, Palm Vein.
Abstract:
We present a graphical representation for palm vein patterns for use as biometric identifiers. The palm vein
image captured from an infra red camera is converted into a spatial graph. After image enhancement and
binarisation, the palm vein features are extracted from the skeleton using a novel two stage spur removal
technique. The location of the features and the connections between them are used to define a Palm Vein
Graph. Palm vein graphs are compared using the Biometric Graph Matching (BGM) Algorithm. We propose
a graph registration algorithm that improves over existing state of the art algorithms for graph registration.
We introduce 10 graph topology-based measures for comparing palm vein graphs. Experiments are conducted
on a public palm vein database. One of the introduced measures, an edge-based similarity, gave a definite
improvement in matching accuracies over other published results on the same database, especially for samples
with only a small common overlap area due to displacement. In addition, when the edge-based measure was
combined with one of three other topological features, we demonstrate a further improvement in matching
accuracy.
1 INTRODUCTION
Palm vein biometrics refers to the use of the unique
vascular pattern in the human palm for authentication.
Palm veins have the following advantages shared with
most vascular biometrics:
1. Internal location, which makes it hard to to spoof
or covertly acquire from an individual.
2. In-built liveness detection in the capture process.
Palm-vein images are captured using infra-red (IR)
cameras. The palm vein images are created by the
property that infra red light is absorbed by the de-
oxygenated haemoglobin creating dark regions cor-
responding to the veins. The rest of the human tis-
sues and skin reflect the IR creating bright regions in
the image. This property ensures that a live subject is
available for biometric capture.
3. The capture is harmless and often contactless.
4. The capture process is non-intrusivewith respect to
an individual’s personal space and is therefore more
socially acceptable.
5. A very low failure to enrol (FTE) rate.
Palm vein has been identified as the easi-
est (Watanabe et al., 2005) vascular biometric to work
with as the palm area is free of hair and skin color
variations thereby reducing capture noise. Also the
palm vein pattern is very detailed and intricate and
coversa larger area than other vascular biometrics like
the dorsal vein, finger vein and wrist vein.
In this paper, we investigate the palm vein patterns
captured in the PUT database (Kabacinski and Kowal-
ski, 2011). The palm vein patterns are represented
as biometric graphs. Biometric graphs have been
used to represent fingerprints (Horadam et al., 2011),
retina patterns (Lajevardi et al., 2013) and dorsal hand
vein patterns (Lajevardi et al., 2014). The palm vein
graphs are compared using Biometric Graph Match-
ing (Lajevardi et al., 2013). The main contributions
of this work are:
1. A novel image feature extraction process that cre-
ates a palm vein graph representing the vascular struc-
ture.
2. An improved registration algorithm that enhances
the speed and registration accuracy compared to the
algorithm in (Lajevardi et al., 2014).
3. Graph-based distance measures that effectively
separate genuine and imposter comparisons of palm
vein patterns.
295
Arakala A., Hao H., Davis S. and Horadam K..
The Palm Vein Graph - Feature Extraction and Matching.
DOI: 10.5220/0005239102950303
In Proceedings of the 1st International Conference on Information Systems Security and Privacy (ICISSP-2015), pages 295-303
ISBN: 978-989-758-081-9
Copyright
c
2015 SCITEPRESS (Science and Technology Publications, Lda.)

2 IMAGE PREPROCESSING AND
GRAPH EXTRACTION
2.1 The Database
This research uses palm vein images captured by
researchers at the Poznan University of Technol-
ogy (PUT) (Kabacinski and Kowalski, 2011). The
database has vein pattern images from the left and
right palms of 50 individuals. Each individual gave
12 samples of each palm, totalling 24 samples. Each
set of 12 samples was acquired over 3 sessions
with 4 images each, at least one week apart. The
database was chosen for two main reasons - a large
number of samples per individual palm (12 images)
and 3 separate sessions, one week apart. Several
other databases exist in the literature (Kumar and
Prathyusha, 2009),(Shahin et al., 2007),(Wang et al.,
2007), but they all take samples within one session.
The across session comparison is valuable to under-
stand the natural variation that will occur in a practical
scenario where individuals leave after enrolment and
return after a period to be verified without remember-
ing the exact location of their hand at enrolment.
2.2 Image Processing and Feature
Extraction
The infra red capture process often generates noisy
images with low contrast between the vein pattern
and background. The challenges of feature extraction
in the PUT database include noise of wrinkles and
other skin features on the hand, non-uniform back-
ground brightness and palm displacement within and
across the sessions. In order to extract features from
the palm vein image, specific image processing steps
are required to enhance the vein pattern. We used
Discrete Fourier Transform based method, gradient-
based method and thresholding method (Kabacinski
and Kowalski, 2010; Wenxiong and Qiuxia, 2014;
Gaikwad and Narote, 2013) to extract the vein pat-
tern and found that they failed to provide the contin-
uous rich structure of palm vein in the PUT database.
This paper has modified and combined several noise
reduction and vein enhancement methods for the bet-
ter performance of palm vein graph extraction.
The automatic processing of graph feature extrac-
tion from palm vein images can be summarized in
the following steps - Image pre-processing and vein
enhancement; image binarisation; and skeleton and
graph feature extraction. It is important to identify
the Region of Interest (ROI) : the spatial region where
the vein patterns are most visible and useful. A well
defined ROI will enable a good registration between
compared palm vein graphs and will hence improve
overall processing time. However, the PUT database
has shown large displacements in captured images,
especially between the sessions. In fact, the region
in one image may only be partially present in another.
In addition, if the ROI is too small, it limits the num-
ber of features that can be extracted from the image.
This paper selects the entire captured image area as
the ROI. Then, 40 pixels inwards from the border was
masked to eliminate possible misidentification of the
vein.
Image pre-processing and vein enhancement aim
to remove the artifacts and increase the contrast be-
tween vein and background. The palm vein image
was first converted to greyscale. To avoid amplify-
ing the noise in the image, especially in homogeneous
areas, contrast-limited adaptive histogram equaliza-
tion (Zuiderveld, 1994) was applied on a small win-
dow (8x8 pixels) to make image contrast uniform at
different regions. The noise in the image was re-
duced using an anisotropic diffusion filter (Perona and
Malik, 1990). Linear anisotropic diffusion performs
image smoothing and restoration that minimizes the
noise without removing significant components of the
image. An example of the original image and vein-
enhanced image is shown in Figures 1(a) and 1(b).
Figure 1: This figure shows the stages that a palm vein im-
age goes through before feature extraction. (a) (top-left)
Original image; (b) (top-right) Palm vein enhanced image;
(c) (bottom-left) Image after binarisation; (d) (bottom right)
Skeleton extracted from binarised image.
The next step is image binarisation. Skeleton
extraction requires image binarization to distinguish
vessel and background. The process of binarization
was described previously in (Lajevardi et al., 2013).
Briefly, a family of 2D matched filters was used to
search for vessel segments along all possible direc-
tions in frequency domain. The maximum responses
over all possible orientations were calculated for each
ICISSP2015-1stInternationalConferenceonInformationSystemsSecurityandPrivacy
296
pixel position. A threshold was chosen based on em-
pirical observation that the veins occupy around 15%
of the pixels in the image. The image was binarised
using this optimum threshold. Then the binarised im-
age was morphologically dilated to connect broken
pixels. Isolated objects, in which the connected com-
ponents were less than 200 pixels in area, were re-
moved. A binarized image is shown in Figure 1(c).
The final step is skeleton and graph feature ex-
traction. The skeleton was extracted from the bi-
nary image by morphologically removing pixels on
the boundaries and keeping pixels connected, shown
in Figure 1(d). Graph features of vertices and edges
were then detected from the skeleton.
2.2.1 The Biometric Graph
The biometric graph is a spatial graph with features
in a biometric represented as vertices and the con-
nections between those features represented as edges.
Often the spatial coordinates of the features become
the spatial attributes of the corresponding vertices.
In a vascular biometric, the vein bifurcations and
crossovers represent the vertices and their locations in
the image represent their attributes. A pair of vertices
are connected by an edge if their features were linked
by a vein in the original vein pattern. The biometric
graph representation for retina (Lajevardi et al., 2013)
and handvein (Lajevardi et al., 2014) have been
shown to be extremely effective when compared to
other existing templates. Mathematically, a biometric
graph is represented as g = (V, E, µ, ν), where V
represents a set of vertices, E represents the set of
edges between the vertices, µ is the vertex labeling
function and ν is the edge labeling function. For the
palm vein graphs in this research, µ associates each
vertex with its unique two dimensional spatial coor-
dinate while ν associates each edge with attributes of
edge length and slope. The main advantages of using
a graphical representation is that it is concise and
modular. There are no limits to the vertex, edge or
graph attributes that can be added to the graph. Thus
additional features deemed important for representing
the biometric in the future can easily be added on the
existing graph representation as new attributes.
To obtain the palm vein graph after skeletonisa-
tion, a 3 by 3 window was applied on each pixel of the
skeleton to test if it was an end or a junction (crossing
point or branching point). All junction and end points
were marked as vertices of the graph. An edge is the
link between two vertices. Edges were detected by
neighborhood tracking along the skeleton. All possi-
ble branches were tracked from the junction vertex.
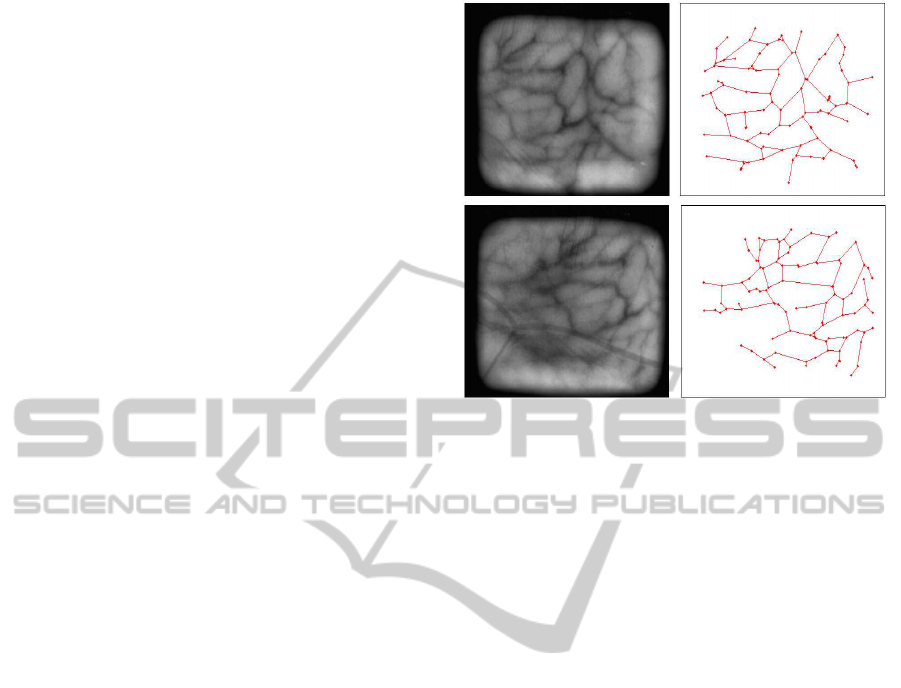
Palm vein graph features represent the vascular
Figure 2: This figure shows the extracted graph and the cor-
responding original image. Left figures are original images
and right figures are extracted graphs with features of ver-
tices (filled dots) and edges (line segments connecting a pair
of vertices). (a), the top panel and (b) the bottom panel,
show two palm vein images and corresponding graphs cap-
tured at different sessions from the same person. A large
displacement is noticeable between the two images.
pattern with limited vertices and edges. The undesir-
able spurs caused by noise and tiny veins have an im-
pact on the registration and matching process. There
were two stages to remove undesirable spurs. Firstly,
morphological operations were applied to remove un-
desirable short spurs on the skeleton. However, re-
moving spurs also reduces the vertices on the ma-
jor skeleton that may alter the shape of the skeleton.
Therefore, the threshold for morphologicaloperations
involved in defining short spurs was set to 10 pixels to
ensure correct representation of the vein shape. Sec-
ondly, there were a number of short to medium spurs
in the skeleton due to palm principle lines and wrin-
kles. These lines and wrinkles vary in the captured
images at different sessions. Palm principal lines and
wrinkles can be considered as part of the biometric
and are difficult to completely remove; our experi-
ments have shown that removing the short-medium
spurs improves the process of registration and match-
ing. The short-medium spurs were removed after the
detection of vertices and edges. We used the follow-
ing algorithm: 1) calculate the lengths of all branches.
2) identify the short-medium branches that are not
linked to the end vertices ( these branches should not
be removed) 3) the short-medium branches, that are
linked to end vertices and whose lengths are less than
40 pixels are removed. The connecting vertex was
kept to form the correct vein shape while the edge and
ThePalmVeinGraph-FeatureExtractionandMatching
297

Figure 3: Average Degree Distribution of Palm Vein
Graphs.
the vertex at the end of the edge was removed.
Examples of palm vein graphs from an individual
captured at two different sessions are shown in the
right panels of Figure 2(a) and Figure 2(b).
The Palm vein graphs from the PUT database have
an average of 101 vertices and 112 edges. The aver-
age edge to vertex ratio is 1.11 and the average size
of the largest component is 91. The average size of
the largest component is almost equal to the aver-
age size of the palm vein graph. This indicates that
the image processing can retrieve most of the features
and connecting veins in a given image. Smaller dis-
connected components exist in a palm vein graph be-
cause the quality of the image in certain parts is not
good enough to retrieve the connecting veins. Fig-
ure 3 shows the degree distribution of the Palm Vein
Graphs.
3 BIOMETRIC GRAPH
MATCHING
Biometric Graph Matching (BGM) is a two-stage al-
gorithm for the error-tolerant comparison of biomet-
ric graphs and is described in Lajevardi et al (Laje-
vardi et al., 2013). The first stage is registration and
the second is error tolerant graph matching. Regis-
tration is the process of bringing a pair of compared
graphs into the same reference frame. The Iterative
Closest Point (ICP) algorithm (Chen et al., 2009) and
the Modified Hausdorff Distance (MHD) (Dubuisson
and Jain, 1994) are algorithms commonly used to reg-
ister point clouds. It has been demonstrated by Laje-
vardi et al (Lajevardi et al., 2014) that the registration
process in BGM is either as good as or does better
than these standard algorithms, especially when the
graphs are small. This paper uses a registration al-
gorithm that is a slight modification of Algorithm1 in
Lajevardi et al (Lajevardi et al., 2013). The modified
algorithm is denoted here as Algorithm 2 (see com-
parison results in Table 1). The registration process
in Algorithm 1 translates and rotates a pair of graphs
based on a corresponding pair of edges that define the
coordinate system. Every pair of edges with one edge
from each compared graph, is given a score based on
a function of their edge attributes of length and slope.
The edge pairs are ranked on this score. 2% of the
top ranked edges are then shortlisted for the registra-
tion process. For each of the shortlisted edge pairs,
the two graphs are translated and rotated to make the
start vertex of each edge the origin and the end ver-
tex indicate the positive x-direction. The vertex labels
of both the translated and rotated graphs are recalcu-
lated based on the new orientation. The Euclidean
distance between the vertex labels, which in this case
are the cartesian coordinates of the vertex positions,
are compared to count the number of vertex pairs that
lie within a tolerance ε of each other. The edge pair
that gets the largest number of vertex pairs within ε is
chosen as the edge pair to register the graphs and the
corresponding transform (translation and rotation) is
taken as the correct transform to achieve the best reg-
istration.
On implementing Algorithm 1 for registering the
palm vein graphs, we found one drawback that caused
several genuine palm vein samples to be misaligned.
Most edge pairs in the palm vein graph were short and
shorted pairs often scored a high rank compared to
longer pairs. This caused longer pairs that gave a bet-
ter registration to not appear on the top 2% shortlist.
To overcome this, we modified Algorithm1 to split the
set of edge pairs into long and short edge pairs. The
mean of the medians of the edge lengths in the two
graphs was selected as the threshold. If both edges
of an edge pair had length greater than this threshold,
the edge pair was categorised as long. All other edge
pairs were labeled as short. The new shortlist com-
prised the top 2% of long edge pairs and the top 2%
of short edge pairs. This modification ensured that
long edge pairs that potentially gave better alignment
could be included in the shortlist to get a better regis-
tration of the graphs. This is called as Algorithm 2 in
this paper.
Once a pair of graphs is registered, the graph
matching process gives a numerical measure of the
distance between the pair of graphs by using the
topological properties of a graph edit path-based in-
duced subgraph. The error tolerant graph match-
ing is adapted from that proposed by Riesen and
Bunke (Riesen and Bunke, 2009). Their proposed al-
gorithm computes a graph edit distance and graph edit
path between a pair of compared graphs by treating
the two graphs as two vertex sets of a bipartite graph.
ICISSP2015-1stInternationalConferenceonInformationSystemsSecurityandPrivacy
298
Every primary vertex is mapped to one secondary ver-
tex using the Hungarian optimisation algorithm with
a cost function based on the vertex attributes. In this
paper, the cost function between a pair of vertices is
the Euclidean distance between the vertex labels and
is described in (Lajevardi et al., 2013).
The graph matching process is simplified to a set
of edit operations to convert the first graph (source
graph) to the second graph (destination graph). The
edit operations allowed are insertion, deletion and
substitution of vertices. Each vertex in the source
graph has a fixed cost associated with deleting it
(D(n) ×α) where D(n) is the degree of the vertex n
and α is called the insertion and deletion cost and is
a non zero integer. If n is a vertex in the destination
graph, the cost of inserting it is also D(n) ×α. In this
research we keep the insertion cost and deletion cost
the same (α), however, it is possible to have different
costs. Once the Hungarian algorithm computes the
cheapest edit path to convert the source graph to the
destination graph, this edit path is used to build the
maximum common subgraph (mcs). The vertices of
the destination path could be associated with two op-
erations from the edit path - substitutions of vertices
from the source graph and insertions. The mcs is a
vertex induced subgraph of the destination graph. In
particular, the mcs will comprise only those vertices
of the destination graph that were associated with sub-
stitutions in the cheapest edit path. An edge will exist
in the mcs if the edge existed in corresponding ver-
tex pairs of both the source and destination graphs.
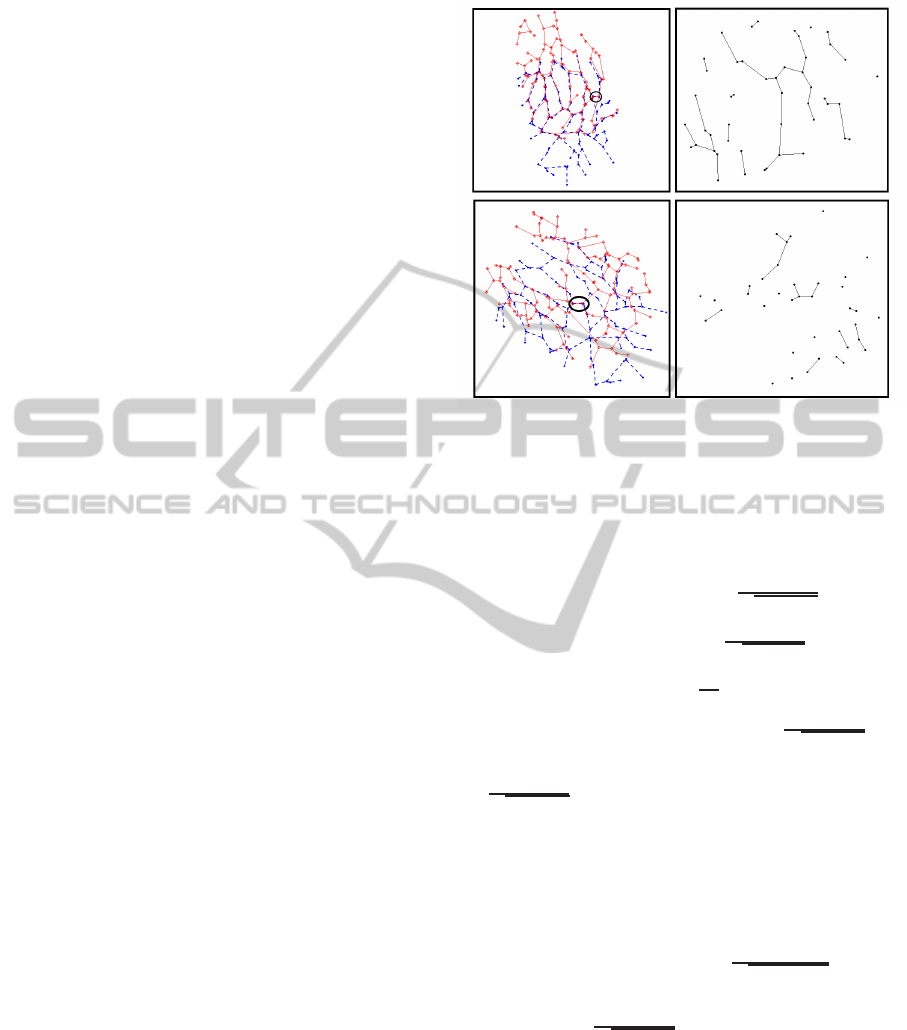
Figure 4 shows the mcses from a genuine graph com-
parison and an imposter graph comparison. Note the
difference in topology of the two types of mcses. Mc-
ses from a genuine comparison are observed to have
more vertices and more edges with larger connected
components than the mcses from an imposter compar-
ison. It is this difference in topology that will be used
to define similarity scores to distinguish genuine and
imposter comparisons.
4 GRAPH FEATURES
The topological features of the mcs are used to
differentiate the comparisons of samples from the
same palm and samples from different palms. Let
g
1
= (V
1
, E
1
, µ, ν) and g
2
= (V
2
, E
2
, µ, ν) be the two
graphs compared using the BGM algorithm and g =
(V, E, µ, ν) be the mcs of the graphs. Let C1 and C2
be the vertex counts of the largest and second largest
components, c
1
and c
2
in g.
Similarity scores based on the graph features are
defined as follows:
Figure 4: Examples of registrations of a pair of graphs taken
from the (a) (top - left) the same palm at different sessions
and (c) (bottom-left) from different palms. The correspond-
ing maximum common subgraphs are in (b) (top-right) and
(d) (bottom-right). In Figure (a) and (c) the edge pair on
which the graphs register is shown by the black circle.
1. Normalised vertex count, S
n
=
|V|
√
|V
1
|×|V
2
|
2. Normalised edge count, S
e
=
|E|
√
|E
1
|×|E
2
|
3. Edge to vertex ratio, S
ρ
=
|E|
|V|
4. Size of the largest component, S
c1
=
C1
√
|V
1
|×|V
2
|
5. Size of the second largest component, S
c2
=
C2
√
|V
1
|×|V
2
|
6. Ratio of the number of isolated vertices in the mcs
to the number of connected vertices, S
i
.
7. Total length of the edges in the largest component
in the mcs. Let L() be a function that takes a graph
as input and returns the sum of the lengths of the
edges in the graph. Then S
l
=
L(c
1
)
√
L(g
1
)×L(g
2
)
8. sum of the sizes of two largest components in the
mcs, S
c1c2
=
C1+C2
√
|V
1
|×|V
2
|
9. Edge to vertex ratio of the largest component, S
ρ
c1
10. Ratio of the number of vertices with degree
greater than 3 in the mcs, to the total number of
vertices in the mcs, S
d
.
We investigate if one or more of these features can
be combined to achievemaximum separation between
genuine and imposter scores of comparisons from the
palm vein database.
ThePalmVeinGraph-FeatureExtractionandMatching
299

Table 1: Comparison of Registration Algorithms Algo-
rithm1 (Lajevardi et al., 2013) and Algorithm 2, proposed
in this paper.
Algorithm 1 Algorithm 2
Best ε 6 6
Average time (sec) 15.99 25.94
EER (as %) 2 0
5 EXPERIMENT
The PUT database has for left and right hands re-
spectively, 600 palm vein images from 50 individuals,
giving 6600 genuine comparisons across all sessions,
1800 genuine comparisons within same sessions and
352800 imposter comparisons. To tune the param-
eters in the experiment, we chose a random sample
of 50 genuine comparisons and 50 imposter compar-
isons from all possible genuine and imposter compar-
isons. This set of 100 comparisons is called the train-
ing set and will be consistently used throughout all
the experiments described in this paper. The BGM
algorithm has two parameters to be tuned, the toler-
ance ε in the registration algorithm and the insertion
and deletion cost α in the graph matching algorithm.
The first experiment was to compare the registration
algorithm by Lajevardi et al (Lajevardi et al., 2013)
with the improved algorithm, Algorithm 2, presented
in this paper. The graph pairs in the testing set were
aligned first using Algorithm 1 and then Algorithm
2 and in each case, the number of vertex pairs that
lay within a tolerance ε of each other were counted.
A distance measure based on the Similarity score S
n
(Section 4, Score 1), given by d
min
= 1 −S
n
is com-
puted from the number of common vertex pairs and
the sizes of the two graphs compared. The d
min
val-
ues between genuine and imposter comparisons in the
training set are used to define score distributions to
compare the alignment performance of the two algo-
rithms. This experiment is run over range of ε values
to find the ε value that gave the lowest EER for each
algorithm. The Equal Error Rates (EER) at the best ε
value for each algorithm and the average registration
times are presented in Table 1.
Setting ε = 6 and using Algorithm 2 for reg-
istration, the BGM algorithm was run on all the
comparisons from the palm vein database, excluding
the comparisons used in the training set. BGM was
run using a range of α values to determine the pa-
rameters that best separated the genuine and imposter
scores. It was found that α = 11 best compensated
for the variations within samples of the same hand
in determining the graph edit path when comparing
pairs of graphs.
The BGM algorithm was run on Left and Right hands
were tested separately. There were two distinct types
of experiments based on the type of genuine com-
parisons made. First, Across Session Genuines using
all the genuine comparisons including those across
sessions and the second Within Session Genuines,
with genuine comparisons taken only from within
the same session. In both types of experiments,
distances between a pair of graphs was measured
using each of the 10 topological measures listed in
Section 4. Table 2 shows the EER based on the the
10 topological features for across session and within
session experiments for left and right hands. The
Table 2 shows that S
e
does the best job of separating
the genuine comparisons from the imposters.
The next step was to determine if any combina-
tion of similarity scores could improve the perfor-
mance compared to using a single similarity measure.
To do this, first the pairwise Spearman’s correlation
coefficient between the 10 features was calculated.
We found that most of the topological features were
strongly correlated, with correlation coefficients be-
tween 0.8 to 0.95. In fact only S
ρ
c1
showed moder-
ate correlations ranging between 0.58 and 0.78 with
the other features. Nevertheless, in the absence of
perfect correlation between features, there is a poten-
tial that pairwise combination of S
e
with one of the
other features could produce better matching results.
To test this hypothesis, S
e
was combined with every
other feature to give 9 different pairings of topolog-
ical features. For every pair of features, the follow-
ing experiment was done. A Support Vector Machine
(SVM) was used to build a classifier with a radial ba-
sis function (RBF) kernel that was tuned on the score
pairs from the training set to determine the best pa-
rameters for the RBF kernel. The remaining compar-
isons on the database were divided into 10 parts and a
10 fold test was conducted where the SVM classifier
was trained on 9 parts of the data and tested on the
one other part. The false match rate (FMR), false non
match rate (FNMR) and total misclassification error
(TE) were computed in every fold. The average over
10 folds was taken as the matching performance us-
ing the chosen pair of features. The results for the 9
pairings are shown in the Table 4.
6 RESULTS AND DISCUSSION
Table 1 shows that Algorithm 2 significantly improves
the registration process over Algorithm1 by Lajevardi
et al (Lajevardi et al., 2013), evidenced by the 0%
ICISSP2015-1stInternationalConferenceonInformationSystemsSecurityandPrivacy
300

Table 2: Equal ErrorRate as % , when comparing genuine and imposter palm vein graphs using each of the 10 graph measures.
EER as %
Topological Across Session Within Session Across Session Within Session
Measure Genuines , Left Genuines, Left Genuines , Right Genuines, Right
S
n
4.18 2.02 4.17 2.13
S
e
2.71 1.11 2.55 1.23
S
ρ
5.32 2.9 5.27 3.42
S
c1
6.06 3.91 6.63 4.39
S
c2
7.33 5.49 7.76 5.58
S
i
8.43 5.66 8.25 5.93
S
l
5.64 3.5 6.59 4.19
S
c1c2
4.45 2.51 4.79 2.91
S
ρ
c1
19.22 19.96 13.04 12.67
S
d
13.33 9.9 11.5 8.57
EER for Algorithm 2. This demonstrates that for palm
vein graphs, a better registration could be achieved by
considering longer edge pairs which represent longer
vein segments that were often reliably captured across
samples. The algorithm takes longer on average due
to the additional step of separation of long and short
edges.
Table 2 shows that for S
e
, average EER for left
and right palms is 2.63% for across session compar-
isons and this markedly improves on the published
benchmark of 3.86% (Kabacinski and Kowalski,
2011) on the same database. BGM performs on par
with the published result 1.11% for within session
comparisons using S
e
. Note the large difference
between EERs of across session and within session
data. Genuine samples of palm veins captured from
different sessions tend to have large displacement
in captured area. This reduces the common overlap
area between genuine samples and hence causes a
lower score. Comparing our results to the published
benchmark illustrates that BGM performs better than
the benchmark when palm vein samples have only a
partial overlap area. Five out of the 10 features give
competitive EERs of under 5% for within session
comparisons while three of these features (S
n
, S
e
,
S
c1c2
) also give competitive EERs for across session
comparisons.
Table 4 shows that there are three topological fea-
tures, that when combined with S
e
give a compet-
itive matching performance with total misclassifica-
tion rate under 1.9%. To understand how much better
feature combination does over using the single mea-
sure S
e
, we adopt the following procedure. From the
ROC curve when using single feature S
e
(see Fig-
ure 5) we locate the FNMR when using S
e
, at a FMR
value, close to that obtained using two features. If the
FNMR value using two features is actually lower than
Figure 5: The Receiver Operating Characteristic (ROC)
curve, showing the plot of False Match Rates (FMRs) ver-
sus False Non Match Rates (FNMRs) over a range of op-
erating thresholds. The matching algorithm uses a single
feature S
e
.
the corresponding one feature value, that particular
pair of features gives a better result than using a single
feature for comparison. The performance comparison
between two features and one feature S
e
is shown in
Table 3.
Table 3 shows that the topological feature pairs
(S
e
, S
c1
) , (S
e
, S
l
) and (S
e
, S
c1c2
) do better than us-
ing S
e
alone, with (S
e
, S
l
) showing the maximum gain
in performance.
7 CONCLUSION
This paper proposes a graph-based approach to repre-
sent a palm vein template and proposes the Biometric
Graph Matching algorithm (BGM) to match the tem-
plates. The method is tested on the PUT public palm
vein database where each palm vein has 12 samples
captures across 3 sessions. This gave us a good num-
ber of genuine comparisons that were within the same
ThePalmVeinGraph-FeatureExtractionandMatching
301

Table 3: Comparison of matching performance when using a pair of features and a single feature S
e
. The rows where the
FNMRs are in boldface show the feature pairs whose performance is better than using S
e
alone.
Left Palm Right Palm
Features FMR FNMR TE FMR FNMR TE
S
e
, S
n
0.37(±.07) 4.72(±0.38) 2.34(±0.17) 0.38(±0.06) 4.29(±0.25) 1.93(± 0.08)
S
e
, S
ρ
0.52(±0.09) 4.02(±0.35) 2.1(±0.13) 0.36(±0.08) 4.23(±0.24) 1.9(±0.07)
S
e
, S
c1
0.38(±0.09) 3.90(±0.32) 1.97(±0.11) 0.29(±0.04) 3.93(± 0.22) 1.74(±0.07)
S
e
, S
c2
0.41(±0.06) 4.23(±0.3) 2.12(±0.12) 0.44(±0.07) 4.26(±0.21) 1.96(±0.08)
S
e
, S
i
0.31(±0.08) 4.37(±0.35) 2.15(±0.12) 0.40(±0.08) 4.20(± 0.25) 1.92(±0.08)
S
e
, S
l
0.38(±0.1) 3.83(±0.29) 1.94(±0.09) 0.27(±0.03) 3.79(±0.22) 1.67(±0.08)
S
e
, S
c1c2
0.45(±0.08) 3.82(±0.3) 1.97(±0.12) 0.36(±0.03) 3.79(±0.23) 1.72(±0.09)
S
e
, S
ρ
c1
0.51(±0.11) 4.02(±0.33) 2.1(±0.12) 0.46(±0.09) 4.15(±0.23) 1.93(±0.06)
S
e
, S
d
0.48(±0.1) 3.87(±0.35) 2.02(±0.13) 0.44(±0.07) 4.03(±0.22) 1.87(±0.08)
Table 4: Matching performance when combining S
e
with each of the other 9 features. The table represents the mean over
10 folds with the standard errors in brackets. All results are expressed as percentages. The rows corresponding to the
combinations with lowest TE are highlighted.
Feature Pairs FMR FNMR FMR (S
e
) FNMR (S
e
)
S
e
, S
n
Left 0.37 4.72 0.37 4.28
Right 0.38 4.29 0.38 4.06
S
e
, S
ρ
Left 0.52 4.02 0.51 3.98
Right 0.36 4.23 0.36 4.21
S
e
, S
c1
Left 0.38 3.90 0.38 4.22
Right 0.29 3.93 0.23 4.46
S
e
, S
c2
Left 0.41 4.23 0.41 4.16
Right 0.44 4.26 0.44 4.03
S
e
, S
i
Left 0.31 4.37 0.31 4.39
Right 0.40 4.20 0.4 4.03
S
e
, S
l
Left 0.38 3.83 0.38 4.22
Right 0.26 3.79 0.26 4.63
S
e
, S
c1c2
Left 0.45 3.82 0.45 4.13
Right 0.36 3.79 0.36 4.21
S
e
, S
ρ
c1
Left 0.51 4.02 0.51 3.98
Right 0.46 4.15 0.46 3.96
S
e
, S
d
Left 0.48 3.86 0.48 4.04
Right 0.44 4.03 0.44 4.03
session and across different sessions, to estimate the
difference in performance when biometrics are cap-
tured in different sessions. Note that multi session
comparison is typical in a real-world scenario. The
proposed method beats the existing state of art results
on the PUT public palm vein database (Kabacinski
and Kowalski, 2011) for genuine samples captured
across sessions. This establishes BGM as an effec-
tive algorithm when genuine palm vein samples have
partial overlap.
We remark that as the graph edit algorithm we
used gave significant results we did not need to try
other cost functions. However, for future work these
could be applied to help evaluate the efficiency trade-
off of graph matching.
The paper shows that using the graph represen-
tation and BGM matching approach for palm vein
graphs is practical and efficient. The graph-based
measure based on edge count outperforms the mea-
sure based on vertex count. This reinforces the ad-
vantage of using the edge information in representing
the palm vein graph. We further demonstrate that by
combining graph features, the matching performance
can be improved over using just a single feature. The
ability to explore and combine different graph fea-
tures based on the spatial characteristics of the palm
vein graph is one of the biggest advantages of using
the graph-based approach.
ICISSP2015-1stInternationalConferenceonInformationSystemsSecurityandPrivacy
302

ACKNOWLEDGEMENTS
We thank the anonymous referees for comments
which improvedthe clarity of the paper. This research
was funded by ARC grant DP120101188.
REFERENCES
Chen, H., Lu, G., and Wang, R. (2009). A new palm vein
matching method based on icp algorithm. In Proceed-
ings of the 2nd International Conference on Interac-
tion Sciences: Information Technology, Culture and
Human, pages 1207–1211, New York, USA. ACM.
http://doi.acm.org/10.1145/1655925.1656145.
Dubuisson, M. P. and Jain, A. (1994). A modified haus-
dorff distance for object matching. In Proceedings
of the 12th IAPR International Conference on Pattern
Recognition, pages 566–568. IEEE.
Gaikwad, D. P. and Narote, S. P. (2013). Multi-modal bio-
metric system using palm print and palm vein features.
In Annual IEEE India Conference (INDICON), pages
1–5.
Horadam, K. J., Davis, S. A., Arakala, A., and Jeffers, J.
(2011). Fingerprints as spatial graphs: Nodes and
edges. In Proc. of International Conference on Dig-
ital Image Computing Techniques and Applications
(DICTA), pages 400–405, Noosa, Australia.
Kabacinski, R. and Kowalski, M. (2010). Human vein pat-
tern segmentation from low quality images - a com-
parison of methods. Image Processing and Communi-
cations Challenges 2, 84:105–112.
Kabacinski, R. and Kowalski, M. (2011). Vein pattern
database and benchmark results. Electronics Letters,
47(20):1127–1128.
Kumar, A. and Prathyusha, K. V. (2009). Personal au-
thentication using hand vein triangulation and knuckle
shape. IEEE Transactions on Image Processing,
9:2127–2136.
Lajevardi, S., Arakala, A., Davis, S., and Horadam, K.
(2013). Retina verification system based on biometric
graph matching. IEEE Transactions on Image Pro-
cessing, 22(9):3625–3635.
Lajevardi, S., Arakala, A., Davis, S., and Horadam, K.
(2014). Hand vein authentication using biometric
graph matching. IET Biometrics. doi: 10.1049/iet-
bmt.2013.0086.
Perona, P. and Malik, J. (1990). Scale-space and edge detec-
tion using anisotropic diffusion. IEEE Transactios on
Pattern Analysis and Machine Intelligence, 12:629–
639.
Riesen, K. and Bunke, H. (2009). Approximate graph
edit distance computation by means of bipartite graph
matching. Image and Vision Computing, 27(7):950–
959.
Shahin, M., Badawi, A., and Kamel, M. (2007). Biometric
authentication using fast correlation of near infrared in
hand vein patterns. International Journal of Biomedi-
cal Sciences, 2:141–148.
Wang, L., Leedham, G., and Cho, S. Y. (2007). Infrared
imaging of hand vein patterns for biometric purposes.
IET Computer Vision, 1(3-4):113122.
Watanabe, M., Endoh, T., Shiohara, M., and Sasaki, S.
(2005). Palm vein authentication technology and its
applications. In Proc. of Biometrics Consortium Con-
ference, pages 1–2, Arlington, VA.
Wenxiong, K. and Qiuxia, W. (2014). Contactless palm
vein recognition using a mutual foreground-based lo-
cal binary pattern. IEEE Transactions on Information
Forensics and Security, 9:1974–1985.
Zuiderveld, K. (1994). Contrast limited adaptive histogram
equalization. Academic Press Professional, Inc., San
Diego, CA, USA.
ThePalmVeinGraph-FeatureExtractionandMatching
303
