
The Smartphone as a Gait Recognition Device
Impact of Selected Parameters on Gait Recognition
Josselyn Le Moing and Ingo Stengel
School of Computing and Mathematics, Plymouth University, Plymouth, U.K.
Keywords: Gait Recognition, Biometric Authentication, Accelerometer.
Abstract: This paper aims to identify the impacts of a couple of parameters on gait recognition when a build-in
smartphone accelerometer is used. The use of different types of shoes impacts significantly gait recognition
while the matching rate on a different surface e.g. grass has only a minor impact. A correlation between
accelerometer’s data and the phone position was identified. For this, data originating from the Z-axis as well
as from the X-Y-Z –axis was used together with Dynamic Time Warping (DTW) for template generation
and matching tests.
1 INTRODUCTION
Security often refers to the process of assets
protection. In this context, verification of identities,
known as authentication, is used as a mean to ensure
the right person is able to access information.
Authentication mechanisms are used on almost any
device. Especially on mobile devices, authentication
is “not user friendly enough to be widely adopted”
(Schloeglhofer et. al.,2012). As a consequence non-
invasive, continuous methods of authentication like
gait recognition are currently being explored.
Gait recognition is an emerging biometric
technology that does not explicitly involve users’
actions. It evaluates the manner of walking over a
certain distance (Nambiar et al., 2012). and can be
used to identify persons (Lu et al., 2014). First
approaches used a visual evaluation of the recorded
movements (Bouchrika, et al. 2008), while later
approaches used sensors like accelerometers in
mobile devices to record specific data (Gafurov et
al., 2007). Factors originating from users (e.g.
illnesses as Parkinson disease, etc.) as well as from
the environment (e.g. ground the user is walking on,
etc.) can impact the process of gait based
authentication.
The aim of this research project is to find out
how strong the impact of parameters like, e.g. types
of shoes, types of floors and phone position, is on
the process of gait recognition. The problem is worth
giving attention since these environment-related
parameters have an impact on the quality of the
authentication process and as such on the level of
Security provided.
The use of time domain analysis methods
constitutes a limitation of this approach. However,
the use of frequency based methods is planned for
the future.
2 PREVIOUS WORKS
Significant research in gait recognition was done by
several researchers, e.g. (Nickel, 2012). However,
very few research projects took into consideration
the impact of external parameters like type of
floor/surface, different footwear and the position of
the phone.
Details show that results with regard to the
impact of surfaces on gait recognition are not as
clear as they seem to be at the first sight. (Holien et
al., 2007) identified that the modification of the
surface does not have a significant effect on gait
recognition but they showed that gait recognition is
more efficient on gravel and grass than on indoor
surfaces. Later, Muaaz and Nickel (2012) showed
that walking on grass and on inclined surfaces
impacts significantly gait recognition. Walking on
gravels - although impacted - produced comparable
results to normal gait.
In two studies, the impact of different footwear
was examined using video analysis. The first report
shows that all shoes excluding strapless open-toed
sandals do not impact gait recognition (Bouchrika
322
Le Moing J. and Stengel I..
The Smartphone as a Gait Recognition Device - Impact of Selected Parameters on Gait Recognition.
DOI: 10.5220/0005243003220328
In Proceedings of the 1st International Conference on Information Systems Security and Privacy (ICISSP-2015), pages 322-328
ISBN: 978-989-758-081-9
Copyright
c
2015 SCITEPRESS (Science and Technology Publications, Lda.)
and Nixon, 2008). However, flip-flops have a
significant impact. The second research highlights
the significant impact of the type of shoes in the
recognition process using the video analysis method
(Matovski et al., 2012).
None of the previous studies analysed the impact
of shoes and the position of the smartphone on gait
recognition using the accelerometer in a smartphone.
3 RESEARCH METHODOLOGY
In order to use the smartphone as a gait recognition
device, an Android application was developed. Its
main objective is to collect data from different
sensors in the phone that was worn by the participant
during the experiment, see Figure 3. Then, the data
will be processed and interpreted using MatLab
scripts. The impact of the different parameters used
was analysed using data from two experiments.
3.1 Number of Participants
The identified impact of the parameters should be
independent of the person who wears the phone.
Therefore 19 volunteers within an age from 18 to 25
years participated in this experiment. Should the
results be promising, a further evaluation with
significant numbers (100 volunteers) will be
implemented. The experiment is anonymous and
each volunteer is represented by a number in the
experiment. An additional letter identifies the type
of experiment done.
3.2 Research Procedure
The research procedure is similar to the one used in
(Thang et al., 2012), where first a reference gait
(called normal gait) is identified before additional
measurements can be done, e.g. measuring the gait
with different types of shoe.
In order to determine a reference gait for each
participant the first step for each user consists in
several measurements during walks on the pavement
with the phone tied to the leg using a leg band
(Figure 1).
The next measurements helped to identify the
impact of the selected parameters like floors on gait
recognition, e.g. by walking on grass with the
smartphone tied to the leg with the leg band.
To measure the impact of shoes two extremes will
be used: normal, closed shoes and flip-flops.
Featured templates will be extracted from these
recordings.
Figure 1: “Leg band” (Side view).
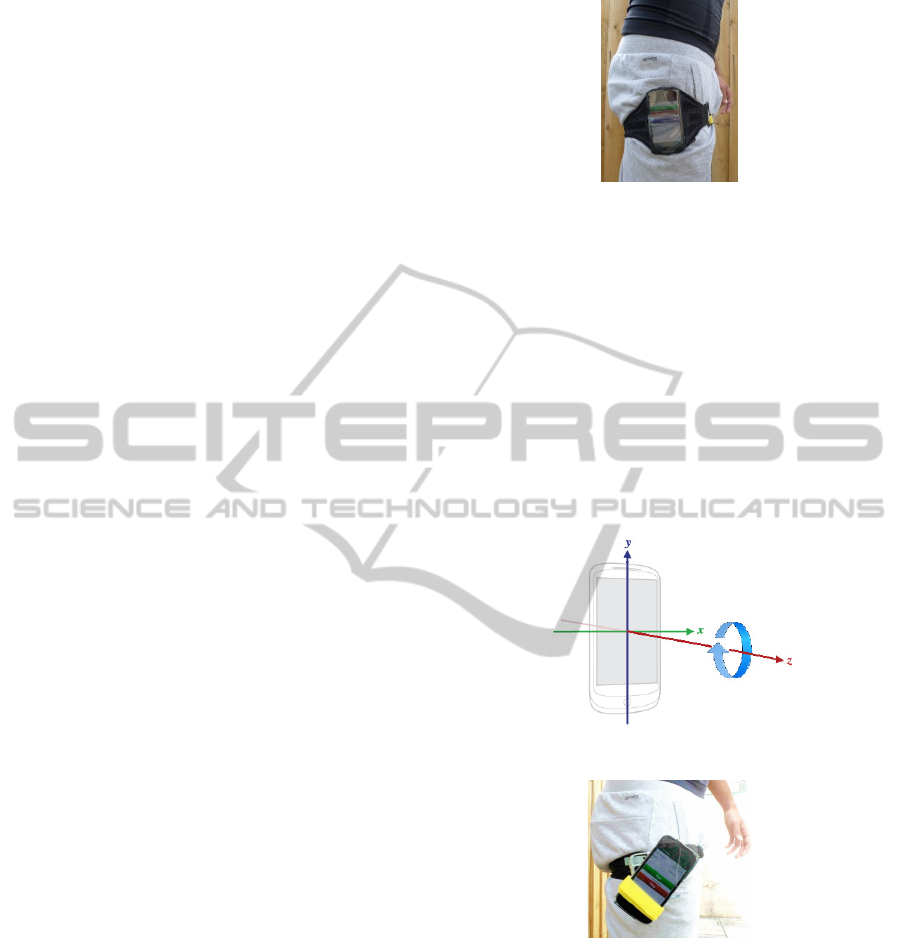
Finally, the impact of the smartphone positioning in
the trousers’ front pocket will be tested. In this third
part, participants with adequate trousers (tight to the
body) will walk with the smartphone in their
trousers’ front pocket. This will help to identify
potential differences in measurements based on the
position on the phone.
The second aim will be to understand how
reliable the accelerometer’s data is, when the
smartphone rotates around its Z-axis (Figure 2). This
device will allow a rotation around the Z-axis of the
phone (one degree of freedom) and be attached to
the leg using a strap.
Figure 2: Smartphone axis (Android, 2014).
Figure 3: Data collection around the Z axis (Side view).
The last step of this methodology is the
interpretation of data. Several choices will have to
be made in order to select a suitable method. First of
all, MatLab will be used for the interpretation of
results. It was chosen because it simplifies handling
of large amounts of data.
3.3 Selecting the Analysis Method
In this research area two analysis methods are
traditionally used: the Dynamic Time Warping
TheSmartphoneasaGaitRecognitionDevice-ImpactofSelectedParametersonGaitRecognition
323
(DTW) method in the time domain and the Fast
Fourier Transform (FFT) method in the frequency
domain.
Even though it was shown that the analysis in
frequency domain (FFT) gives a better matching
results than DTW (Thang et al., 2012), the latter was
chosen for our experiment. It gives a better
representation of the user’s physical gait
(acceleration as function of time) and is more
suitable for the comparison of curves (Thang et al.
2012).
Additionally, DTW is a non-linear time
alignment technique that allows matching of similar
shapes out of phase in the same time axis (Danias,
2014) and thus avoids gait cycle length
normalisation. This approach allows the
measurement of similarities between two series of
data that do not have the same length and as such fits
our requirements.
4 RESULTS AND DISCUSSION
Before discussing results, it is necessary to explain
how a confusion matrix works and to address
decisions linked to measurements and evaluation
that were made.
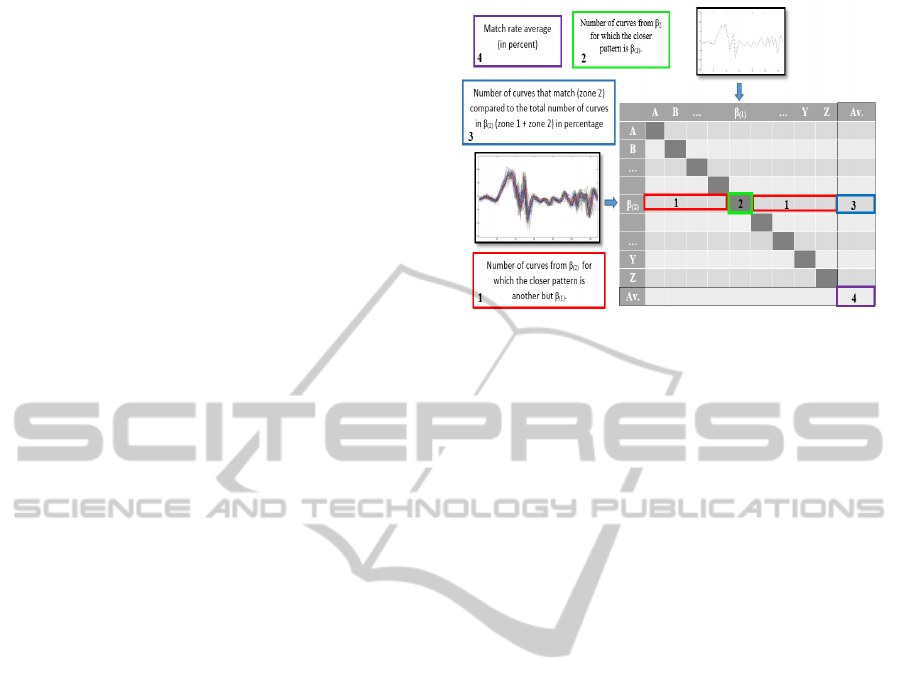
4.1 Confusion Matrix
A confusion matrix contains two inputs in which
each letter (A – Z) is a label of a participant. The
horizontal input represents each participant’s
featured template which is obtained after a training
phase or by extracting the most representative vector
of a record. This featured template is the curve
which the vertical entry will be compared with.
Indeed, the vertical input contains all curves
representing each step for a specific record.
Each vertical input contains all the curves of the
record for one person (one curve represents one
step) and each curve is compared with all the
featured templates of all participants. The
comparison is done by calculating the distance
between these curves using the DTW method,
additionally the table’s cell corresponding to the
featured template is incremented by one.
The last column of this matrix contains the
percentage of matches for each vertical entry. It
shows the number of curves that match with the
good featured template (corresponding to the same
person) compared to the number of curves tested.
Figure 4 illustrates in detail the operation on this
type of matrix.
Figure 4: Explanation of the confusion matrix operation.
In this step three records belonging to normal gait
records are used for comparison. The featured
template is extracted from the first record and
compared to the curves representing the second and
the third record. The average matching rate is
73.41% against 73.85% when the featured template
is extracted from the second records.
4.2 Choice of the Time Interpolation
Frequency
The gait recognition algorithm developed collects
data from the accelerometer sensor of the
smartphone at the speed set by the phone.
A quick analysis of the first data extracted using
the accelerometer showed that the smartphone does
approximately a hundred measurements per second.
In the first approach the closest time interpolation
frequency (128 Hz) to one hundred (in power of 2)
was selected.
This choice had to be confirmed by comparing
matching results with other time interpolation
frequencies. The algorithm was tested with the first
two lower frequencies which are 64 Hz and 32 Hz.
A higher frequency has not been tested for two
reasons. Firstly, with this amount of points (256
points per second), the algorithm’s execution time
would have been too long and data interpretation
would not have been possible with the laptop used.
Secondly, such a frequency would have created too
many missing points in the original recording and it
might have influenced negatively the collected data.
Comparisons of these three frequencies (128 Hz, 64
Hz and 32 Hz) are done using a confusion matrix.
For the same recording, the average matching rate is
80.61% with a frequency of 128Hz against a rate of
44.22% with a frequency of 32Hz and with 62.03%
at 64 Hz. This large difference shows clearly that the
ICISSP2015-1stInternationalConferenceonInformationSystemsSecurityandPrivacy
324

average matching rate considerably increases with
the number of points per second.
In addition to this difference, the variation
between two recordings is also impacted by the time
interpolation frequency. Indeed, with a frequency of
128 Hz, the average matching rate difference
between the two samples is 0.31% while for 64 Hz
the difference is 6.92% and for 32 Hz, 6.04%.
The time interpolation frequency initially chosen is
finally the best of the three tested because it
produces the highest matching rate and will provide
significant recognition results.
4.3 Detecting the Starting Point
In order to determine this starting point of gait, data
collected following the Y axis of the accelerometer
was analysed. This data is used to detect vertical
acceleration. Moreover, in previous work (Gafurov
et al., 2007) indicates that, from a standing position,
starting to walk involves an acceleration of around
1.3g. It was suggested to identify the starting point
when the measurement on the Y axis exceeds
12.74m/s
2
(1.3g x 9.8m/s
2
).
4.4 Cycle Detection and Step
Extraction
For cycle detection, data from mainly one axis (Y-
axis) was used.
Data originating from several dimensions makes
the detection of cycles hard. However, filtering one
dimensional data will result in a sinusoidal curve
that will allow the identification of cycles (Thang, et
al. 2012). The measurement of each pattern length in
this sinusoid will identify the cycle time of each
step.
As such the first step of cycles detection is to
filter the Y component of accelerometer using a
moving-average filter with a 50 points window to
clearly identify peaks. Each of these peaks
represents the starting point of one step. The time
interval between two peaks is the time of one step.
All these landmarks are then applied to the Z-
axis. Steps and data between two consecutive
landmarks are extracted. To avoid any error in this
important extraction phase, the length of each step is
compared to the cycle time of a normal person
which is a value between 0.87 - 1.32 seconds
(Levine et al., 2012). The multiplication of this time
value with the time interpolation frequency indicates
the range of acceptable values for a step.
4.5 Determination of the Featured
Template
Once each step is extracted, the distance between
them is calculated using the Dynamic Time Warping
method (Lemire, 2009) which is a method to
calculate the distance between two curves. Unlike
Euclidean or Manhattan methods which align the x-
th point of one curve with the x-th point of the other,
the DTW method uses a non-linear time alignment.
The distances between each curve are placed in a
matrix and the average distance of each curve is
calculated. The curve which has the lowest average
distance is considered to be the featured template of
the record.
4.6 Impact of the Smartphone’s
Position on Gait Recognition
The technical challenge when the phone is placed in
a random position is to recognize this position and to
adapt the algorithm to proceed with gait recognition.
Each position has its own pair of X and Y central
values, which makes the identification of the
smartphone’s position easily possible. Furthermore,
the step detection is based on Y axis data when the
phone is in its normal position (top of the phone
oriented upwards) and each cycle time is delimited
by two peaks of this axis. This axis has been chosen
because its direction is parallel to the user and
detects up and down variations. However, when the
inclination of the phone is modified, this axis does
not detect these variations anymore. As a result, a
phase difference seems to exist between curves
along the same axes in different position. This
difference could be due to a different sampling of
the original data. In order to avoid this problem, the
selection of the axis which will determine the cycle
time has to be linked to the phone position detection:
Y-axis when the phone is oriented upwards, absolute
value of the X axis when it is oriented forwards,
absolute value of the Y axis when it is downwards
and X-axis when the phone is oriented backwards.
4.7 Impact of the Curve Filter
The degree of filtering impacts the analyses of
curves and as such the achieved results. Filtering is
intended to reduce the existing error rate.
The application of filtering techniques gives
several results depending on the filters applied.
These results show a progressive increase of the
average matching rate when the value of the filter is
TheSmartphoneasaGaitRecognitionDevice-ImpactofSelectedParametersonGaitRecognition
325

incremented. Furthermore, it proves that filtering has
a positive impact on gait recognition.
This positive impact can also be identified by the
increase of perfect matches. Indeed, when gait is
analysed without filters, a perfect match occurs for
one participant out of thirteen only, while with a
filter of 90%, a perfect match occurs for ten
volunteers. Furthermore, the use of an important
filter removes intermediate values. Indeed, the
average matching rates using an important filter are
close to 100% or 0% which gives a binary answer to
the gait recognition question.
Even if the highest filter seems to be the best
solution, it is preferable to select an intermediate one
in order to diversify the answer. Indeed, the binary
answer provided by the highest filter avoids any
interpretation of the result while it can be interesting,
in a future application, to make a difference between
a perfect match and an intermediate one.
4.8 Elimination of Abnormal Steps
Abnormal steps are steps for which representing
curves have the highest average distance with the
other curves using the DTW method. As they are not
representative to the average gait, the curves with
the highest variance from the average were removed.
Indeed, these curves represent abnormal actions
done by the user during the walking process
(obstacle, loss of balance…).
During evaluation the presence of a few extreme
values were noted. Whereas most of the values are
included between 60% and 100%, some average
matching rates are close to 0%.
The presence of these values is due to mis-
measurement during the experiment and mainly with
the use of the “leg band”. Indeed, this “leg band”
slid down along few participant’s leg and they had to
hold it to avoid this problem. The cause of this mis-
measurement was confirmed by the experiment.
In order to avoid a misinterpretation of these
errors, 10% of the extreme values are filtered when
the sample of participant permits it.
4.9 Results
4.9.1 Impact of the Shoes
When gait using shoes is compared to the normal
gait, the average matching sample obtained for each
recording is relatively low (49.21% and 49.8%) as
shown in table 1.
However, when gait data series are compared to
each other, the result is significantly higher.
Table 1: Average values of shoe measurement series.
Average values 1 2
Normal gait vs. 2 samples of
normal gait
70.56 69.54
Normal gait vs. 2 samples of gait
on grass
49.21 49.8
Gait with flip-flops vs. 2 samples
of gait on grass
84.13 80.24
The significant decrease of the average match using
flip-flops means that the use of this type of shoes
significantly impacts gait.
Furthermore, the good
match of two gaits using flip-flops confirms that the
shape of the gait is linked to the type of shoes used
and the strongest result identified with flip-flops
shows that gait is more specific for each person
using flip-flops making the recognition easier by not
limiting movement as strongly as regular shoes do.
Flip-flops give a lot of freedom of movement, which
leads to a stronger characteristic of movements. On
the other hand, more sturdy, more closed shoes limit
the movement. This can lead to higher false
positives or negatives as the measured values might
not differ strongly.
4.9.2 Impact of Different Floors
The comparison of the normal gait with gait on the
grass gives an relatively high average match as
shown in the Table 2.
Table 2: Average values of different floors measurement
series.
Average
values
1 2
Trim.
mean 1
Trim.
mean 2
Normal gait
vs. 2 samples
of normal gait
74.2 74.92 83.34 83.92
Normal gait
vs. 2 samples
of gait on
grass
72.73 62.62 79.43 71.96
Gait with flip-
flops vs. 2
samples of
gait on grass
72.13 71.92 77.19 77.67
Whereas the variation of normal gait between two
recordings is almost non-existent, a significant
variation is identifiable when the gait on the grass is
compared to the normal surface.
Contrary to the conclusion made in previous
research (Holien et al., 2007), when participants
walk on the grass, the recognition probability is
more variable and less predictable because of the
ICISSP2015-1stInternationalConferenceonInformationSystemsSecurityandPrivacy
326
irregularities in the floor. Furthermore, the
comparison of the two records on the grass to each
other (Table 2) shows that, for a same itinerary on
this surface, the average matching rates are similar
to normal gait recognition and the level of variation
observed previously disappeared. For the same
person, the gait is characteristic to the type of floor.
The comparison of two gaits recorded on two
different floors implies a decrease of the recognition
probability.
4.9.3 Impact of Positioning the Phone in the
Pocket
The comparison of the normal gait with the gait with
the phone in the pocket (Table 3) gives a weak result
with an average matching rate of 26.28% for the first
recording and 22.96% for the second one. These
weak matches are in contrast to the result of the
comparison between the two recordings of the gaits
with the phone in the trousers’ pocket (Table 3):
82.29% and 76.77%.
Table 3: Normal Gait vs. 2 samples of Normal Gait.
Average values 1 2
Normal gait vs. 2 samples of
normal gait
70.37 69.64
Normal gait vs. 2 samples of gait
with the phone in the pocket
26.28 22.96
Gait with phone in the pocket
vs. 2 samples of gait with the
phone in the pocket
82.29 76.77
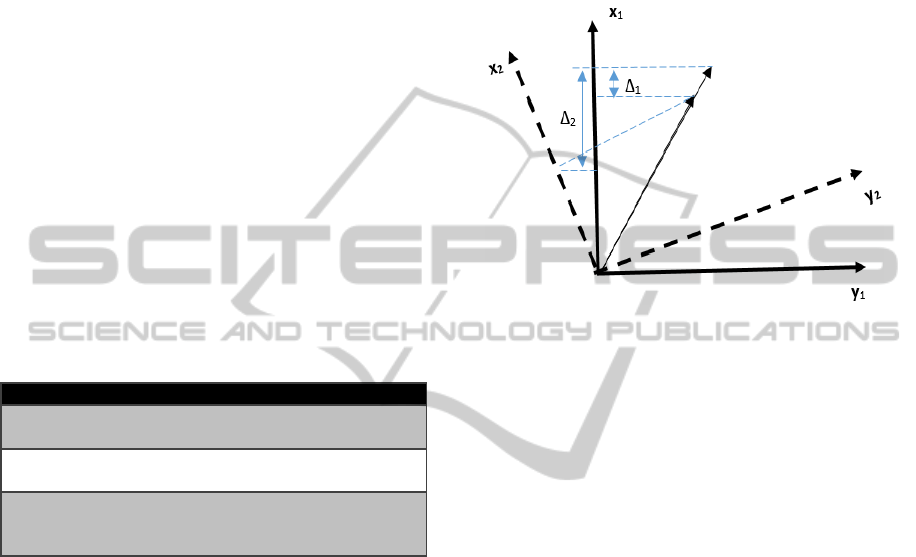
The comparison of normal gait with the gait with the
phone in the pocket may seem disappointing at first
sight since there are low average matching rates
(Table 3). But these results have to be interpreted in
context. Indeed, the modification of the position
when the smartphone is placed in the pocket
produces a modification of the phone’s coordinate
system and this difference changes the conditions of
comparison (Figure 5). The matching rates are
calculated with regard to variations along the Z axis
which is oriented to the user’s right side, whereas
with the phone in the pocket the orientation of the Z
axis is slightly different. Indeed, in the figure 5, Δ
1
and Δ
2
represent the same data variation but with a
rotation of the reference system. The impact of this
rotation implies a significant difference on the Δ
variation.
However, when the two recordings of gait data
with the phone in the pocket are compared to each
other, the results are very successful. These
matching rates are even higher than normal gaits.
This improved result is probably due to a better
stability in the pocket than with the leg band
avoiding up and down movements of the phone.
This hypothesis tends to be confirmed by the
absence of extreme values when the phone is placed
in the pocket. Indeed, the shape of the pocket
ensures a better stability by holding the phone on
each side.
Figure 5: Impact of the modification of the phone position
on the reference system.
4.10 Gait Recognition – Three-
Dimensional Data Vs. the Initial
Approach
The gait recognition algorithm developed to analyse
data from the smartphone uses the Y axis to
determine the starting point of the recording as well
as the cycle time of each step. These cycle times are
then applied to the data recording from the Z axis in
which each step is extracted in order to be
compared.
Another approach that was tested uses more than
one axis to achieve the comparison. This is why,
after the analysis of the Y axis in order to know the
cycle time of each step, the three axes X, Y, Z are
sampled step by step.
The results with the algorithm using three-
dimensional data are more conclusive than the
previous one. Indeed, for the normal gait, the
comparison of data from three axes gives an average
matching rate of 86.7% (against 73.41% with the
previous method) and a trimming mean of 94.64%
(against 80.30%). Regarding the gait on the grass,
results are similare with 85.9% against 72.73% for
the average matching rate and 92.89% against
82.57% for the timming mean. However, the most
surprising result concerns gait using a different pair
of shoes. While the first comparison method gave a
match of 49.21%, the use of the three dimensional
data gives a better result of 84.76%.
TheSmartphoneasaGaitRecognitionDevice-ImpactofSelectedParametersonGaitRecognition
327

While the recognition following the Z axis is widely
affected by the use of a different pair of shoes, the X
and Y axes seem to be almost unchanged to ensure a
similar recognition to normal gait. This seems
logical since Z characterises a sidewise movement.
Sturdy shoes reduce this movement significantly,
while flip-flops offer freedom of movement on this
axis.
Naturally, processing of three-dimentional data
requires more computing power than data from
fewer dimmensions. While the initial approach
needed only a couple of seconds for the analysis, the
approach using three-dimentional data needed more
than one minute to process data. As such the initial
approach constitutes a tradeoff time vs. security.
With current hardware none of these approaches can
be used in real-time.
5 CONCLUSIONS
This pilot project addresses a couple of factors, e.g.
types of shoes, types of floors and phone position
that might have an impact on gait recognition and as
such on the security provided through authentication
mechanisms using gait recognition.
While most of the factors do not have a
significant impact on gait, a few factors like shoes
can have a big impact. Gait is significantly modified
if the user does not use close pairs of shoes. Open
shoes produce impressive results.
A varying surface has only a limited impact on gait
recognition. However, three-dimensional data can
help to mitigate variations generated by the factors
mentioned. In some cases they tend to disappear
leading to a very good recognition rate.
Finally, when the phone is positioned in the trousers’
pocket rather than tied to leg with a leg band, huge
differences appear in the recognition process
because of the modified position. Up and down
movements along the leg introduce extreme values
which impact the results.
Not all results identified were those expected.
This means the problem is worth giving attention in
the future, especially by observing new parameters
together with new recognition algorithms.
REFERENCES
Android, 2014. Developer Android website, Sensors
Overview, [online] Available: http://developer.
android.com/guide/topics/sensors/sensors_overview.ht
ml (Accessed 23 August 2014).
Bouchrika, I., Nixon, M., S., 2008. Exploratory Factor
Analysis of Gait Recognition, [online] Available:
http://eprints.soton.ac.uk/266140/1/paper.pdf
(Accessed 26 August 2014).
Gafurov, D., Snekkenes, E., Bours, P., 2007. Gait
Authentication and Identification Using Wearable
Accelerometer Sensor, [online] Available:
http://ieeexplore.ieee.org/xpl/login.jsp?tp=&arnumber
=4263244&url=http%3A%2F%2Fieeexplore.ieee.org
%2Fxpls%2Fabs_all.jsp%3Farnumber%3D4263244
(Accessed 23 August 2014).
Holien, K., Hammersland, R., Risa, T., 2007. How
Different Surfaces Affect Gait Based Authentication,
[online] Available: http://rune.hammersland.net/
tekst/gait_surfaces.pdf (Accessed: 27 August 2014).
Lemire, D., 2009. Faster Retrieval with a Two-Pass
Dynamic-Time-Warping Lower Bound, Pattern
Recognition 42 (9), pages 2169-2180.
Levine, D., Richard, J., and Whittle M., 2012. Gait
Analysis, 5
th
Edition, Oxford: Elsevier.
Lu, H., Huang, J., Saha, T., Nachman, L., 2014.
Unobtrusive Gait Verification for Mobile Phones
ISWC 14, Sept. 13-17, Seattle, USA.
Matovski, D., S., Nixon, M., S., Mahmoodi, S., Carter, J.,
N., 2012. The Effect of Time on Gait Recognition
Performance, [online] Available: http://
eprints.soton.ac.uk/271945/3/IEEETIFS2012.pdf
(Accessed 26 August 2014).
Muaaz, M., Nickel, C., 2012. Influence of Different
Walking Speed and Surfaces on Accelerometer-Based
Biometric Gait Recognition, [online] Available:
http://www.usmile.at/sites/default/files/publications/06
256346.pdf (Accessed 26 August 2014).
Nambiar, A. M, Correira, P., Soares, L.D., 2012. Frontal
Gait Recognition Combining 2D and 3D Data,
MM&Sec 2012, Sept. 6-7, Coventry, UK.
Schloeglhofer, R., Sametinger, J., 2012. Secure and
Usable Authentication on Mobile Devices,
MoMM2012, 3-5 December, 2012, ACM.
Thang, H., M., Viet, V., Q., Thusc, N., D., Choi, D., 2012.
Gait Identification Using Accelerometer on Mobile
Phone [online] Available: http://ieeexplore.ieee.org/
xpl/login.jsp?tp=&arnumber=6466615&url=http%3A
%2F%2Fieeexplore.ieee.org%2Fxpls%2Fabs_all.jsp%
3Farnumber%3D6466615 (Accessed the 25th of
August 2014).
ICISSP2015-1stInternationalConferenceonInformationSystemsSecurityandPrivacy
328
