
A Multi-resolution Approach for Combining Visual Information using
Nuclei Segmentation and Classification in Histopathological Images
Harshita Sharma
1
, Norman Zerbe
2
, Daniel Heim
2
, Stephan Wienert
3
, Hans-Michael Behrens
2,4
,
Olaf Hellwich
1
and Peter Hufnagl
2
1
Computer Vision and Remote Sensing, Technische Universit
¨
at Berlin, Marchstr.23, MAR 6-5, 10587, Berlin, Germany
2
Department of Digital Pathology and IT, Institute of Pathology, Charit
´
e - Universit
¨
atsmedizin Berlin, Berlin, Germany
3
VMscope GmbH, Berlin, Germany
4
Department of Pathology, Christian-Albrechts University, Kiel, Germany
Keywords:
Histopathology, H&E, Gastric Cancer, Nuclei segmentation, Virtual microscopy, Image analysis, Multi-
resolution, AdaBoost.
Abstract:
This paper describes a multi-resolution technique to combine diagnostically important visual information at
different magnifications in H&E whole slide images (WSI) of gastric cancer. The primary goal is to improve
the results of nuclei segmentation method for heterogeneous histopathological datasets with variations in stain
intensity and malignancy levels. A minimum-model nuclei segmentation method is first applied to tissue
images at multiple resolutions, and a comparative evaluation is performed. A comprehensive set of 31 nuclei
features based on color, texture and morphology are derived from the nuclei segments. AdaBoost classification
method is used to classify these segments into a set of pre-defined classes. Two classification approaches
are evaluated for this purpose. A relevance score is assigned to each class and a combined segmentation
result is obtained consisting of objects with higher visual significance from individual magnifications, thereby
preserving both coarse and fine details in the image. Quantitative and visual assessment of combination
results shows that they contain comprehensive and diagnostically more relevant information than in constituent
magnifications.
1 INTRODUCTION
Gastric cancer is the fourth leading cancer and the
second most common cause of cancer-related deaths
worldwide. According to World Health Organiza-
tion, it causes approximately 800,000 deaths each
year. Gastric cancer is the accumulation of an ab-
normal group of cells, either malignant or cancer-
ous, which form a tumor in the stomach (Nordqvist,
2013). Histologically, the most commonly occurring
type of gastric malignancy is adenocarcinoma (90-
95%), which starts in the mucous-producing cells on
the inner lining of stomach and tends to invade the
gastric wall aggressively, infiltrating muscularis mu-
cosa, submucosa, and then muscularis externa. Some
other types of gastric cancer include lymphomas (1-
5%), gastrointestinal stromal tumor (2%), carcinoids
(1%), adenoacanthomas (1%), and squamous cell car-
cinomas (1%) (Cabebe and Mehta, 2008).
Histological image analysis was initially explored
by Bartels (Bartels et al., 1992), Hamilton (Hamil-
ton et al., 1994) and Weind (Weind et al., 1998), but
has been a neglected area of research due to special-
ized acquisition process and lack of computational
resources. However with rapid growth of computer-
aided techniques, histological image analysis systems
have seen recent developments. Most techniques uti-
lize texture, color and morphological features on dif-
ferent kinds of histological images such as in (Shut-
tleworth et al., 2002a), (Diamond et al., 2004), (Roula
et al., 2002), (Rani et al., 2010) for applications
of cancer classification, grading or tissue analysis.
However, performance of the state-of-the-art analysis
techniques varies depending on datasets with specific
magnification and malignancy levels, hence, is insuf-
ficient for heterogeneous histological datasets. There-
fore, an appropriate improvement in this direction can
be the use of multi-resolution methods. A multi-
resolution texture analysis technique is used in (Shut-
tleworth et al., 2002b) for classifying colon cancer im-
37
Sharma H., Zerbe N., Heim D., Wienert S., Behrens H., Hellwich O. and Hufnagl P..
A Multi-resolution Approach for Combining Visual Information using Nuclei Segmentation and Classification in Histopathological Images.
DOI: 10.5220/0005247900370046
In Proceedings of the 10th International Conference on Computer Vision Theory and Applications (VISAPP-2015), pages 37-46
ISBN: 978-989-758-091-8
Copyright
c
2015 SCITEPRESS (Science and Technology Publications, Lda.)
ages that focuses on varying distances of texture co-
occurrence matrix instead of spatial resolution, and
does not include isolation of nuclei before classifi-
cation. Our work, on the other hand, emphasizes
on object-oriented classification of nuclei segments
in gastric cancer images based on their texture, in-
tensity and morphological characteristics. A multi-
resolution approach is also reported in (Kong et al.,
2009) for neuroblastoma images where higher mag-
nification is considered only when the results from
lower magnifications are unsatisfactory, using a feed-
back loop involving pathologists. It is intuitive that
highest amount of useful information should be con-
tained in higher magnifications, but it is also impor-
tant to observe the ratio between the relevant and ir-
relevant information and how to differentiate between
them. So we consider all resolutions simultaneously
and perform visual and quantitative assessment to ver-
ify our assumption. Another related work reports
a multi-class and two-stage classification of Wright
stained WBCs (Ramesh et al., 2012). In the first stage,
cells are classified as ones with segmented and non-
segmented nucleus, and in the second stage as one
of the five subtypes. We also address a similar clas-
sification problem, but use distinct classification ap-
proaches on gastric cancer images that differ in cell
types and staining method. Further, we are motivated
to work with gastric cancer specimens as negligible
work has been done in their computer-based histolog-
ical image analysis and it is still an emerging topic
which needs to be explored.
Segmentation is a crucial and challenging step in
most histological image analysis problems. Perfor-
mance of subsequent tasks like feature extraction and
classification largely depends on the results of the
segmentation algorithm. It is difficult mainly due to
the complex appearance of cells. When a tissue sec-
tion is digitally scanned using a single focal plane,
the scanner focuses on one two-dimensional layer in
the region of interest, however, as the tissue section
is three-dimensional it leads to unfocused neighbor-
ing cells, thereby creating overlaps and unclear cell
boundaries in the resulting digital image. Another
factor is the cutting direction during slide preparation.
Hence, manual and automatic segregation of cell nu-
clei is a tedious process. Our work aims to address
this challenge by using a multi-resolution approach
to combine segmentation results at different magni-
fications in order to obtain better results for further
analysis.
The human epidermal growth factor 2 (Her2) gene
is a proto-oncogene whose high amplification causes
a protein overexpression in cell membrane of a ma-
lignant cell, leading to abnormal cell division and
growth (Chua and Merrett, 2012). It has been most
widely studied in breast cancers. Neu is a pro-
tein which is encoded by the Her2 gene in humans.
Her2/neu has been recently introduced as a predictive
biomarker for gastric cancer. Her2/neu staining in-
volves higher costs and is still not common in labora-
tory practice. Haematoxylin and eosin (H&E) stain is
used routinely in histological examinations because it
provides a detailed view by clearly staining the tissue
components, is simpler to apply and less costly (Ban-
croft and Gamble, 2008). For this study, Her2/neu and
H&E stained images were available but we have de-
veloped our methods for H&E stained tissue sections
because of their wider usability and lower preparation
costs.
The organization of the paper is as follows: In
section 2 we describe the methodology of our work.
Section 3 describes the materials used, data prepara-
tion and technical details. Section 4 includes results
and discussion, and Section 5 concludes the paper and
presents the future directions of our research.
2 METHODOLOGY
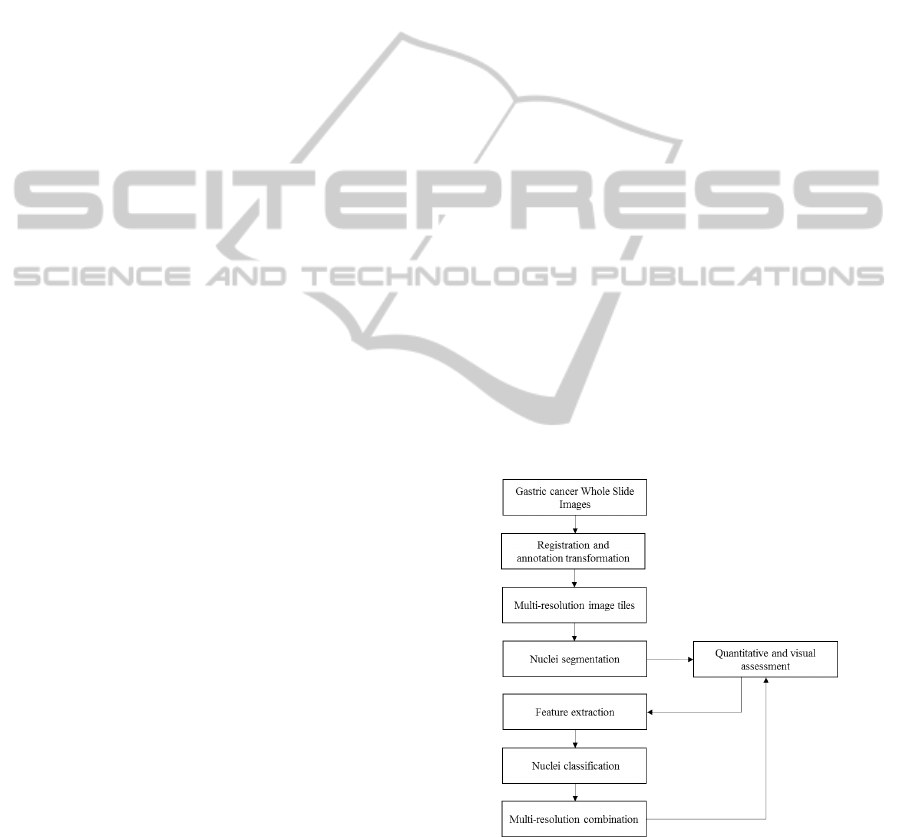
2.1 System Overview
An overview of our system is provided in Figure 1.
Firstly, the WSI specimens are registered to transform
Figure 1: System overview.
annotations of pathologists from Her2/neu to H&E
stain. This is followed by segmentation of nuclei
components in H&E stained images, and their feature
extraction. The features are used to train AdaBoost
classification algorithm and results obtained are uti-
lized to combine image data at different magnifica-
VISAPP2015-InternationalConferenceonComputerVisionTheoryandApplications
38
tions for enhanced segmentation results. The whole
system is evaluated quantitatively and visually at dif-
ferent stages to assure its usability.
2.2 Image Registration
Our image dataset consists of surgical specimens in
Her2/neu and H&E stains. Expert pathologists have
annotated only the Her2/neu specimens (details in
Section 3.1). Therefore, it is required to transform
annotations of pathologists from Her2/neu slides into
corresponding annotations in H&E slides for further
experiments. Difference between slices in two stains
is not negligible; hence corresponding WSI speci-
mens are first registered semi-automatically. Using
the registration information, coordinates of polygon
annotations of pathologists from Her2/neu slide are
transformed into destination coordinates in H&E slide
using local affine transformation for all points inside
a convex hull of point cloud, and global rigid trans-
formation for all points lying outside the cloud, us-
ing Singular Value Decomposition method (Amidror,
2002). Different marked polygon areas from WSI
specimens are tessellated at different magnifications
ranging from 10x to 40x, the tile with highest magni-
fication of size 1024 × 1024. As pathologists’ anno-
tations are not completely overlapping, the selected
tissue areas are enclosed in maximum annotations,
ensuring agreement of most pathologists to minimize
inter-observer variability.
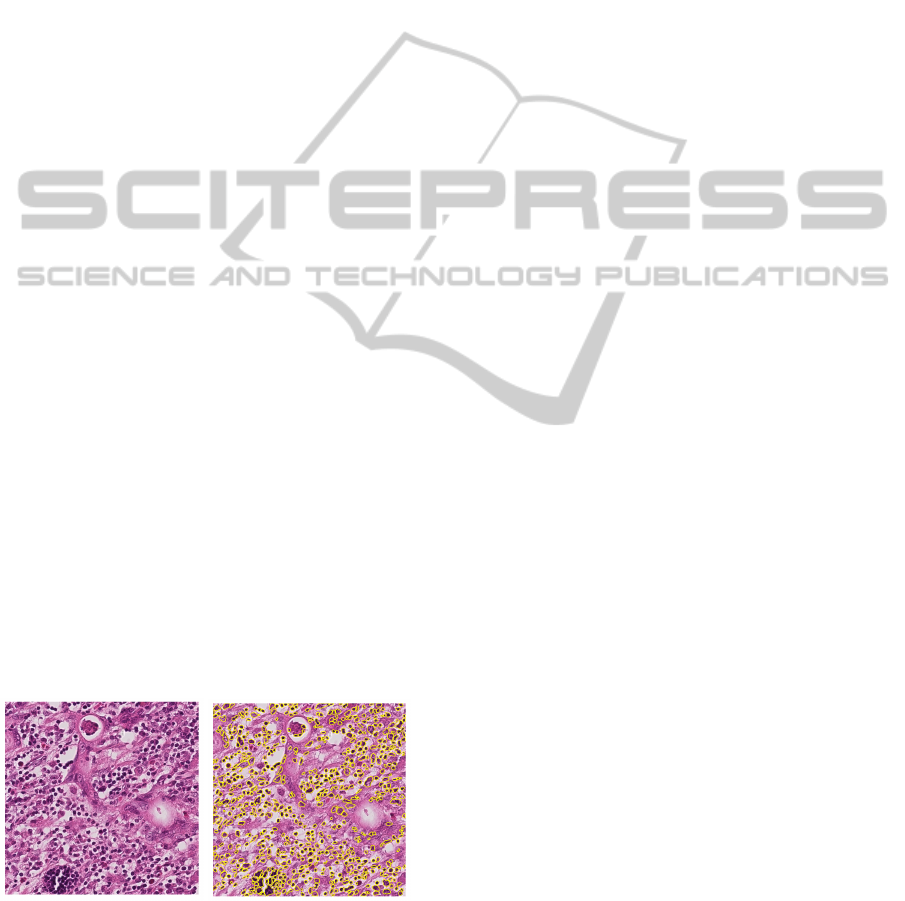
2.3 Nuclei segmentation
In the nuclei segmentation step, a minimum-model
method consisting of six main steps (Wienert et al.,
2012) is applied to isolate the nuclei at each magnifi-
cation. It is a fully automatic approach, and yields a
result like the one shown in Figure 2.
(a) (b)
Figure 2: Nuclei segmentation result example at 25x mag-
nification (a) Original image (b) Image showing nuclei seg-
ments.
2.4 Nuclei Feature Extraction
In this step, object-based feature extraction is per-
formed where features are computed on image ob-
jects, in our case being the nuclei segments. A fea-
ture vector of 31 nuclei features based on color, tex-
ture and morphology are extracted from segments, as
described below. A listing of the feature types consid-
ered in this work is summarized in Table 1.
2.4.1 Intensity-based Features
Intensity-based features are important for histologi-
cal images due to the specific stains used. The fea-
tures used to characterize the intensity of segments
in our work include Mean Intensity, Mean Intensity
on Contour, Standard Deviation of Intensity, Standard
Deviation of Intensity on Contour (Hufnagl et al.,
1984), Contour Value and Gradient Fit (Wienert et al.,
2012). Mean Chromaticity is also calculated, where
chromaticity for i
th
RGB pixel p
i
is defined as the
minimum euclidean distance d
min
between pixel RGB
value and points on the diagonal where each point
p
d
is defined by RGB value R = G = B = x,x ∈
{0,1, ..255}. In other words, it is the minimum eu-
clidean distance of a pixel to a grey pixel value, as
given in (1).
d
min
(p
i
,p
d
) = min(kp
i
− p
d
k) p
i
,p
d
∈ IR
3
(1)
2.4.2 Morphological Features
Shape or morphological properties are used by pathol-
ogists to identify or distinguish between different
types of nuclei components. In our experiments, we
use the following morphological features: Object Pix-
els, Minimum Distance to Tessellation Border, Pix-
els at Layer Border, Maximum Distance to Border,
Aspect Ratio of Bounding Ellipsoid, Minor Axis of
Bounding Ellipsoid, Major Axis of Bounding Ellip-
soid, Angle of Bounding Ellipsoid, Form Factor of
Contour, Convexity of Contour, Length of Contour,
Area of Contour, Form Factor of Convex Hull, Length
of Convex Hull, Area of Convex Hull (Hufnagl et al.,
1984), Feret, Minimal Radius of Enclosing Centered
Circle, Maximal Radius of Enclosed Centered Circle,
Roundness and Form Factor (Zerbe, 2008).
2.4.3 Texture Features
Texture is also a widely used characteristic in histo-
logical image analysis, and varies with different tissue
components. We have selected the features contrast,
energy, entropy and homogeneity to represent texture
of nuclei segments. These are a subset of the Haralick
GLCM features (Haralick et al., 1973).
AMulti-resolutionApproachforCombiningVisualInformationusingNucleiSegmentationandClassificationin
HistopathologicalImages
39
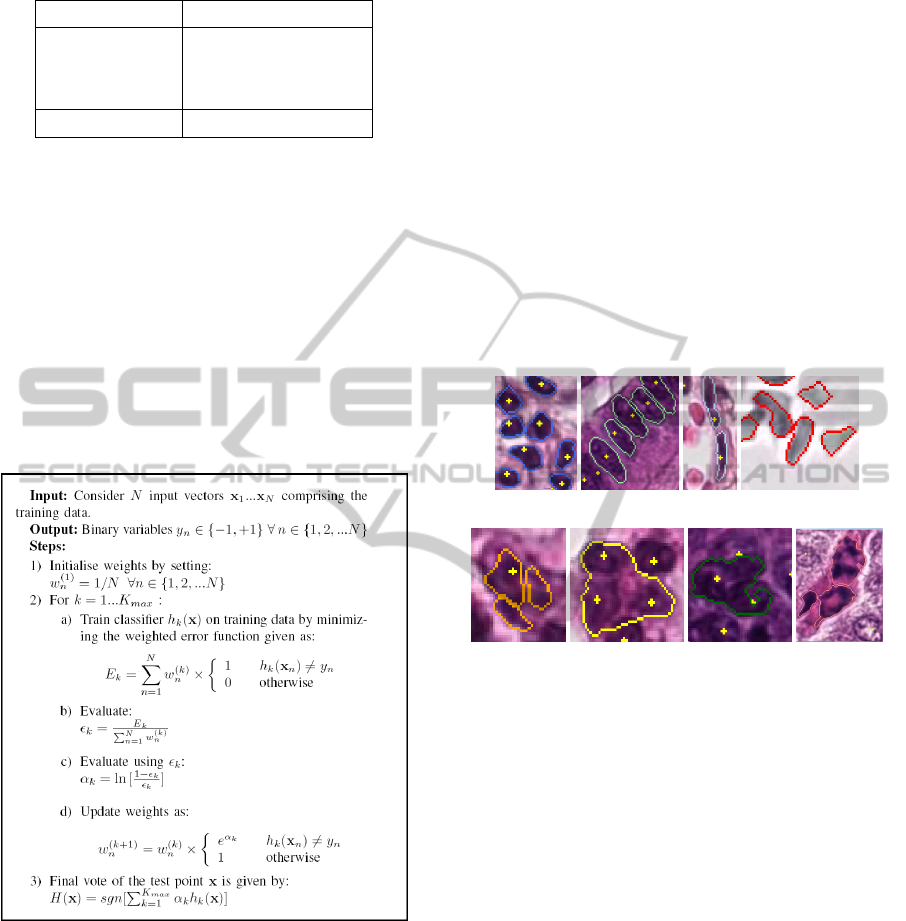
Table 1: Summary of nuclei features.
Feature type Number of features
Intensity-based 7
Morphological 20
Texture 4
Total 31 nuclei features
2.5 AdaBoost Classification
The segments are automatically classified into
eight different classes using AdaBoost classification
method (Bishop, 2006) (See Figure 4 for description
of nuclei classes). A multi-class AdaBoost classi-
fication algorithm has been developed for this task.
AdaBoost or Adaptive Boosting is the most widely
used form of boosting. Boosting involves ensemble
learning where a collection of component classifiers
or learners is used and a joint decision is taken by
combining their predictions. AdaBoost allows adding
Figure 3: AdaBoost algorithm.
a sequence of weak learners to the algorithm, un-
til a desired low training error is achieved. Each
weak learner corresponds to a simple decision stump.
The ensemble of weak learners can be defined as
h
k
(x),k = 1,2,..., K
max
, where K
max
= 15 is used in
our algorithm. The strong learner is assembled from
all weak learners through a weighted majority vot-
ing scheme. The AdaBoost algorithm for a two-class
classification problem is given in Figure 3.
We extend the two-class classification algorithm
to multi-class by considering the final vote as the class
with majority votes of weighted binary learners. A
boosting algorithm like AdaBoost involving a combi-
nation of classifiers is proposed as a new direction for
improving performance of individual classifiers like
kNN, Naive Bayes and SVM (Kotsiantis et al., 2007).
AdaBoost is also found to be easier to implement than
other maximal margin classifiers like SVM. Further,
SVM is not robust to irrelevant descriptors, hence,
not suitable to use without feature selection (Chen and
Lin, 2006), however our method considers all 31 nu-
clei features equally. This explains the choice of ini-
tially selecting the AdaBoost algorithm for the clas-
sification task. A comparison of the performance of
different classification methods on our image dataset
is beyond the scope of the work presented in this pa-
per and a recognized future direction.
(a) (b) (c) (d)
(e) (f) (g) (h)
Figure 4: Examples of segments with defined nuclei classes
(a) Leukocytes (b) Epithelial nuclei (c) Fibrocytes/border
cells (d) Other nuclei (including blood cells in vessel) (e)
Nuclei fragments (f) Cluster of nuclei (g) Badly segmented
nucleus (h) Artefacts.
Definitions of the multiple nuclei classes have
been previously approved by pathologists. These are
leukocyte, epithelial nucleus, fibrocyte/border cell,
other nuclei (including blood cells in vessel), cluster
of nuclei, nuclei fragment, badly segmented nucleus
and artefact. Figure 4 illustrates the nuclei classes.
In order to obtain optimum results, we have evalu-
ated two classification approaches. The first approach
performs a single stage classification of segments into
one of the eight classes. In the second approach,
a two-stage classification is performed. The first
stage classifies the segments into three broad classes
namely compact objects including epithelial nuclei,
leukocytes, fibrocytes/border cells, other nuclei and
nuclei fragments; conglomerates including clusters of
nuclei and badly segmented nuclei, and artefacts. In
the second stage, each class objects are further clas-
sified into one of the respective subclasses. Figure 5
shows the hierarchy of classes used in this approach.
VISAPP2015-InternationalConferenceonComputerVisionTheoryandApplications
40
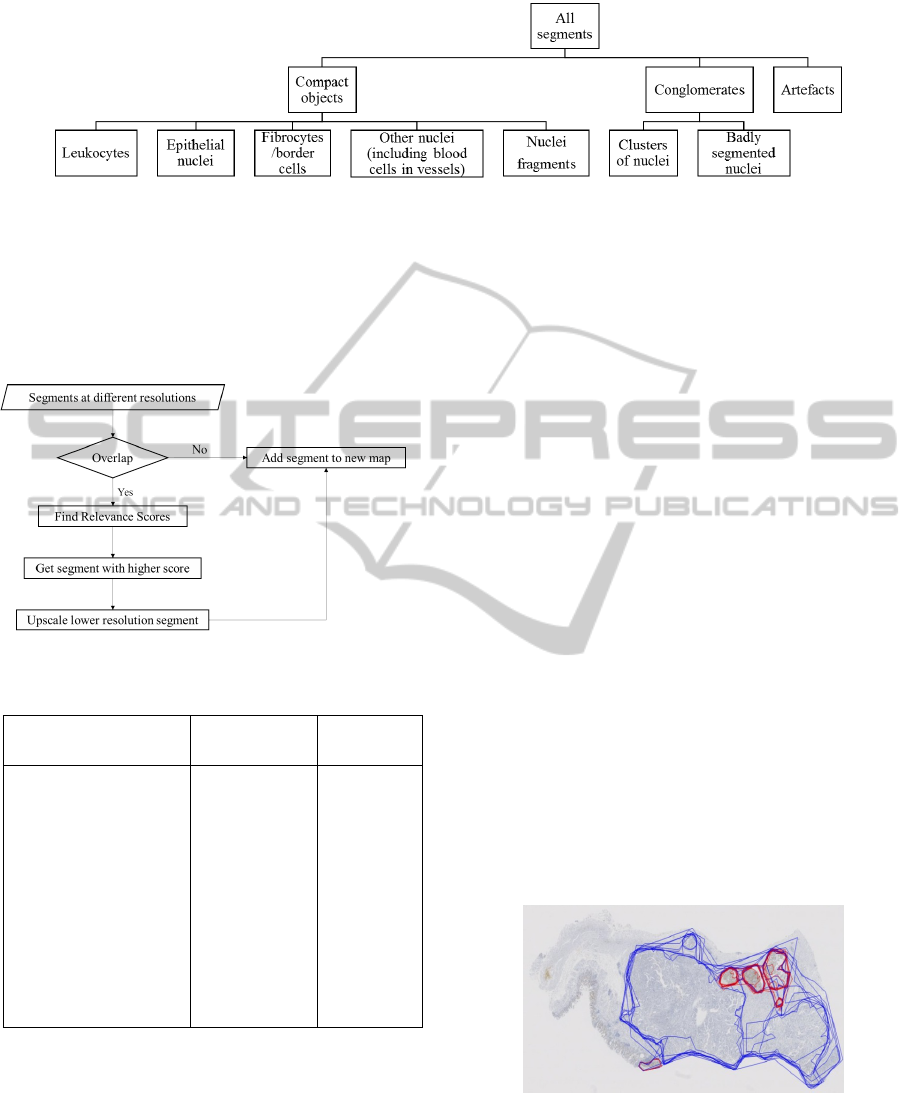
Figure 5: Hierarchy of classes in multi-stage classification approach.
2.6 Multi-resolution Combination
To combine the segmentation results of different mag-
nifications, the procedure depicted in Figure 6 is used.
A relevance score is assigned to each segment de-
Figure 6: Multi-resolution combination method.
Table 2: Relevance scores.
Class Diagnostic
significance
Relevance
Score
Epithelial nucleus Highest 100
Leukocyte Very high 80
Cluster of nuclei High 60
Fibrocyte/border
cell
Medium
high
50
Other nuclei Medium 20
Nuclei fragment Medium low 10
Badly segmented
nucleus
Low 5
Artefact Lowest 0
pending on its class. The scoring is relative, depend-
ing on which information is visually more signifi-
cant for diagnostic purpose, as given in Table 2. A
new segmentation map is obtained with segments of
higher visual importance from individual constituent
magnifications. It should be specified that a map is
a data structure that is used to store spatial positions
of image objects after segmentation. It encapsulates
a two dimensional array of unsigned integers that has
the size of the input image, where the unsigned inte-
gers are the identifiers of the corresponding segment
of a given pixel. The segmentation map has the high-
est resolution, and contours of lower magnification
are upscaled and added to the map. Hence, by using
the classification results of segments at different mag-
nifications, a more accurate combined segmentation
result is obtained, containing more useful information
than individual ones.
3 EXPERIMENTS
3.1 Materials
Her2/neu immunohistochemically stained and H&E
stained surgical specimens of 12 cases (one speci-
men per case) were selected from a previous study
of 483 cases of gastric cancer, acquired from proxi-
mal or distal parts of stomach. These were scanned
using a Leica SCN400 microscopic whole-slide scan-
ner at its maximum, nominally 400 times magnifi-
cation with pixel size 0.0676 µm
2
. Whole slide im-
ages were exported from the scanner system into files
of SCN format, which is a multi-image, pyramidal
multi-resolution 64-bit TIFF format. Example of a
typical Her2/neu stained WSI is shown in Figure 7.
Figure 7: Example of a Her2/neu stained gastric cancer WSI
specimen containing pathologists’ annotations.
Each Her2/neu WSI specimen contains polygon
annotations made by ten expert pathologists. These
consist of Her2/neu positive areas marked by using
the 10% cut-off rule (Warneke et al., 2013), with the
AMulti-resolutionApproachforCombiningVisualInformationusingNucleiSegmentationandClassificationin
HistopathologicalImages
41
help of a digital microscopy software. The annota-
tions also contain Her2/neu negative areas those were
morphologically identified as tumor areas in the tissue
by pathologists. Her2/neu positive areas define a high
degree of malignancy, whereas Her2/neu negative ar-
eas denote a low malignancy level. The remaining
areas of the tissue are widely necrotic tissue regions.
3.2 Dataset Preparation
The WSI specimens were acquired in SCN format
and the corresponding annotations in vmpi01 format.
Size of each whole slide image file is approximately 3
GB. The SCN files were converted into VSF (Virtual
Slide Format) and the corresponding annotations to
vmsm files which are XML-formatted metafiles con-
taining metadata about the slides, one of them being
annotations. These data formats are suitable for ac-
cessing whole slide image data using the VMscope
software support (VMscope GmbH, 2010). Cogni-
tionMaster (Wienert et al., 2013), an object-oriented
analysis framework, has been used for user interaction
with tissue images, especially to create ground truth
data for segmentation evaluation and training data for
classification purpose.
3.3 Technical Details
Different modules of our methodology have been im-
plemented in C# programming language, and tested
on a system with Intel Core i7-3700 processor at 3.40
GHz and with 16 GB RAM. The total processing time
for the training and classification steps is around 15-
20 minutes for a training dataset containing approx-
imately 6000 nuclei segments, using the AdaBoost
classification algorithm. Each of the segmentation
and multi-resolution combination steps requires less
than a minute for a tile of size 1024 x 1024 pixels.
4 RESULTS AND DISCUSSION
4.1 Result Overview
Nuclei segmentation results of different magnifica-
tions from 10x to 40x are quantitatively and visually
analyzed. Desired results are observed for the higher
magnification 30x and full magnification 40x. It is
also observed that there is a transition from clustering
to fragmentation as we proceed from lower to higher
magnifications. Two classification approaches have
been evaluated. An average multi-class accuracy of
57.5% is achieved in the single stage approach and
58.8% for the multi-stage approach. The first stage of
multi-stage approach classifies compact objects (in-
cluding cell nuclei), conglomerates and artefacts with
an average accuracy of 85.6%, as required for our
task. Quantitative and qualitative analysis of com-
bined segmentation results shows that they contain
more comprehensive information than individual con-
stituent magnifications.
4.2 Nuclei Segmentation Evaluation
To evaluate the performance of the segmentation al-
gorithm on the given dataset at different magnifica-
tions, five slides of varying stain intensities were ini-
tially selected for segmentation. 15 tiles per slide
were selected with different degrees of malignancy,
using pathologists’ annotations. The nuclei were
manually located with point annotations to create
Ground Truth which was verified by expert pathol-
ogists. The tiles were annotated at highest resolution
(40x). Each tile was automatically segmented at the
selected magnifications of 10x, 15x, 20x, 25x, 30x,
and 40x. The segmentation results were compared
against the ground truth data. The following quan-
tities were measured and compared: total number of
manual annotations, number of segments found, num-
ber of nuclei correctly segmented, number of nuclei
not segmented, number of segments not nuclei and
number of clusters. This comparison was done at
three levels: tile, slide and overall. Images containing
point annotations and contours of segments formed
automatically were also created for visual inspection
and comparison. The overall result can be summa-
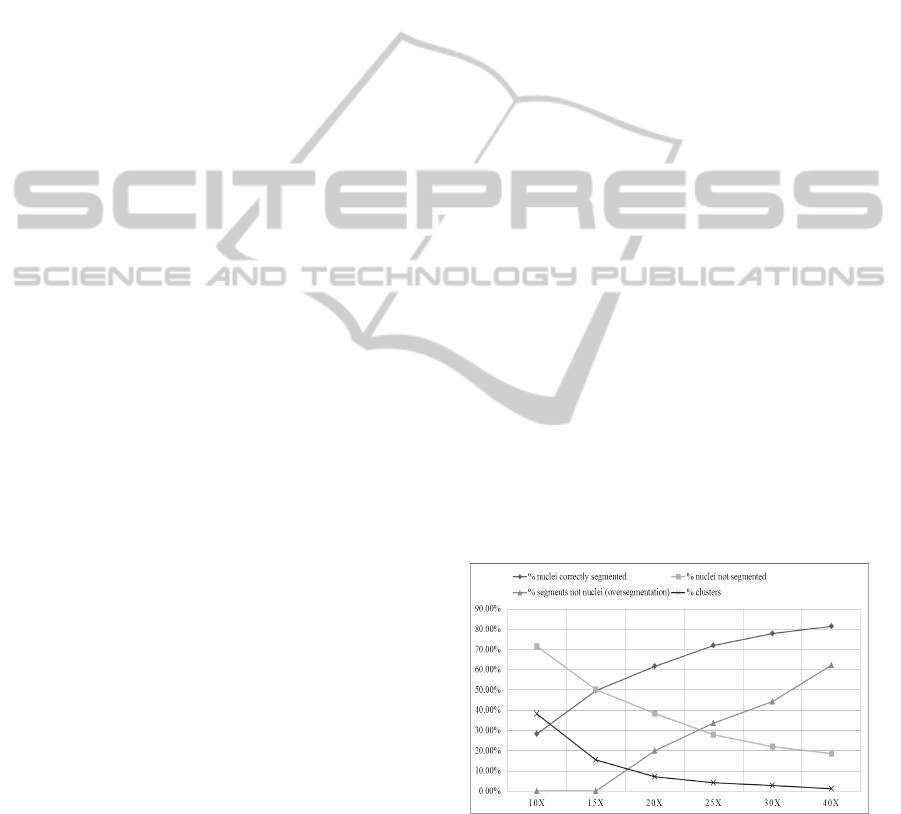
rized in the graph in Figure 8.
Figure 8: Nuclei segmentation performance at individual
magnifications.
From the results of the described coarse to fine
segmentation analysis, we observe that the percentage
of correctly segmented nuclei increases with magni-
fication. These are found by counting the segments
which also contain point annotations and are marked
as nuclei in the ground truth data. Also, oversegmen-
VISAPP2015-InternationalConferenceonComputerVisionTheoryandApplications
42

Table 3: Single stage classification: 30x.
Leukocyte Epithelial
nucleus
Fibrocyte/
border
cell
Nuclei
Fragment
Other
nuclei
Cluster
of
nuclei
Badly
segmented
nucleus
Artefact All
classes
Round1 75.00% 69.82% 59.69% 46.86% 29.61% 63.31% 16.36% 33.90% 55.71%
Round2 80.47% 72.24% 60.12% 44.62% 28.74% 56.89% 13.46% 24.37% 56.52%
Round3 81.79% 76.15% 62.61% 50.60% 23.81% 55.78% 16.67% 25.38% 58.09%
Overall 79.20% 72.70% 60.80% 47.40% 27.55% 58.50% 15.61% 27.79% 56.78%
Table 4: Single stage classification: 40x.
Leukocyte Epithelial
nucleus
Fibrocyte/
border
cell
Nuclei
Fragment
Other
nuclei
Cluster
of
nuclei
Badly
segmented
nucleus
Artefact All
classes
Round1 81.42% 75.24% 60.74% 47.37% 38.12% 51.38% 14.49% 40.98% 57.80%
Round2 77.59% 74.71% 67.74% 48.50% 35.16% 55.56% 16.98% 36.36% 58.69%
Round3 78.29% 77.71% 59.53% 49.85% 39.92% 53.33% 26.09% 40.63% 58.43%
Overall 79.10% 75.90% 62.50% 48.60% 37.84% 53.48% 18.45% 39.38% 58.31%
tation (segments not nuclei) increases with magnifica-
tion. It has been calculated for an image using (2).
N
ns
= N
t
− N
s
(2)
where N
ns
denotes number of segments not nuclei,
N
t
is the total number of segments found and N
s
is
the number of segmented nuclei. No oversegmen-
tation for 10x and 15x magnifications indicates that
the number of nuclei are equal to or greater than the
number of segments, which means that same segment
corresponds to one or more manually annotated nu-
clei. The number of clusters, which are segments con-
taining more than one point annotation, decrease with
magnification. In order to preserve the fine details in
images, and to capture the maximum number of nu-
clei correctly identified, one choice is the full magni-
fication 40x. However, to deal with the problem of
oversegmentation and fragmentation evident mostly
in 40x, it should be combined with a lower magni-
fication to get more accurate results. For identifying
which of the lower magnifications is suitable for com-
bining with 40x, a pairwise comparison of results was
made between 40x and each of the lower magnifica-
tions. The aim was to find the percentage of correctly
segmented nuclei in lower magnifications which can
contribute to the total correctly segmented nuclei in
addition to 40x. It is calculated as given in (3).
Additional contribution o f X = (N
sx
− N
sc
)/N
m
(3)
where N
sx
denotes the number of correctly segmented
nuclei found at magnification X, N
sc
is the number of
correctly segmented nuclei common in magnification
X and 40x, and N
m
is the number of manually anno-
tated nuclei in the image. It is found almost equal
(≈ 5%) for magnifications between 15x to 30x. It
is lower for 10x (≈ 4%). The other factor used for
deciding the other magnification is clustering. It is
already found that clustering decreases with magni-
fication. In order to minimize it, we select the next
magnification with minimum clusters (2.8%) i.e. 30x.
Thus, after evaluating the results of nuclei seg-
mentation algorithm it was concluded that segmen-
tation information at 30x and 40x will be utilized
for further analysis. Combining information at the
level of segmentation itself is a non-trivial task, due
to which automatic classification of segments was re-
quired to be performed.
4.3 Classification Evaluation
One half of the segmented data was manually clas-
sified to prepare the training dataset, making a total
of 33 image tiles from five WSI specimens in each
magnification 30x and 40x, selected such that they
contain noticeable variation in stain and malignancy
level. A total of 5541 segments in 30x and 5730 seg-
ments in 40x were used for training the classification
algorithm. A 3-fold cross validation was performed to
validate the classification using both approaches, with
two-third segments considered as training data and re-
maining one-third as test data in every round. We en-
sured that there was no overlap between the training
and test data in each round. Validation results were
averaged over rounds and over classes.
We have compared the performance of the two
classification approaches. Table 3 and Table 4 show
the round-wise and overall accuracy using the first ap-
proach for 30x and 40x respectively. Using the second
AMulti-resolutionApproachforCombiningVisualInformationusingNucleiSegmentationandClassificationin
HistopathologicalImages
43
approach, the first stage accuracy for 30x is given in
Table 5 and for 40x in Table 6. The combined accu-
racy using this approach, after applying the two stages
in sequence (considering the error of the first stage),
is summarized in Table 7 and Table 8.
Table 5: First stage of multi-stage classification: 30x.
Compact
objects
Conglo-
merates
Artefacts All
classes
Round1 95.28% 51.63% 17.19% 84.79%
Round2 94.44% 57.71% 18.18% 86.36%
Round3 97.46% 52.38% 16.43% 86.19%
Overall 95.71% 53.83% 17.17% 85.78%
Table 6: First stage of multi-stage classification: 40x.
Compact
objects
Conglo-
merates
Artefacts All
classes
Round1 96.14% 52.70% 29.44% 86.49%
Round2 95.48% 53.99% 26.14% 85.55%
Round3 95.40% 51.45% 28.72% 84.61%
Overall 95.68% 52.69% 28.13% 85.55%
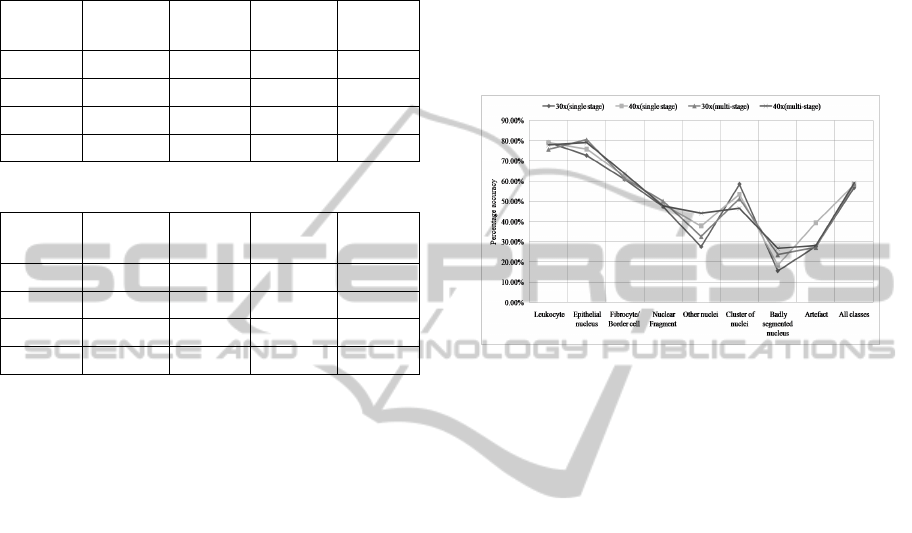
On comparing the performance of the two ap-
proaches (shown in Figure 9), we observe that the
overall performance is better for the multi-stage ap-
proach. In both approaches, the recognition rate for
leukocyte class is highest, followed by epithelial nu-
clei and fibrocytes/border cells, showing the compact-
ness of the classes and ability of our classification
method to strongly distinguish them based on the ex-
tracted feature set. However, for three classes namely
leukocytes, clusters of nuclei and artefacts, single
stage approach performs better than multi-stage ap-
proach. Poor performance is observed for the class
other nuclei, which can be explained as they contain
nuclei not visually clear in the images to be distin-
guished into a specific class and also include blood
cells in vessels, which have a very low occurrence.
Artefacts also have a lower recognition rate due to
lower number of instances, and absence of a well-
defined visual appearance. An average accuracy for
clusters could be explained by lower number of sam-
ples in the training dataset. The reason for a lower ac-
curacy of clusters in the multi-stage approach is due
to lower first stage accuracy of conglomerate class,
however it is to be specified that the second stage
accuracy for clusters is comparatively high (≈88%),
hence ways to improve first stage accuracy of class
conglomerates should be developed. We also note for
the second approach, the first stage accuracy is rela-
tively high for the compact objects class i.e. 95.7%,
which is a desired characteristic, as visually important
segments will be present mostly in this class. The nu-
clei fragments have a similar appearance with other
nuclei, and we also observe from generated confu-
sion matrices that they are misclassified as one of the
other compact objects in the second stage. In gen-
eral, the multi-stage approach has an overall better
and more stable performance and also the advantage
of providing a broad classification of segments using
the first classification stage, hence it outweighs the
single stage approach and we have considered it for
further experiments.
Figure 9: Single stage vs. multi-stage classification ap-
proach.
4.4 Multi-resolution Combination
Evaluation
The results of multi-resolution combination were
evaluated using the method described in Section 4.2.
The overall combination result can be summarized in
Figure 10. From the quantitative and visual evalua-
tion of the multi-resolution combination method, we
observe that the results are superior to individual mag-
nifications. Quantitatively, the percentage of correctly
segmented nuclei for combined results is higher and
percentage of nuclei not segmented is lower than in
each magnification 30x and 40x, showing the contri-
bution of segmented nuclei from both magnifications.
The percentage of clusters is also reduced. By visual
assessment of our results, we find that some nuclei
fragments in 40x have been replaced with correspond-
ing whole nuclei from 30x. Similarly, some clusters
in 30x are also replaced with individual nuclei in 40x.
However, one undesirable effect observed is the
number of segments not counted as nuclei (consid-
ered as oversegmentation) is slightly higher for com-
bination. A primary reason for this behavior is the
presence of fragments in this category, which do not
enclose point annotations denoting individual nuclei
in ground truth, and which have been retained due to
their misclassification as other types of nuclei within
the compact objects class. Dealing with this problem
and also finding a solution to handle nuclei fragments
VISAPP2015-InternationalConferenceonComputerVisionTheoryandApplications
44
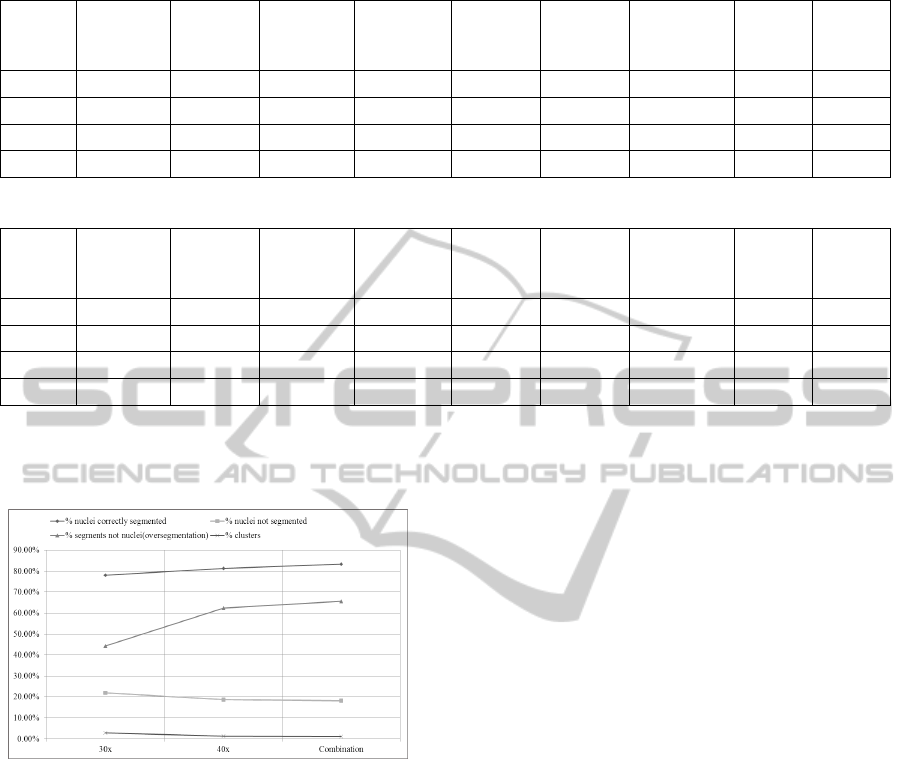
Table 7: Both stages of multi-stage classification: 30x.
Leukocyte Epithelial
nucleus
Fibrocyte/
border
cell
Nuclei
Fragment
Other
nuclei
Cluster
of
nuclei
Badly
segmented
nucleus
Artefact All
classes
Round1 76.83% 80.97% 60.16% 54.85% 34.47% 53.01% 20.96% 17.19% 59.38%
Round2 72.48% 82.04% 60.07% 43.65% 30.31% 46.93% 28.16% 18.18% 56.84%
Round3 77.75% 78.17% 63.75% 51.98% 32.95% 54.40% 20.88% 16.43% 58.51%
Overall 75.69% 80.45% 61.29% 50.13% 32.61% 51.38% 23.68% 17.17% 58.48%
Table 8: Both stages of multi-stage classification: 40x.
Leukocyte Epithelial
nucleus
Fibrocyte/
border
cell
Nuclei
Fragment
Other
nuclei
Cluster
of
nuclei
Badly
segmented
nucleus
Artefact All
classes
Round1 77.48% 83.54% 66.80% 44.21% 41.53% 49.07% 23.42% 29.44% 59.17%
Round2 80.31% 75.73% 61.76% 47.19% 44.38% 47.99% 28.28% 26.14% 58.43%
Round3 75.96% 77.94% 62.66% 52.36% 46.71% 43.00% 29.78% 28.72% 59.38%
Overall 77.91% 79.10% 63.69% 47.79% 44.22% 46.52% 26.74% 28.13% 59.15%
or clusters in both magnifications is a future direction
of our research.
Figure 10: Nuclei segmentation performance of combined
result vs. individual magnifications 30x and 40x.
5 CONCLUSIONS
In this paper, we have achieved improved nuclei seg-
mentation results from different magnifications by
combining their diagnostically useful and eliminating
their undesirable information, in haematoxylin and
eosin stained gastric cancer WSI specimens. In our
experiments, we have used a comprehensive dataset
of slides having different degrees of H&E stain. Fur-
ther, polygon areas marked by expert pathologists us-
ing Her2/neu immunohistochemical staining, define
varying levels of malignancy in the tissue. Hence,
our experimental results show that the approach can
be useful for deriving visual information from hetero-
geneous datasets, varying in degree of stain and ma-
lignancy. It should be noted that this paper presents
preliminary results of our baseline method.
Such visual information fusion will further assist
computer-aided analysis of cancer images which can
help pathologists in diagnosis-related tasks. Classifi-
cation accuracy can be improved by increasing data
size and incorporating neighbourhood information of
segments. In future, we aim to work in this direction
by using more sophisticated topological features, in-
cluding graph-theoretic description of gastric cancer
images. We also plan to perform a comparative anal-
ysis of various classification techniques on our dataset
and evaluate the performance of our methods on other
types of cancers. The focus is to retrieve and classify
tissue sections in a reliable way.
ACKNOWLEDGEMENTS
This work is supported with funds from the Ger-
man Academic Exchange Service (DAAD). The au-
thors are grateful to the Department of Pathology,
Christian-Albrechts University, for providing gas-
tric cancer WSI specimens for this study, especially
Dr.Christine B
¨
oger for performing review of the train-
ing data. We thank Mr.Bj
¨
orn Lindequist, Charit
´
e for
his contribution in the pre-processing stage. We also
thank Dr.Fredrich Klauschen, Charit
´
e for giving valu-
able suggestions on histological architecture to form
classes for subsequent analysis, and Ms.Iris Klem-
pert, Charit
´
e for reviewing point annotations of nuclei
in ground truth data. We sincerely thank VMscope
GmbH for providing suitable software tools to access
whole slide image data as required for our work.
AMulti-resolutionApproachforCombiningVisualInformationusingNucleiSegmentationandClassificationin
HistopathologicalImages
45

REFERENCES
Amidror, I. (2002). Scattered data interpolation methods for
electronic imaging systems: a survey. J. Electronic
Imaging, 11(2):157–176.
Bancroft, J. D. and Gamble, M. (2008). Theory and practice
of histological techniques. Elsevier Health Sciences.
Bartels, P., Thompson, D., Bibbo, M., and Weber, J. (1992).
Bayesian belief networks in quantitative histopathol-
ogy. Anal Quant Cytol Histol, 14(6):459–73.
Bishop, C. M. (2006). Pattern Recognition and Ma-
chine Learning (Information Science and Statistics).
Springer-Verlag New York, Inc., Secaucus, NJ, USA.
Cabebe, E. C. and Mehta, V. K. (2008). Gastric can-
cer. http://emedicine.medscape.com/article/278744-
overview#showall.
Chen, Y. W. and Lin, C. J. (2006). Combining SVMs with
various feature selection strategies. In Feature extrac-
tion, pages 315–324. Springer.
Chua, T. and Merrett, N. (2012). Clinicopathologic factors
associated with HER2-positive gastric cancer and its
impact on survival outcomes–a systematic review. Int
J Cancer, 130(12):2845–56.
Diamond, J., Anderson, N., Bartels, P., Montironi, R., and
Hamilton, P. (2004). The use of morphological char-
acteristics and texture analysis in the identification
of tissue composition in prostatic neoplasia. Human
Pathology, 35(9):1121–1131.
Hamilton, P., Anderson, N., Bartels, P., and Thompson, D.
(1994). Expert system support using bayesian be-
lief networks in the diagnosis of fine needle aspira-
tion biopsy specimens of the breast. J Clin Pathol,
47(4):329–36.
Haralick, R. M., Shanmugam, K. S., and Dinstein, I.
(1973). Textural features for image classification.
IEEE Transactions on Systems, Man and Cybernetics,
3(6):610–621.
Hufnagl, P., Schlosser, A., and Voss, K. (1984). Merkmale
der Form, Gr
¨
oβe und Lage digitaler objekte. Bild und
Ton., 37:293–298.
Kong, J., Sertel, O., Shimada, H., Boyer, K. L., Saltz, J. H.,
and Gurcan, M. N. (2009). Computer-aided evaluation
of neuroblastoma on whole-slide histology images:
Classifying grade of neuroblastic differentiation. Pat-
tern Recogn., 42(6):1080–1092.
Kotsiantis, S. B., Zaharakis, I., and Pintelas, P. (2007). Su-
pervised machine learning: A review of classification
techniques. In Emerging Artificial Intelligence Appli-
cations in Computer Engineering, pages 3–24. IOS
Press.
Nordqvist, C. (2013). What is Stomach Can-
cer? What is Gastric Cancer? Medi-
cal News Today. MediLexicon, Intl. http://
www.medicalnewstoday.com/articles/257341.php.
Ramesh, N., Dangott, B., Salama, M. E., and Tasdizen, T.
(2012). Isolation and two-step classification of normal
white blood cells in peripheral blood smears. Journal
of pathology informatics, 3.
Rani, S., Kannammal, A., Nirmal, M., Prabhu, K., and Ku-
mar, R. (2010). Multi-feature prostate cancer diagno-
sis of histological images using advanced image seg-
mentation. IJMEI, 2(4):408–416.
Roula, M., Diamond, J., Bouridane, A., Miller, P., and
Amira, A. (2002). A multispectral computer vi-
sion system for automatic grading of prostatic neopla-
sia. In Proceedings IEEE International Symposium on
Biomedical Imaging, pages 193–196.
Shuttleworth, J., Todman, A., Naguib, R., Newman, B., and
Bennett, M. (2002a). Colour texture analysis using co-
occurrence matrices for classification of colon cancer
images. In IEEE Canadian Conference on Electrical
and Computer Engineering, volume 2, pages 1134–
1139.
Shuttleworth, J., Todman, A., Naguib, R., Newman, B.,
and Bennett, M. (2002b). Multiresolution colour tex-
ture analysis for classifying colon cancer images. In
Medicine and Biology, 24th Annual Conference and
the Annual Fall Meeting of the Biomedical Engineer-
ing Society EMBS/BMES, Proceedings of the Second
Joint, volume 2, pages 1118,1119.
VMscope GmbH (2010). Vmscope products.
http://vmscope.com/produkte.html.
Warneke, V. S., Behrens, H., B
¨
oger, C., Becker, T., Lordick,
F., Ebert, M., and R
¨
ocken, C. (2013). Her2/neu test-
ing in gastric cancer: evaluating the risk of sampling
errors. Annals of Oncology, 24(3):725–733.
Weind, K., Maier, C., Rutt, B., and Moussa, M. (1998). In-
vasive carcinomas and fibroadenomas of the breast:
comparison of microvessel distributions–implications
for imaging modalities. Radiology, 208(2):477–83.
Wienert, S., Heim, D., Kotani, M., Lindequist, B., Sten-
zinger, A., Ishii, M., Hufnagl, P., Beil, M., Dietel, M.,
Denkert, C., and Klauschen, F. (2013). Cognitionmas-
ter: an object-based image analysis framework. Diag-
nostic Pathology, 8(1):1–8.
Wienert, S., Heim, D., Saeger, K., Stenzinger, A., Beil, M.,
Hufnagl, P., Dietel, M., Denkert, C., and Klauschen,
F. (2012). Detection and segmentation of cell nuclei
in virtual microscopy images: A minimum-model ap-
proach. Scientific Reports, 2.
Zerbe, N. (2008). Analyse serieller histologischer Schnitte
im Hinblick auf die automatische Bestimmung gle-
ichartiger Partikel benachbarter Schnittstufen. Diplo-
marbeit, Fachhochschule f
¨
ur Technik und Wirtschaft
Berlin.
VISAPP2015-InternationalConferenceonComputerVisionTheoryandApplications
46
