
Generative Training for 3D-Retrieval
Harald Grabner
1
, Torsten Ullrich
1
and Dieter W. Fellner
1,2
1
Institute of Computer Graphics and Knowledge Visualization (CGV), Technische Universit
¨
at Graz, Graz, Austria
& Fraunhofer Austria Research GmbH, Visual Computing, Vienna, Austria
2
Technische Universit
¨
at Darmstadt & Fraunhofer IGD, Darmstadt, Germany
Keywords:
Generative Modeling, Procedural Modeling, 3D-Retrieval, Machine Learning.
Abstract:
A digital library for non-textual, multimedia documents can be defined by its functionality: markup, indexing,
and retrieval. For textual documents, the techniques and algorithms to perform these tasks are well studied.
For non-textual documents, these tasks are open research questions: How to markup a position on a digitized
statue? What is the index of a building? How to search and query for a CAD model? If no additional, textual
information is available, current approaches cluster, sort and classify non-textual documents using machine
learning techniques, which have a cold start problem: they either need a manually labeled, sufficiently large
training set or the (automatic) clustering / classification result may not respect semantic similarity. We solve
this problem using procedural modeling techniques, which can generate arbitrary training sets without the
need of any “real” data.
The retrieval process itself can be performed with any method. In this article we describe the histogram
of inverted distances in detail and compare it to salient local visual features method. Both techniques are
evaluated using the Princeton Shape Benchmark (Shilane et al., 2004). Furthermore, we improve the retrieval
results by diffusion processes.
1 INTRODUCTION
Techniques for digitizing 3D shapes are currently be-
coming available to a wide audience. With more and
more data, questions of storage and archival arise –
especially for generalized documents (Fellner et al.,
2007). They should be treated analogue to ordinary
text documents, so that they can be inserted into a
digital library, which can be defined by its main func-
tions: indexing and retrieval (Havemann et al., 2012).
This paper presents and combines three important
ideas for content-based retrieval:
1. a new 3D model retrieval meta approach based on
generative modeling techniques to eliminate the
cold start problem (Ullrich and Fellner, 2011);
2. the method histogram of inverted distances by
(Grabner et al., 2014) to measure the similarity
of two 3D models;
3. an approach to improve retrieval results using dif-
fusion processes (Donoser and Bischof, 2013).
All these ideas and techniques are described in detail
and are combined to one retrieval system for 3D mod-
els.
A generative model describes a family of shapes,
a so-called shape space. We use this shape space to
randomly draw a number of samples. These training
samples are passed to a machine learning based clas-
sifier. Without needing any “real” data, our method
uses solely generative 3D models in the training
phase. Consequently, it eliminates the cold start prob-
lem. The generative models themselves are repre-
sented as JavaScript code, which takes a number of
parameters and returns a 3D model.
The used classifier is called histogram of inverted
distances. It is a geometry-based method that oper-
ates on volume models. In a preprocessing step, the
method converts the training samples to a voxel rep-
resentation, aligns their principal axes to the canon-
ical, Euclidean basis and calculates the inverted dis-
tance transformation of the volume model. The vol-
ume model is then split into a regular grid of cubes,
which we call cells. For each cell we determine
the histogram of inverted distances and learn a non-
parametric density function (Szeliski, 2010), (Bishop,
2007). The object class is represented by its genera-
tive model and its learned density function. In the
recognition phase the similarity is estimated using the
learned density function of the object class to test.
97
Grabner H., Ullrich T. and W. Fellner D..
Generative Training for 3D-Retrieval.
DOI: 10.5220/0005248300970105
In Proceedings of the 10th International Conference on Computer Graphics Theory and Applications (GRAPP-2015), pages 97-105
ISBN: 978-989-758-087-1
Copyright
c
2015 SCITEPRESS (Science and Technology Publications, Lda.)

The similarity of the whole model is given by the
product of all cell similarities. This method is able
to find similar objects. To illustrate its applicability,
we compare it to the established salient local visual
features method (Ohbuchi et al., 2008).
Using diffusion processes the retrieval results can
improved even further. The similarity between two
models can be calculated. If each model is compared
to each other, the resulting square matrix of differ-
ences/similarities is called the affinity matrix. Re-
trieving 3D models similar to the i-th model using the
affinity matrix only, is done by extracting the i-th row
and sorting this row by its values.
2 RELATED WORK
Our approach combines techniques of shape descrip-
tion and generative modeling with content-based re-
trieval and machine learning.
The main idea of generative modeling is the de-
scription of shapes using algorithms. An overview on
generative modeling techniques can be found in the
survey by Watson and Wonka (2008), in the overview
by Vanegas et al. (2010), as well as in the tutorial
notes “The Rules Behind – Tutorial on Generative
Modeling” (Krispel et al., 2014).
Concerning content-based retrieval, many meth-
ods for 3D models have been proposed recently.
Tangelder et al. (2008) and Bustos et al. (2007) have
both surveyed literature on content-based retrieval
methods. All methods can be classified according
to three categories: feature-based, graph-based and
geometry-based methods. Feature-based methods op-
erate on global (e.g. volume, area) or local (e.g. cur-
vature) properties. Graph-based methods calculate a
graph, such as a skeleton, based on the 3D model and
perform matching based on graphs. Geometry-based
methods operate directly on the models’ geometric
representation. For detailed explanation and repre-
sentative algorithms we refer the reader to the surveys
mentioned above.
For the training phase, the above mentioned meth-
ods need a given sample set. This introduces a cold
start problem: a sufficiently large data set has to be
tagged and classified manually (for training purposes)
or an unsupervised learning approach is used, which
may result in a classification that does not correspond
to the objects’ semantics or the classification used
in the respective field of application. Ullrich and
Fellner (2011) circumvent this problem by fitting gen-
erative models to the test data, so only the generative
models must be known in advance. We use the same
technique to span a shape space and to take a sample
set by random. This randomized subset is the input of
the training phase which uses histograms.
Shape histograms have previously been used by
Ankerst et al. (1999) to classify molecules; how-
ever their approach uses one global histogram per
molecule. Kriegel et al. (2003) also split their vox-
eled models into a regular grid of cells and calcu-
late features vectors per cell. In contrast to our ap-
proach, they do not use the histogram of inverted dis-
tances. The inverted distance transformation is used
by Dutagaci et al. (2005), and Kazhdan et al. (2003),
but they use discrete fourier transformation based de-
scriptors, radial cosine transformation based descrip-
tors or spherical harmonic representation based de-
scriptors for detection.
3 SHAPE DESCRIPTION
A possibility to describe a shape is realized by the
generative modeling paradigm (
¨
Ozkar and Kotsopou-
los, 2008), (Ullrich et al., 2010). The key idea is to en-
code a shape with a sequence of shape-generating op-
erations, and not just with a list of low-level geometric
primitives. In its practical consequence, every shape
needs to be represented by a program, i.e., encoded
in some form of programming language, shape gram-
mar (M
¨
uller et al., 2006), modeling language (Have-
mann, 2005) or modeling script (Autodesk, 2007).
Based on this idea each class of objects is repre-
sented by one algorithm M. Furthermore, each de-
scribed object is a set of high-level parameters x,
which reproduces the object, if an interpreter evalu-
ates M(x). As this kind of modeling resembles pro-
gramming rather than “designing”, it is obvious to
use software engineering techniques such as version-
ing and annotations. In this way, model M may con-
tain a human-readable description of the object class
it represents. In order to train a machine learning ap-
proach, the parameter domain D(M) is sampled ran-
domly using a uniform distribution. These random
models M(x
i
) are used in the training phase.
The generative models are implemented in
JavaScript and interpreted on-demand. The
scripts must implement the functions shapeName,
shapeDomain and shape. The first function returns
the name of a model, for example “car”; the second
function returns an array that contains the lower and
the upper bounds for every model parameter; the
shape function takes an array containing numerical
values and returns concrete 3D geometry represented
by an indexed face set.
The generative models illustrated in Figure 1 rep-
resent the object classes “sedan car” (left) and “com-
GRAPP2015-InternationalConferenceonComputerGraphicsTheoryandApplications
98
p
3
p
1
p
2
p
4
p
5
p
6
p
1
p
2
p
3
p
4
p
5
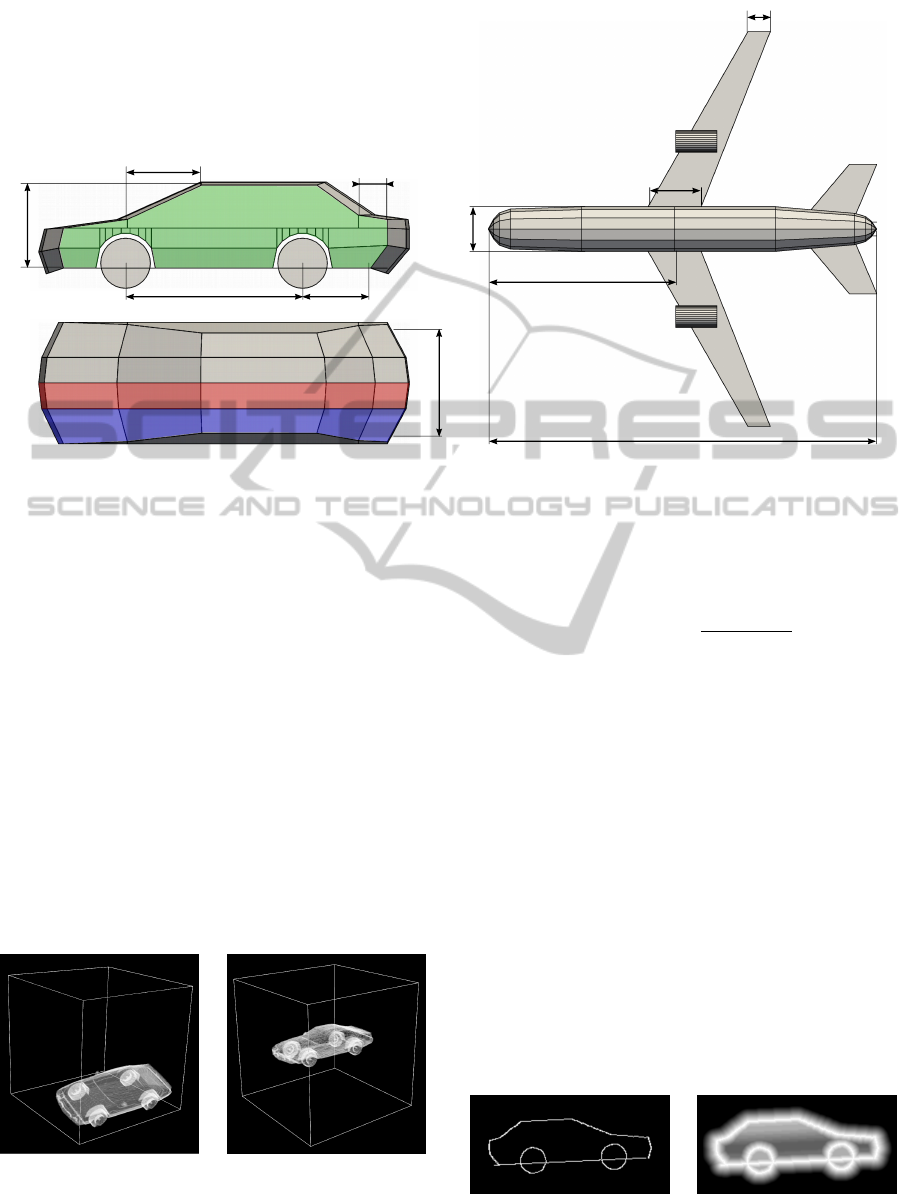
Figure 1: The generative description of the “sedan car” model (left) has six degrees of freedom. These parameters (p
1
,..., p
6
)
define the outer shape of the car. The description of the “commercial airplane” takes five parameters (p
1
,..., p
5
), whose
effects are visualized in this construction plan (right). The implementations consist of 350 (car) and 250 (plane) lines of
JavaScript code.
mercial airplane” (right). The car model takes six pa-
rameters, whereas the plane model takes five param-
eters. Both models generate and return a 3D model
with a fixed topology and varying geometry.
4 CONTENT-BASED RETRIEVAL
Histogram of Inverted Distances: For the training,
all training models are converted to a voxel repre-
sentation, scaled to a common size and aligned using
Principal Component Analysis (PCA) as illustrated in
Figure 2.
Afterwards, for each aligned training model T
i
the
inverted distance models are computed. The volume
Figure 2: Unaligned (left) and aligned (right) version of
a voxelized car model. The principal axes of the aligned
model are aligned to the canonical basis vectors and the
center of gravity of all aligned models is centered at
R
/
2
,
R
/
2
,
R
/
2
.
of the distance transformed training samples is de-
fined by
v(T
i
,x,y,z) = max
n
cut−d(T
i
,x,y,z)
cut
,0
o
,
with the Euclidean distance d(T
i
,x,y,z) of point
(x,y, z) to the model’s surface and a threshold value
cut. Due to the voxelization the inverted distances
can be calculated even for non-manifold and non-
watertight models. Any 3D geometry representa-
tion (point clouds, NURBS, etc.) can be used as
input data. Figure 3 shows the cross section of an
aligned voxeled training model (left) as well as its
corresponding inverted distance transformed version
(right).
In the next step several voxels are combined to one
cell C
i
and within each cell the histogram of inverted
distances with k bins is calculated. Having normal-
ized the histogram, it serves as a k-dimensional fea-
ture vector h
i
∈ [0,1]
k
of that cell. Based on the fea-
ture vectors h
i
we estimate a non-parametric density
function for each cell position (a,b,c) using Gaussian
kernel density estimation (Bishop, 2007). The density
Figure 3: The cross section of the aligned voxel model (top)
and the inverted distance model (bottom) of a car. The result
looks like a blurred image.
GenerativeTrainingfor3D-Retrieval
99
function for a cell at position (a,b,c) is
P(h
0
a,b,c
) =
1
n
∑
n
i=1
1
(2πσ
2
)
k/2
· exp
−
kh
0
a,b,c
−h
i
k
2
2σ
2
,
where h
0
is the feature vector of a test model and σ
represents the standard deviation of the Gaussian ker-
nel. Usually the standard deviation can be estimated
easily using appropriate estimation methods (Jones
et al., 1996).
In the recognition phase, the model to test is pro-
cessed the same way each training sample has been
processed: it is voxelized, scaled, PCA-aligned, dis-
tance transformed, combined to cells, and converted
into a k-dimensional feature vectures (for each cell)
using normalized histograms.
Let X be a test model and h
0
(a,b,c)
denote the
feature vectors of the test model, then the joint
probability of model X belonging to the learned class
is
∏
(a,b,c)∈(1...p)
3
P(h
0
(a,b,c)
). We call this algorithm
the histogram of inverted distances (HID) algorithm.
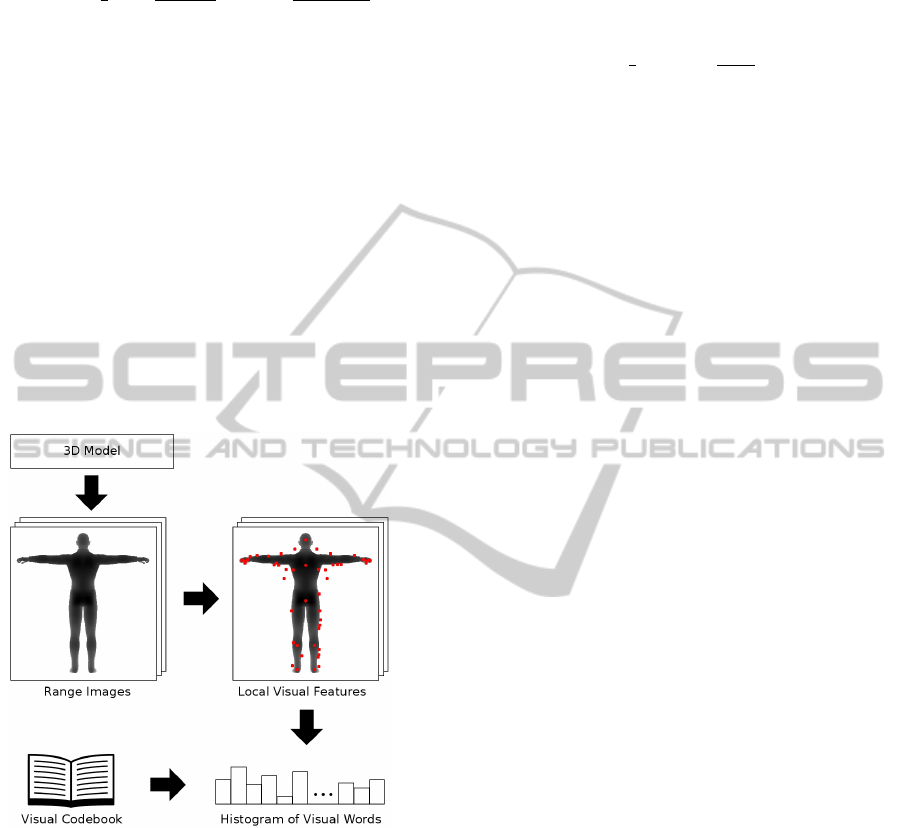
Figure 4: The salient local visual features method. A num-
ber of range images are rendered from various viewpoints.
Salient local visual features and their descriptors are ex-
tracted. The visual features can be quantized into visual
words using a precomputed visual codebook. By accumu-
lating the visual words into a histogram, a feature vector for
the 3D model is generated.
Salient Local Visual Features Method: To demon-
strate that the generative training approach presented
in the previous Section can be combined with differ-
ent retrieval techniques, we implemented the salient
local visual features method introduced by Ohbuchi
et al. (Ohbuchi et al., 2008). The method is depicted
schematically in Figure 4.
Like in the histogram of inverted distances, the vi-
sual word histogram is learned using kernel density
estimation. However, in this case Manhattan distance
L
1
is used as the kernel function. The similarity S for
the 3D model described by the visual word histogram
l
0
is given by:
S(l
0
) =
1
n
∑
n
i=1
L
1
l
0
−l
(i)
σ
,
where n denotes the number of training samples and
σ represents the smoothing factor.
The visual codebook quantizes visual features into
visual words. The visual codebook is learned un-
supervised in a preprocessing step using k-means++
clustering (Arthur and Vassilvitskii, 2007). The set
of visual features that have to be clustered is selected
randomly from all views of the 3D models.
5 EVALUATION
We evaluated both retrieval methods with the Prince-
ton shape benchmark (Shilane et al., 2004) using the
two classes illustrated in Figure 1: “commercial air-
plane” and “sedan car”. The complete benchmark
consists of 907 test samples including 10 sedan cars
and 11 commercial airplanes. Both retrieval meth-
ods have been trained generatively without any “real-
world” data or any previously defined or marked test
samples. The benchmark has been executed on a com-
puter with an Intel i7 950 CPU and 12 GB RAM. All
timings mentioned in this Section have been taken on
this reference system.
Sedan Car. The “sedan car” class was modeled us-
ing JavaScript taking six parameters. All other di-
mensions (e.g. length of the top) are derived com-
bining multiple parameters. The car consists of one
side (colored green in Figure 1 (left)). This side is ex-
truded twice using tapered extrusions with different
angles. The first extrusion creates the blue parts and
the second one creates the red parts. By mirroring the
side and the two extrusions around its center plane
the whole car is created. The tires are modeled using
cylinders. The extrusion as well as the creation of a
cylinder are extracted JavaScript functions prepared
for reuse.
Commercial Airplane. The procedural model of the
“commercial airplane” has five parameters to control
the dimensions of the airplane (see Figure 1 (right)).
Dependent parameters – such as the length of the
wings – are combinations of free parameters. The
fuselage of the airplane is created using a rotational
surface which is then slightly deformed to model the
cockpit and the aft fuselage. The jet engines are sim-
ple cylinders. As this generative model can already
GRAPP2015-InternationalConferenceonComputerGraphicsTheoryandApplications
100
histogram of inverted distances salient local visual features
0 0.2 0.4 0.6 0.8 1
0
0.2
0.4
0.6
0.8
1
Recall
Precision
Precision−Recall
Commercial Airplane
Sedan Car
0 0.2 0.4 0.6 0.8 1
0
0.2
0.4
0.6
0.8
1
Recall
Precision
Precision−Recall
Commercial Airplane
Sedan Car
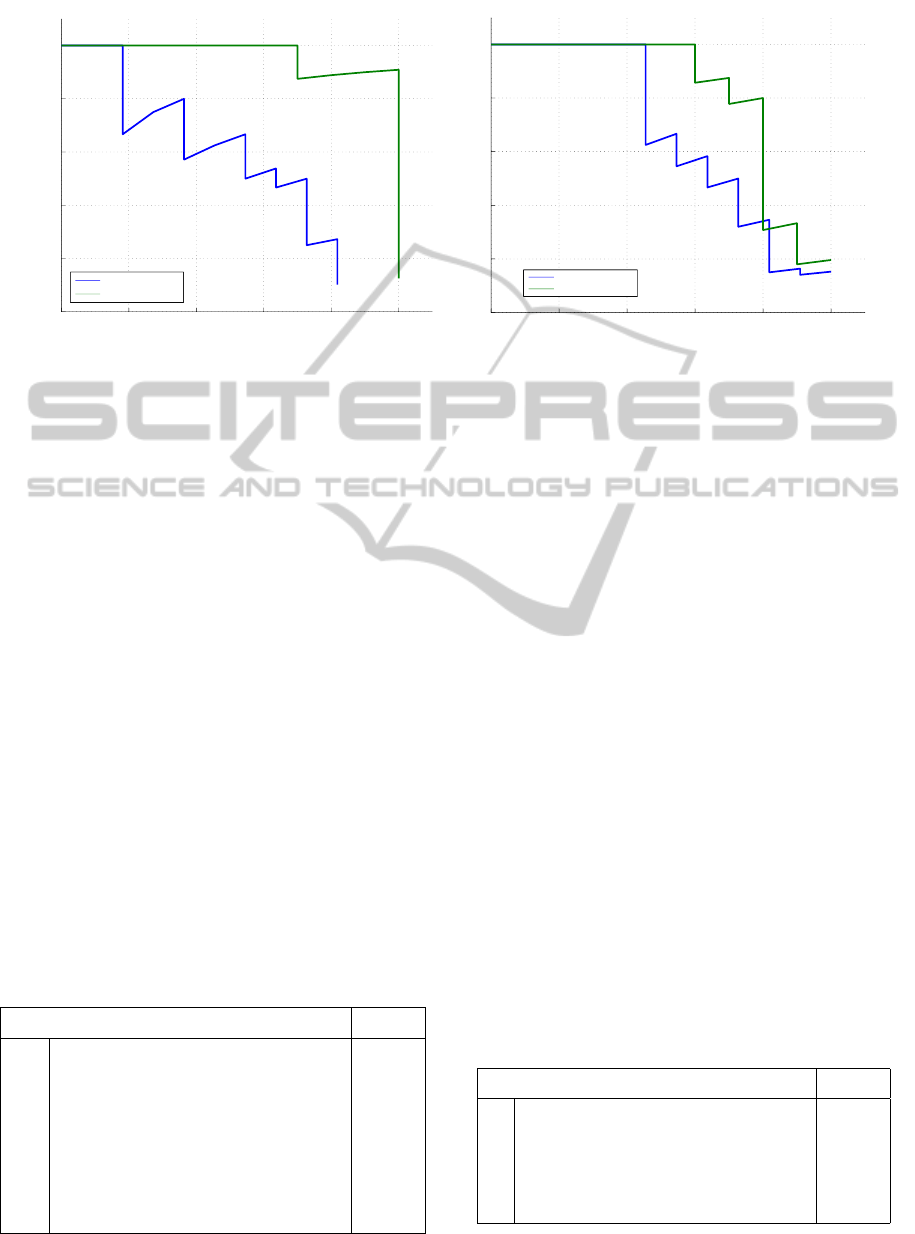
Figure 5: The evaluation of ranked retrieval results is commonly visualized by precision-recall graphs (Manning et al., 2008).
The corresponding visualizations show the benchmark results of the classes “sedan car” and “commercial airplane” using the
histogram of inverted distances method (left) and using the salient local visual features method (right).
reuse procedures needed for the sedan car, its code is
shorter than the car’s description.
Evaluation of the Histogram of Inverted Distances
Method. The values for the retrieval parameters were
evaluated empirically. All parameters and their cor-
responding values are displayed in Table 1. The gen-
eration and voxelization of 64 models for both model
classes took 103 seconds. The learning phase took
292 seconds. The actual retrieval process for both
classes took about 4.75 hours, respectively 9.41 sec-
onds per test model in average.
Figure 5 shows the precision-recall graphs (Man-
ning et al., 2008) for cars and airplanes using the his-
togram of inverted distances method (left) and using
the salient local visual features method (right).
The histogram of inverted distances method is
able to find similar objects to the given generative
models. The retrieval results for the class “sedan car”
are almost perfect. However, the “commercial air-
plane” class performs significantly worse. The main
Table 1: The parameters and their corresponding values
listed in this table have been used for benchmarking the his-
togram of inverted distances method.
Parameter Value
n Number of training samples 64
R Resolution of the voxel models 256
p Number of cells in one direction 16
σ Standard deviation for the Gaus-
sian kernel density estimation
1
/
4
cut Threshold in distance transforma-
tion
16
k Number of histogram bins 8
reason for this effect can be found in the genera-
tive model. It is not detailed enough to differentiate
between the benchmark’s different airplane classes
(commercial, fighter, biplane, . . . ). Figure 6 shows
the top 16 retrieval results for both classes using in-
verted distances.
Evaluation of the Salient Local Visual Features
Method. The parameters for the salient local visual
features method are presented in Table 2.
Rendering of the range images, extraction of the
visual features and calculation of the visual word his-
togram took 15.5 seconds per 3D model on average.
The calculation of the visual codebook, which con-
sists of the extraction of 30000 visual features from
a random subset of the benchmark and the cluster-
ing of the features into 1024 clusters, took 72 min-
utes. The generation of 64 training models for both
model classes and the calculation of the visual word
histograms took 33 minutes. The actual retrieval pro-
cess took 0.55 seconds per class.
Figure 5 (right) shows the precision-recall graphs
Table 2: The parameters and their corresponding values
listed in this table have been used for benchmarking the
salient local visual features method in combination with the
generative training approach.
Parameter Value
n Number of training samples 64
R Resolution of the range images 256
σ Smoothing factor for the kernel
density estimation
7
/
10
w Number of visual words 1024
GenerativeTrainingfor3D-Retrieval
101

for both shape classes using the salient local visual
features method. The method is able to find similar
objects to the given generative models. Again, the
“commercial airplane” class performs significantly
worse than the “sedan car” class due to its generative
model, which is not detailed enough to differentiate
between the airplane classes “commercial”, “fighter”,
etc. as can be seen in Figure 7. It shows the top 16
retrieval results for the classes “sedan car” and “com-
mercial airplane”.
6 IMPROVED RETRIEVAL VIA
DIFFUSION PROCESS
In order to improve retrieval results we use diffusion
processes. Using matching methods for 3D models,
the similarity or affnity between two models can be
calculated. Assuming that n is the number of 3D mod-
els, the so-called affinity matrix (n×n) of all 3D mod-
els can be calculated. Retrieving 3D models similar
to the i-th model using the affnity matrix only, is done
by extracting the i-th row and sorting it by its affnity
values. However, doing so ignores the structure of
the underlying data manifold (Donoser and Bischof,
2013). Diffusion processes re-evaluate the affnities of
all models in the context of all other elements. This
is done by diffusing the affnity values through the
graph described by the affnity matrix. Donoser et al.
(2013) have recently surveyed diffusion processes for
retrieval.
One of the best known diffusion algorithm is the
Google page rank algorithm (Page et al., 1998). For
the page rank algorithm an affnity matrix A is needed,
which contains all pairwise affnity values. If each row
of A is divided by its sum, the result is a stochastic ma-
trix P, which can be interpreted as a transition matrix
for randomly walking on a complete graph of size n.
Assuming we want to retrieve 3D models similar
to the j-th model, the n-dimensional probability vec-
tor f
0
must be initialized with Kronecker δ
i j
. The
probability vector, which contains the final affnities
for all other 3D models can be calculated iteratively
f
t+1
= f
t
·P. This update operation is performed until
convergence.
To apply diffusion processes in the field of re-
trieval, n × n affinity matrix containing all pairwise
similarities is needed. The pairwise similarities are
calculated by comparing the cell histograms of the
models. As described by (Johnson and Hebert, 1999),
the similarity between two cells is given by the corre-
lation coefficient. The similarity between two models
is given by the sum of the cells similarity. The con-
struction of the affnity matrix for the whole Prince-
ton Shape Benchmark requires 18142 model compar-
isons. One comparison of two models took 0:34 sec-
onds on average, which results in ≈310 hours for the
whole benchmark. To speed up the calculation of the
affnity matrix, the workload has been distributed to
seven similar computers. Thereby, calculation time
was reduced to two days. From the affnity matrix for
the whole benchmark, the affnity matrix for the test
set was extracted. it is depicted in Figure 8 (left) us-
ing a the black body radiation color map. The result-
ing affnity matrix is depicted in Figure 8 (right).
The effect of the diffusion process reinforces re-
trieval effects; i.e. the precision slightly decreases at
lower recall values, but increases at recall values of
above 0.4.
7 CONCLUSION
This paper presents a new approach to perform
content-based retrieval of 3D shapes based on genera-
tive modeling techniques. The generative models are
used to describe 3D model classes, respectively, 3D
shape spaces. In the training phase, the shape spaces
are sampled randomly. In this way, no “real” training
data is needed a priori.
The big advantage of procedural modeling tech-
niques is the included expert knowledge within an
object description (Ullrich and Fellner, 2011); e.g.
the knowledge of an expert about the inner structure
and the semantics of an object class can be mapped
to procedures (Ullrich et al., 2013). Within the Cul-
tural Heritage (CH) project “Procedural Fitting Server
(ProFitS)” we incorporate this technique to index a
CH repository semantically using expert knowledge.
The approach of a generative training set, which does
not need any “real” data can be combined with various
retrieval algorithms. We have evaluated two retrieval
methods to illustrate this approach.
The first method is called the histogram of in-
verted distances method by (Grabner et al., 2014).
The second method is called the salient local visual
features method based on the SIFT algorithm. Both
methods use feature vectors to learn a non-parametric
density function for each 3D model class. In the
recognition phase, the feature vector is calculated for
the test object and the similarity is estimated using the
learned non-parametric density function.
Furthermore, the retrieval results can be improved
using diffusion processes to take the underlying struc-
ture of the data manifold into account, similar to the
Google page rank algorithm.
Our contribution to 3D documents is a shape re-
trieval approach based on machine learning and gen-
GRAPP2015-InternationalConferenceonComputerGraphicsTheoryandApplications
102
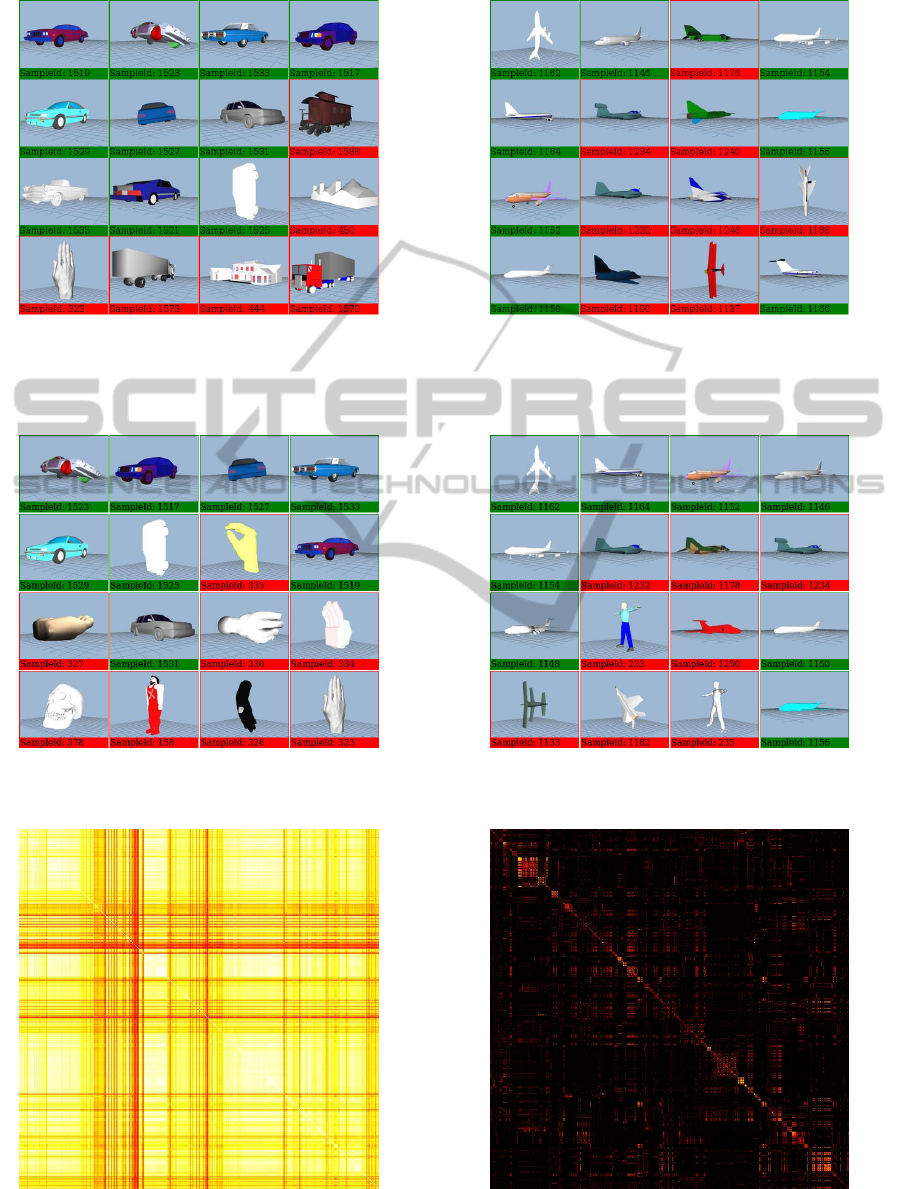
search results for “sedan car” search results for “commercial airplane”
Figure 6: The top 16 retrieval results for the class “sedan car” using the histogram of inverted distances method (left) are
almost perfect. The ten car models of the benchmark are listed within the best 16 matches, whereas top 16 retrieval results for
the class “commercial airplane” using the same method have many false positives. Although all returned models are airplanes,
the Princeton Shape benchmark distinguishes between many different airplane classes (commercial, fighter, biplane, . . . ).
search results for “sedan car” search results for “commercial airplane”
Figure 7: These top 16 retrieval results for the classes “sedan car” (left) and “commercial airplane” (right) have been generated
using the salient local visual features method. As the Princeton Shape benchmark distinguishes between many different
airplane classes, the results for “commercial airplane” have many false positives.
Figure 8: The affnity matrix before (left) and after (right) the application of the diffusion process. The values are mapped
using the black body radiation scheme. A black color indicates low similarity, whereas a white color indicates high similarity.
GenerativeTrainingfor3D-Retrieval
103

erative modeling. In this way, we provide a classifi-
cation technique, which uses generative modeling to
encode expert knowledge in a way suitable for auto-
matic classification and indexing of 3D repositories.
We have shown that it is possible to train a retrieval
method using generative models only. As a bene-
fit (not only for users of our method), this technique
eliminates the cold start problem in the training phase.
A generative description implemented in a few lines
of code is sufficient to generate a reasonable training
set.
ACKNOWLEDGEMENTS
The authors gratefully acknowledge the support of
the European Commission within the project DU-
RAARK founded by the program “ICT-2011-4.3-
Digital Preservation” as well as the support of the
Austrian Research Promotion Agency (FFG) for the
project ProFitS.
REFERENCES
Ankerst, M., Kastenm
¨
uller, G., Kriegel, H.-P., and Seidl, T.
(1999). 3D Shape Histograms for Similarity Search
and Classification in Spatial Databases. Advances in
Spatial Databases (Lecture Notes in Computer Sci-
ence), 1651:207–226.
Arthur, D. and Vassilvitskii, S. (2007). k-means++: The
Advantages of Careful Seeding. Proceedings of
the annual ACM-SIAM symposium on discrete algo-
rithms, 18:1027–1035.
Autodesk (2007). Autodesk Maya API. White Paper, 1:1–
30.
Bishop, C. M. (2007). Pattern Recognition and Machine
Learning. Springer.
Bustos, B., Keim, D., Saupe, D., and Schreck, T. (2007).
Content-based 3D Object Retrieval. IEEE Computer
Graphics and Applications, 27(4):22–27.
Donoser, M. and Bischof, H. (2013). Diffusion Processes
for Retrieval Revisited. Proceedings of the IEEE Con-
ference on Computer Vision and Pattern Recognition
(CVPR), 29:1320–1327.
Dutagaci, H., Sankur, B., and Yemez, Y. (2005). Transform-
based methods for indexing and retrieval of 3D ob-
jects. Proceedings of the International Conference on
3-D Digital Imaging and Modeling, 5:188–195.
Fellner, D. W., Saupe, D., and Krottmaier, H. (2007). 3D
Documents. IEEE Computer Graphics and Applica-
tions, 27(4):20–21.
Grabner, H., Ullrich, T., and Fellner, D. W. (2014). Content-
based Retrieval of 3D Models using Generative Mod-
eling Techniques. Proceedings of EUROGRAPHICS
Workshop on Graphics and Cultural Heritage (Short
Papers / Posters), 12:9–12.
Havemann, S. (2005). Generative Mesh Modeling. PhD-
Thesis, Technische Universit
¨
at Braunschweig, Ger-
many, 1:1–303.
Havemann, S., Ullrich, T., and Fellner, D. W. (2012). The
Meaning of Shape and some Techniques to Extract It.
Multimedia Information Extraction, 1:81–98.
Johnson, A. and Hebert, M. (1999). Using spin images
for efficient object recognition in cluttered 3D scenes.
IEEE Transactions on Pattern Analysis and Machine
Intelligence, 21:433–449.
Jones, M. C., Marron, J. S., and Sheather, S. J. (1996). A
Brief Survey of Bandwidth Selection for Density Es-
timation. Journal of the American Statistical Associa-
tion, 91:401–407.
Kazhdan, M., Funkhouser, T. A., and Rusinkiewicz, S.
(2003). Rotation invariant spherical harmonic repre-
sentation of 3D shape descriptors. Proceedings of the
Eurographics/ACM SIGGRAPH Symposium on Ge-
ometry Processing, 1:156–164.
Kriegel, H.-P., Brecheisen, S., Kr
¨
oger, P., Pfeifle, M., and
Schubert, M. (2003). Using sets of feature vectors for
similarity search on voxelized CAD objects. Proceed-
ings of the ACM International Conference on Man-
agement of Data (SIGMOD), 29:587–598.
Krispel, U., Schinko, C., and Ullrich, T. (2014). The Rules
Behind – Tutorial on Generative Modeling. Proceed-
ings of Symposium on Geometry Processing / Gradu-
ate School, 12:2:1–2:49.
Manning, C. D., Raghavan, P., and Sch
¨
utze, H. (2008). In-
troduction to Information Retrieval. Cambridge Uni-
versity Press.
M
¨
uller, P., Wonka, P., Haegler, S., Andreas, U., and
Van Gool, L. (2006). Procedural Modeling of Build-
ings. Proceedings of 2006 ACM Siggraph, 25(3):614–
623.
Ohbuchi, R., Osada, K., Furuya, T., and Banno, T. (2008).
Salient local visual features for shape-based 3D model
retrieval. Proceeding of the IEEE International Con-
ference on Shape Modeling and Applications, 8:93–
102.
¨
Ozkar, M. and Kotsopoulos, S. (2008). Introduction to
shape grammars. International Conference on Com-
puter Graphics and Interactive Techniques ACM SIG-
GRAPH 2008 (course notes), 36:1–175.
Page, L., Brin, S., Motwani, R., and Winograd, T. (1998).
The PageRank Citation Ranking: Bringing Order to
the Web. online:.
Shilane, P., Min, P., Kazhdan, M., and Funkhouser, T. A.
(2004). The Princeton Shape Benchmark. Shape Mod-
eling International, 8:1–12.
Szeliski, R. (2010). Computer Vision: Algorithms and Ap-
plications. Microsoft Research.
Tangelder, J. W. H. and Veltkamp, R. C. (2008). A survey of
content based 3D shape retrieval methods. Multimedia
Tools and Applications, 39:441–471.
Ullrich, T. and Fellner, D. W. (2011). Generative Object
Definition and Semantic Recognition. Proceedings of
the Eurographics Workshop on 3D Object Retrieval,
4:1–8.
GRAPP2015-InternationalConferenceonComputerGraphicsTheoryandApplications
104

Ullrich, T., Schinko, C., and Fellner, D. W. (2010). Proce-
dural Modeling in Theory and Practice. Poster Pro-
ceedings of the 18th WSCG International Conference
on Computer Graphics, Visualization and Computer
Vision, 18:5–8.
Ullrich, T., Schinko, C., Schiffer, T., and Fellner, D. W.
(2013). Procedural Descriptions for Analyzing Dig-
itized Artifacts. Applied Geomatics, 5(3):185–192.
Vanegas, C. A., Aliaga, D. G., Wonka, P., M
¨
uller, P., Wad-
dell, P., and Watson, B. (2010). Modelling the Ap-
pearance and Behaviour of Urban Spaces. Computer
Graphics Forum, 29:25–42.
Watson, B. and Wonka, P. (2008). Procedural Methods for
Urban Modeling. IEEE Computer Graphics and Ap-
plications, 28(3):16–17.
GenerativeTrainingfor3D-Retrieval
105
