
Design of an Optimized Distal Optic for Non Linear Endomicroscopy
Claire Lefort
1
, Hussein Hamzeh
2
, Liu Wei
2
, David Sevrain
2
, Philippe Leproux
1
,
Frédéric Pain
2
and Darine Abi Haidar
2,3
1
Laboratoire XLIM, UMR 7252, CNRS, F-87060 Limoges, France
2
Laboratoire IMNC, UMR 8165- Université Paris-Sud, Orsay, France
3
Université Paris 7-DENIS DIDEROT, F-75012 Paris, France
Keywords: Nonlinear Endomicroscopy, Double-Clad Fibre, GRIN Lens, Zemax Simulations.
Abstract: The development of a nonlinear endomicroscope is justified by the need for a non-invasive diagnosis tool to
assess at the cellular level, in vivo and in live the presence of pathologies like cancer in a patient body. To
do so, an important effort has to be made in the miniaturization of the distal head of the endoscope. We
report in this paper our work on the characterization of a commercial gradient index (GRIN) lens, especially
its possible fluorescence emission and ability to image biological structures. We show that the fluorescence
of the peripheral glue of the GRIN lens does not have impact on the fluorescence images but can lead to
perturbations to measure fluorescence lifetime and emission spectrum. The axial and lateral resolutions are
obtained by imaging 1 μm diameter gold beads. The results show a good agreement with values from the
literature. Finally, we simulate an endomicroscope combining an appropriate double-clad fibre (DCF) with
the GRIN lens and a tubular piezoelectric scanner (PZT) scanning head. Variations of parameters values
like fibre tilt angle and distance between the DCF and the GRIN lens allow to discuss on the performances
of this device in terms of working distance (WD), magnification, field of view (FOV) and coupling
efficiency.
1 INTRODUCTION
Cancer is a family disease where abnormal cells are
proliferating. It is becoming more and more
widespread in the world. Cancer treatment is a
ticklish issue, depending on the development of the
cancerous tumour and its localisation in the patient's
body. Nowadays, the main hope of curing this
illness lies in surgery, often completed by chemical
treatments or radiotherapy (Miller, 1981). If this
global process is applied in the early stages of the
disease, the chances to heal a patient and extends his
hope of life considerably increase. Nevertheless,
surgery is a very invasive operation and there still
exists a risk of relapse associated with a new
proliferation of cancerous cells in the treated area.
This may be due to a non-complete removal of all
the cancerous cells, despite the use of combined
modality therapies.
Starting from this alarming observation,
particularly true in the case of cancers where it is not
possible to remove a large part of the tissues around
the cancer area like the brain cancer, there is an need
for a tool enabling a fast and accurate discrimination
between cancerous and healthy cells.
A way to achieve this goal consists in the
development of an endoscope with a microscopic
resolution. The first endomicroscopes, now
clinically used, are based on the confocal principle
with an excitation laser source in the visible range
(Salaün, 2010). This device allows to image
endogenous tissue components like elastin, in vivo
and in real time. However, some drawbacks can be
underlined, such as an imaging depth limited to at a
few tens of micrometres inside the target tissues,
mainly due to the strong scattering properties of
biological tissues, as well as the small number of
mean contrasts available from endogenous
fluorescent proteins under linear excitation.
To overcome this limitation, the current research
on endomicroscopy aims at developing two-photon
fluorescence (2PEF) imaging with femstosecond
pulse (150fs) excitation at high excitation rate
(80MHz) in the infrared (NIR) range (GU, 2014).
The interest of nonlinear imaging technique
compared to the confocal imaging is justified not
only by an increase in imaging depth due to IR
excitation (Cosignani 2012) but also by the
availability of a new mean of contrast thanks to the
second harmonic generation emitted by non-centro-
5
Lefort C., Hamzeh H., Wei L., Sevrain D., Leproux P., Pain F. and Abi Haidar D..
Design of an Optimized Distal Optic for Non Linear Endomicroscopy.
DOI: 10.5220/0005249700050012
In Proceedings of the 3rd International Conference on Photonics, Optics and Laser Technology (PHOTOPTICS-2015), pages 5-12
ISBN: 978-989-758-092-5
Copyright
c
2015 SCITEPRESS (Science and Technology Publications, Lda.)
symmetrical structures as collagen. This fact,
combined to the absence of confocal pinhole due to
the intrinsic localisation of the nonlinear
phenomenon in the focal plane of the focusing
device, promote a deeper imaging depth within a
few hundreds of micrometres
While nonlinear microscopy is now a very well
known and essential tool for biological tissues
characterization, its transposition to endomicroscopy
remains problematic. Indeed, endomicroscopy
requires several miniaturized elements like scanning
system or distal lens of focalization (Ducourthial,
2013). The laser excitation, coming from a Ti:
Sapph oscillator is classically delivered through an
optical fibre, flexible and with a small diameter
providing access to the internal hollow organs
(alveoli, kidney…). The choice of the optimal fibre
proves to be complex and must be realized taking
into account all other parameters of the global
system. The fibre has to be preceded by a shaping
module for the compensation of linear and nonlinear
effects occurring inside this material medium (Lelek
2007).
Currently, all the miniaturized parts of the
endomicroscope are problematic and prevent the
multiphotonic endomicroscope commercialisation.
This is particularly true for the distal lens. Named
“GRIN lenses” for gradient index lenses this
technology is based on the gradient of negative
refractive index of its material from the centre to its
outskirts, glued inside a cylinder of stainless steel.
Dimensions of classical GRIN lenses range between
0.35 to 2 mm in diameter and between 5 mm and
few cm in length, with a numerical aperture (NA) of
the object space between 0.2 and 0.8.
In this paper we present our study of GRIN
lenses in the context of the development of a
multiphotonic endomicroscope. The first part is
dedicated to the experimental study of a GRIN lens
alone. Background fluorescence induced in the
GRIN lens is studied under UV excitation beam,
mimicking the emitted multiphotonic fluorescence
or second harmonic generation coming from
biological samples. Then, the impact of the
background fluorescence of the GRIN lens on its
imaging ability, spectral detection and fluorescence
lifetime measurements is evaluated. The 2D lateral
resolution is experimentally measured using 1 µm
diameter gold beads. The second part of the paper is
dedicated to numerical simulations, using Zemax, of
the GRIN lens coupled to a specifically designed
double clad fibre (DCF) ideal for the assembly of a
multiphotonic endomicroscope (Lefort, 2014). Both
geometric ray tracing and Gaussian beam approach
were considered. Furthermore, the influence of the
relative position between the GRIN lens and the
DCF tip on the magnification, FOV, axial and lateral
resolutions is evaluated. Finally, choosing a
piezoelectric (PZT) stage as scanning device
(Myaing, 2006), the coupling of the DCF with the
PZT and the GRIN lens is characterized through the
variation of the image working distance, the
coupling efficiency of the fluorescence beam inside
the DCF, the size of the field of view (FOV) and the
axial and lateral resolutions.
2 GRIN LENS EXPERIMENTAL
CHARACTERIZATION
2.1 GRIN Lens Definitions
The GRIN lenses are all manufactured with a
medium having a continuously variable index of
refraction between the periphery and the centre of
the lens. This optic is glued to a biocompatible ring
of stainless steel.
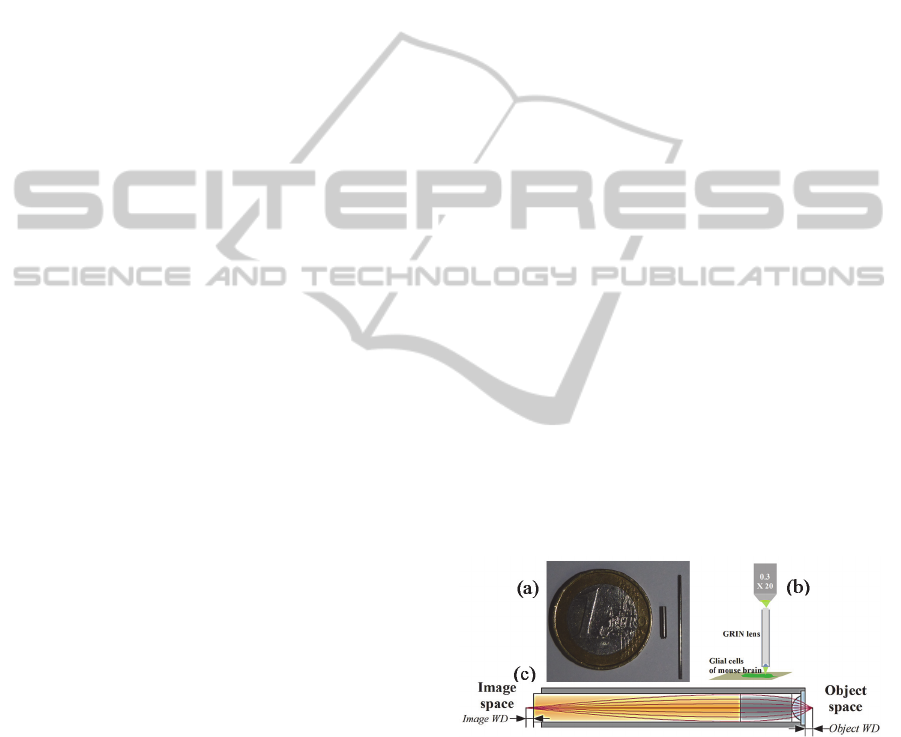
In this study, we have chosen to characterize
a commercial GRIN lens (GT-MO-080-018-810,
Grintech, Jena, Germany), with a total length of 7.53
mm and a diameter of 1.4 mm. Figure 1 shows the
definitions of the image and object space and their
working distances (WD). The object space contains
the target biological sample and in the image space
lies the DCF delivering the NIR excitation beam and
collecting the multiphotonic signal emitted by the
biological sample.
Figure 1: a. Picture of the two GRIN lenses. b. Setup for
GRIN lens characterization from Grintech. c. Definitions
of the image and object spaces and the corresponding WD.
2.2 Background Fluorescence
2.2.1 Imaging the Background Fluorescence
Fluorescence imaging techniques need a previous
characterization of all the potential background
source of fluorescence, as the GRIN lens. To start
the characterization of the background fluorescence,
PHOTOPTICS2015-InternationalConferenceonPhotonics,OpticsandLaserTechnology
6
the GRIN lens is placed under the microscope
objective of a confocal microscope focusing a
krypton argon laser (Figure 1b). In this
configuration, the confocal microscope gives an
image of the image face of the GRIN lens Figure 2
presents the resulting observation of the image space
of the GRIN lens.
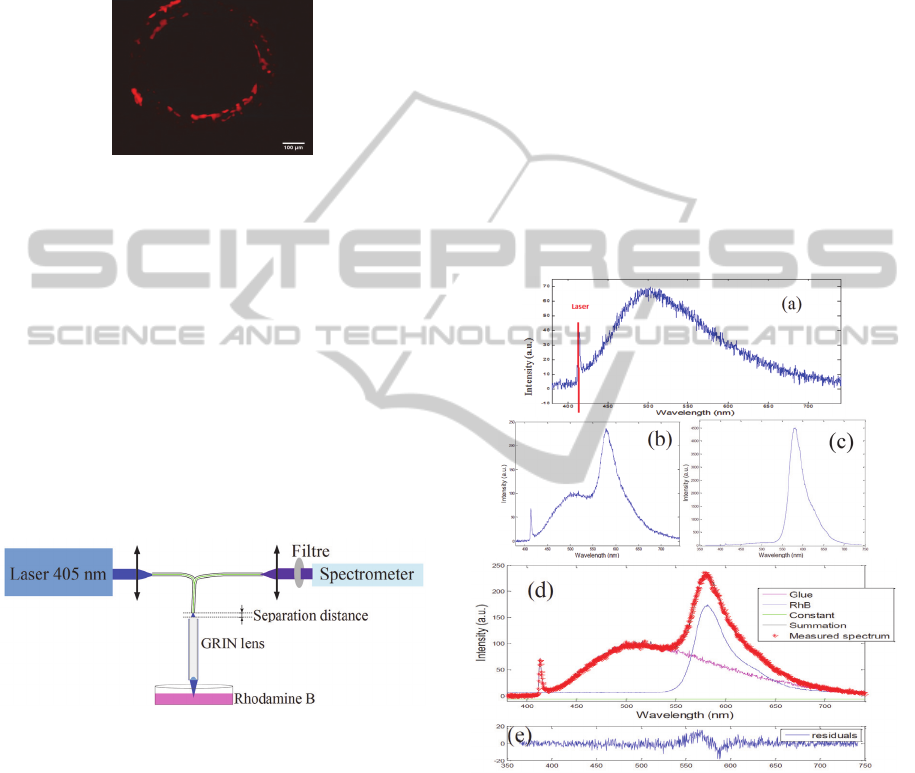
Figure 2: Fluorescence image of the glue between the
GRIN lens and the stainless steel of protection by confocal
imaging.
The inhomogeneous fluorescence signal from Figure
2 probably result from fluorescent components in the
glue used to fix the GRIN lens to the steel ring. No
impact of the intrinsic fluorescence of the glue on
fluorescence images of biological samples was
observed.
2.2.2 Spectroscopic Analysis
The background fluorescence of the GRIN lens is
spectrally characterized. Figure 3 gives a
representation of the experimental setup.
Figure 3: Experimental setup for the spectral
characterization of the background fluorescence of the
GRIN lens.
This setup consists of a pulsed diode laser from
Picoquant at 405±10 nm (LDHP-C-405B,
Picoquant) coupled into one of the two fibres of a
bifurcated fibre. The laser power can be adjusted, as
well as the repetition frequency, which can be set
between 2.5 and 40 MHz The fibre guides the
excitation laser source to the GRIN lens image
space. A solution of Rhodamine B (RhB) is placed
in the object space of the GRIN lens. The backward
fluorescence, emitted by both the RhB and the GRIN
lens, is collected by the second core of the bifurcated
fibre and delivered to a spectrometer, preceded by a
long pass filter to reject the excitation laser beam. In
a first stage the GRIN lens is excited with 405 nm
laser source without the sample of RhB and without
the filter to measure the background fluorescence
emitted by the GRIN lens itself. The graph of Figure
4a is the emission spectrum of the background
fluorescence. It can be seen that this spectrum covers
a wide spectral range (around 400-700 nm).
The solution of RhB is then illuminated and
its fluorescence emission spectrum was collected by
the GRIN lens with a separation distance between
the lens and the fibre of 2 mm and less than 200 µm
(Figures 4b and 4c, respectively). Figures 4d and 4e
present the analysis of the total spectrum by
comparison with the spectrum obtained by the sum
of the fluorescence spectra of the glue of the GRIN
lens and the RhB solution. The latter was measured
using the bifurcated fibre alone so as to eliminate its
possible contribution to the fluorescence signal.
Figure 4: a. Emission spectrum of the background
fluorescence induced by the GRIN lens alone with a 405
nm laser excitation. b. RhB fluorescence emission
spectrum measured with a separation distance between the
fibre and the GRIN lens of 2mm and c. of less than 200
µm. d. Summary of the measured emission spectra and the
sum of the RhB and glue emission spectra. e. Calculation
of the difference between the sum of each spectral
component and the effective measured spectrum.
The contribution of the fluorescence from the glue
around the GRIN lens is now spectrally
characterized (Figures 4a, 4b and 4d). From
DesignofanOptimizedDistalOpticforNonLinearEndomicroscopy
7
comparison between figures 4b and 4c, it can be
shown that depending on the separation distance
between the fibre tip and the GRIN lens, the
contribution of the glue fluorescence is variable. At
a large separation distance between the GRIN lens
and the fibre tip (2 mm), the background
fluorescence significantly altered the RhB spectrum,
while the background fluorescence is hardly
noticeable when this separation distance is very
short, below 200 µm. This can be explained if one
considers the very short image space WD of the
GRIN lens (below 100 µm in air at 405 nm). It is
also remarkable from Figure 4d that the RhB
spectrum in blue recovers successfully the measured
spectrum using the GRIN lens. Figure 4e
corroborates this observation.
2.2.3 Lifetime Measurements with GRIN
Lens
The two previous sections have brought out the
presence of a background fluorescence perturbing
the spectral measurement or the imaging through the
GRIN lens in specific conditions. This section aims
to present the effect of the GRIN lens position, in
ideal conditions of object and image WD, on the
measurement of fluorescence lifetime in time
domain of the RhB.
To do so, the spectrometer of the setup described
in Figure 3 is replaced by a photomultiplier tube
(PMT) and a Time-Correlated Single Photon
Counting (TCSPC) module synchronized with the
excitation laser source. This method detects the
exponential decay of fluorescence based on an
accurate record of a single photon using a highly
sensitive photon detector. The delay time of
emission of a photon relative to the laser excitation
pulse corresponds to the time spent in the excited
state. Then, excitation is repeated several times to
maintain the condition that only one photon per
molecule is detected at each pulse. These
measurements are recorded as a photon counting
histogram representing the fluorescence decay time
and the instrument response function (IRF), using a
Time Harp 200 acquisition card (Pico- quant, Berlin
Germany). The IRF characterizes the timing
precision of TCSPC system and for an ideal system
it should be infinitely narrow. During spectral or
lifetime measurement the laser emission was
rejected using a 410 nm high pass filter from
(SR410, Semrock, USA) in order to detect
fluorescence. The lifetime decays were fitted to an
exponential model in order to extract the lifetime
information with a reasonable fit quality, assessed
by the residuals of the fitting. An exponential model
was chosen because it gives a good description of
the physics involved in the lifetime decay. Two
exponential models were tested to extract the
lifetime information: the multi-exponential tail fit
(no consideration of the IRF) and the exponential
reconvolution (taking into account the IRF) detailed
in equations (1) and (2).
(1)
′
(2)
Where:
I (t) represent the measured decay data,
A
i
– amplitude of the i
th
component, in counts,
τ
i
– lifetime of the i
th
component that has to be
calculated.
IRF was measured using a mirror instead of the RhB
sample and the filter was replaced by an optical
density filter in order to let the attenuated laser beam
pass to the PMT for IRF detection. The IRFs
measurements of the fibre alone, the fibre coupled to
a 10x microscope objective and the fibre coupled to
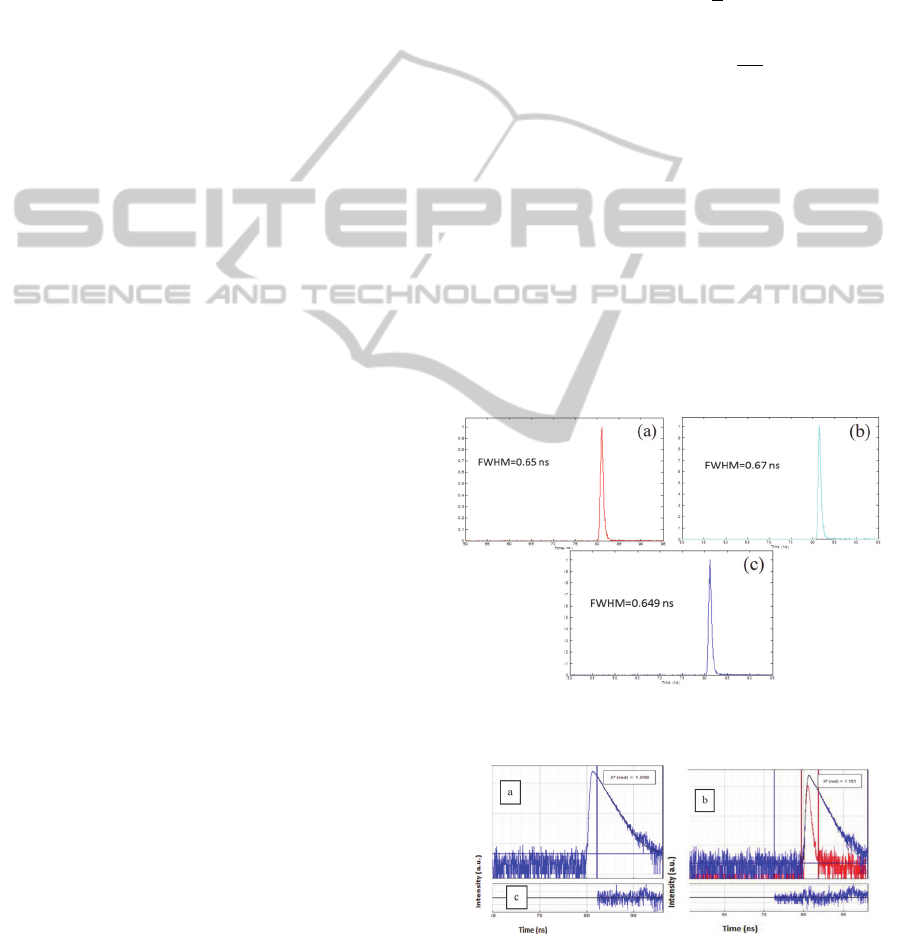
the GRIN lens are shown and compared in Figure 5.
Figure 5: Lifetime measurements. a. Fibre alone. b. Fibre
and objective 10x. c. Fibre and GRIN lens.
Figure 6: Measured fluorescence decay (in blue) and
fitting model (in black). a. Lifetime of RhB without
considering the IRF. b. Lifetime fitting by reconvolution,
IRF deconvoluted with the decay data (in red). c.
Residuals randomly distributed across the fitting range.
PHOTOPTICS2015-InternationalConferenceonPhotonics,OpticsandLaserTechnology
8
The IRFs are similar in the three conditions, with a
FWHM around 0,65 ns. This proves that the GRIN
lens does not affect lifetime measurements.
Lifetime measurements and decay fits of the
fluorescence signal of the RhB solution were then
realized, using the two fitting methods previously
detailed. Figures 6a and 6b present the results of
fluorescence lifetime measurements of RhB with the
fitting curves.
The results of lifetime decays of RhB through the
different elements of the setup are summarized in
the Table 1.
Table 1: Lifetime decay fitting through the setup elements
using tail fitting without the IRF and reconvolution fitting
with the IRF.
Element of
the setup
Fit
method
A (counts)
τ (ns)
Fibre
Tail 1872.4±20.9 1.72±0.02
Reconv 14046 ± 94.7 1.67 ± 0.01
Objective
Tail 1638.5 ± 19.3 1.705 ± 0.015
Reconv 3345.3 ± 40.4 1.703 ± 0.014
GRIN lens
Tail 252.5 ± 9.41 1.628 ± 0.049
Reconv 1835 ± 29.6 1.616 ± 0.019
In the literature (Boens 2007), the mean lifetime data
of the fluorescence lifetime of a solution of RhB in
water at 20°C is
τ
RhB,ref
= 1.72±0.02 ns. The fluorescence lifetime is
therefore not affected by the presence of the fibre
considering the tail fitting method, while the
reconvolution method is less relevant. Furthermore,
the fluorescence lifetime is not significantly
disturbed by the microscope objective if one takes
the experimental incertitude into account. Finally, it
can be seen that for the GRIN lens, both fitting
methods, lead to a decrease of the fluorescence
lifetime from 1.7 ns to about 1.62 ns. This may be
explained by the detection of fluorescence signal of
the glue of the GRIN lens, leading to an average
measurement of the lifetime of the RhB and the
glue. That point corroborates the previous
conclusions in section 2.2.1 and 2.2.2 on the
significant perturbation of the signal collected by the
GRIN lens due to the background fluorescence of
the glue.
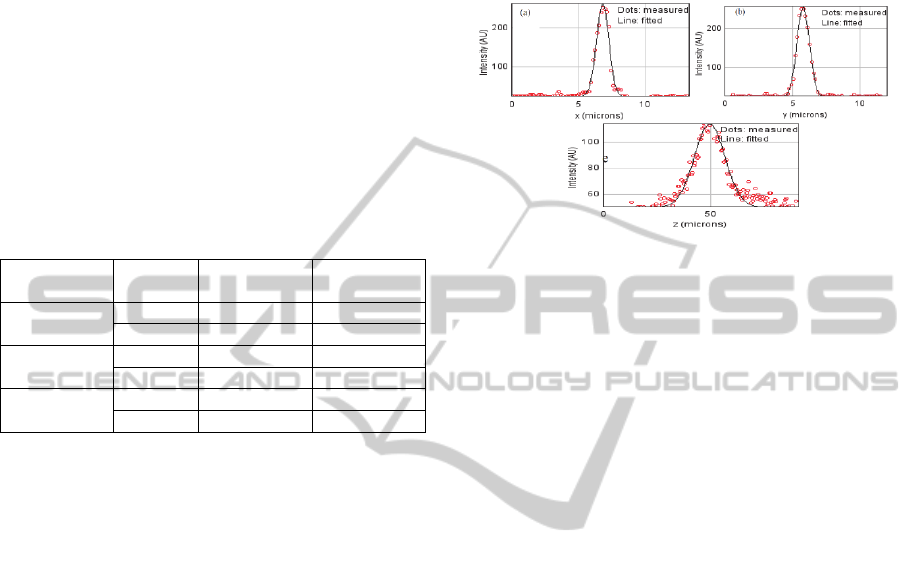
2.3 GRIN Lens Resolution
The resolution of the whole imaging system (10x
microscope objective + GRIN lens) is characterized
using 1μm diameter gold beads through the confocal
microscope. Those beads are assumed to be point
sources and the axial and lateral profiles of their
images are fitted by a Gaussian function depicted in
Figures 7a, 7b and 7c. The fitting was applied in
order to calculate the full width half maximum
(FWHM), considered as the optical resolution of the
system.
Figure 7: Beads profile measurements and their Gaussian
fits. a. Lateral resolution in x (μm). b. Lateral resolution in
y (μm). c. Axial resolution in z (μm).
The lateral resolution is 1 µm in x and 1 µm in y, in
good agreement with the best performances
described in the literature (Gu, 2014).
3 NUMERICAL SIMULATIONS
A numerical simulation of the GRIN lens in the
context of the manufacturing of an optimized
nonlinear endomicroscope is proposed. These
simulations are led simultaneously for NIR
nonlinear excitation and collection of the
multiphotonic signal emitted by the target. The
GRIN lens is coupled to the scanning system and the
optical fibre. The simulated fibre, a DCF, delivers
the nonlinear excitation by the core and collects the
multiphotonic emission by the inner cladding. This
DCF is simulated with ideal parameters for
delivering the multiphotonic excitation through a
small core diameter (5 µm) single mode at 800 nm
with a small NA (0.04) and a large inner cladding
diameter (200 µm) to collect the maximum of
multiphotonic signal from the GRIN lens thanks to a
large NA (0.3).
3.1 Simulation of the PZT Scanning
The scanning system is a tubular piezoelectric
scanner (PZT). This device consists in a small
tubular piezoelectric actuator governed by four
electrodes grouped in two pairs, with an optical fibre
positioned inside the actuator and electrically glued
at its tip. This layout allows driving the fibre tip,
exceeding the PZT for several tens of millimetres by
DesignofanOptimizedDistalOpticforNonLinearEndomicroscopy
9
application of a specific waveform (triangular or
sinusoidal) with a specific frequency, for each pair
of electrodes. This results in a circular scanning
pattern of the extremity of the fibre. The amplitude
is adjustable so that the position of the fibre tip can
be set on all the surface of a circle. The focalization
of the excitation beam on different parts of the target
relies on the relative position of the fibre with the
GRIN lens, as illustrated in Figure 8.
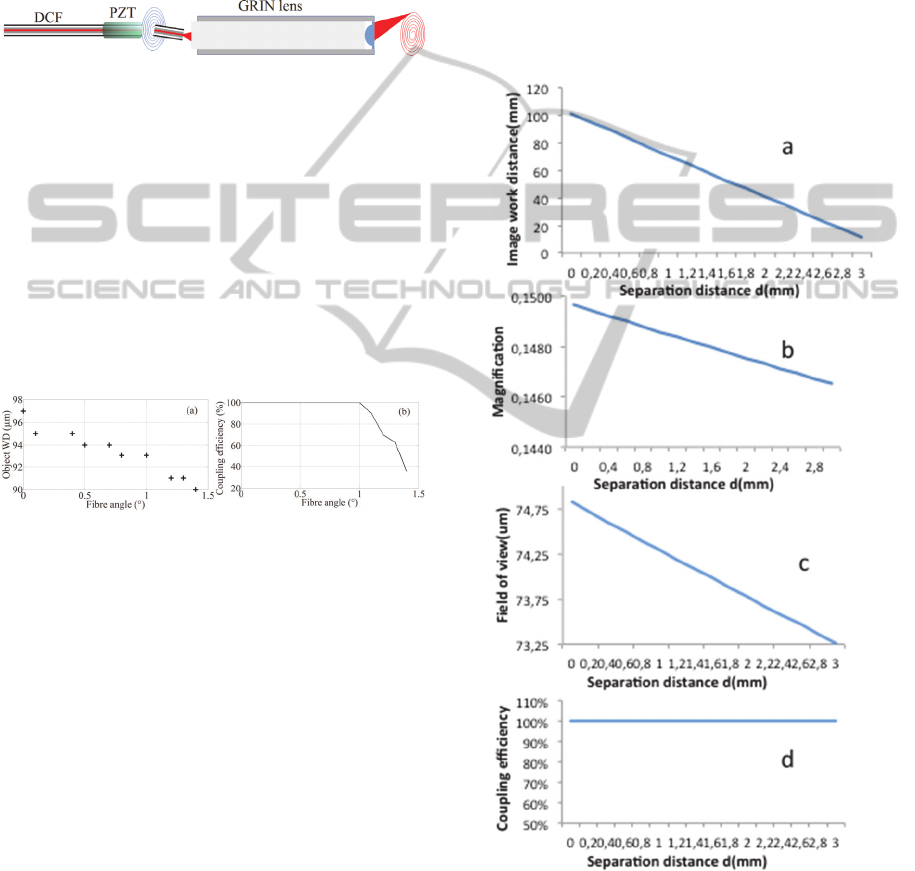
Figure 8: Complete scheme of the endomicroscope distal
end containing the DCF to guide the excitation and
collection signals, the PZT for scanning and the GRIN
lens for the focalization and the collection.
The use of the PZT scanning system on the fibre tip
imposes an angle between the fibre tip and the GRIN
lens, resulting in several consequences. First of all,
the object WD varies in function of the fibre angle.
Moreover, the coupling efficiency between the
excitation beam and the GRIN lens, linked to the
DCF core diameter and its NA is necessarily
modified by the tilt angle of the DCF. Figures 9a and
9b resume the related simulations.
Figure 9: a. Evolution of the object WD with the
inclination of the fibre tip due to the PZT scanning system.
b. Evolution of the coupling efficiency of the excitation
beam with the DCF angle.
Figure 9a shows a decrease of the object WD with
the fibre angle, revealing the fact that the fibre tip is
not really a plan, but a semi-sphere. This parameter
is not a major drawback but it should be considered
for the interpretation of the obtained images.
Concerning the coupling efficiency between the
excitation beam and the GRIN lens (Figure 9b), an
increase of the fibre angle leads to an important
decrease of the coupling. Indeed, 10% are lost for an
angle of 1.1° and more than 60% are not coupled for
1.4°. A direct consequence of this situation is the
reduction of the field of view in the object space.
It can be noticed that the PZT scanning system is
interesting by its small diameter ideal for a distal end
miniaturization. But several perturbations on the
detected image have to be taken into account to
interpret the images.
3.2 Optimization of the Distance
between the DCF and the GRIN
Lens
The separation distance between the DCF and the
GRIN lens is a critical parameter. Indeed, the focal
point position and thus the object WD, the
magnification properties, the coupling efficiency and
the field of view (FOV) are the main parameters that
may vary with this distance. They are simulated here
and the results are summarized in Figure 10 for a
distance ranging between 0 mm and 3 mm.
Figure 10: Numerical simulations of the influence of the
separation distance between the fibre tip and the GRIN
lens on several parameters. a. Object WD. b.
Magnification. c. FOV. d. Coupling efficiency.
As expected, the object WD decreases when the
separation distance between the fibre and the GRIN
PHOTOPTICS2015-InternationalConferenceonPhotonics,OpticsandLaserTechnology
10

lens increases. Consequently, the focal point is under
control of this parameter and can be adjusted
between 10 and 100 µm, the highest penetration
depth reachable by the excitation beam. The
magnification and the FOV decrease slowly when
the separation distance increases. For example, the
FOV, which is very small at the origin (less than 75
µm) declines to about 73.25 µm at 3 mm
Finally, the coupling efficiency of the
multiphotonic signal emitted by the sample after the
collection by the GRIN lens is not modified
whatever the distance between the fibre and the
GRIN lens. This results from the big inner cladding
diameter of 200 µm with the highest possible NA of
0.3. That optimized parameter is crucial for the
efficient collection of very weak multiphotonic
endogenous signals.
To conclude, these simulations show that if an
axial scanning is needed, moving the separation
distance between the fibre and the GRIN lens is a
way to operate. Nevertheless, one has to expect an
important decrease of the object WD as well as a
modification of the magnification and the FOV.
4 CONCLUSIONS
In the context of the miniaturization of a distal head
of an endomicroscope, GRIN lenses are commonly
used. The aim of this article is to characterize a
commercial GRIN lens. The performances of the
GRIN lens to make images of brain tissues were
tested under a confocal microscope. The presence of
a fluorescent signal emitted by the outlying glue all
around the effective area of the lens was revealed,
and the imaging of glial cells of mouse brain showed
no influence on the resulting fluorescent image of
the sample. Starting from this observation, the
importance of this background fluorescence was
evaluated by spectral analysis and fluorescence
lifetime measurements. Both of them were showing
a non-negligible part of this fluorescence that can be
easily identified by its spectrum and by its lifetime.
The GRIN lens resolutions were then established
to around 1 µm for lateral resolution and 16 µm for
axial resolution, in accordance with the values
usually presented in the literature.
Finally, numerical simulations of an
endomicroscope including this GRIN lens coupled
to a homemade DCF fixed with a PZT scanning
system were led. The limitations of the use of this
PZT were highlighted: the focal plan is necessarily
not plan but curved and the coupling efficiency of
the excitation beam between the DCF and the GRIN
lens is dramatically reduced to less than 40% of
coupling when the fibre angle exceeds 1.4°.
Furthermore, the separation distance between the
DCF and the GRIN lens influenced the position of
the focal point in the object plan. This observation
presents a way to perform an axial scanning system,
which is still a limiting point for obtaining 3D
images. Nevertheless, a modification of the
separation distance induces a reduction of the FOV
and of the magnification. The best simulated FOV
obtained with the GRIN lens is 75 µm square, very
small and far from the ideal situation usually asked
by the surgeons of 1 mm square.
All these limitations have to be carefully thought
for the experimental use of the GRIN lens. It
remains that GRIN lens technology is the only one
allowing a distal lens with a diameter smaller than
0.5 mm, a decisive advantage in nonlinear
endomicroscopy.
ACKNOWLEDGEMENTS
This work has been highly supported by INCA Plan
Cancer with Physicancer program grants “MEMBO”
& “MEVO” and the Institut National de Physique
Nucléaire et de Physique des Particules (IN2P3).
This work was supported by the L’Oreal
Foundation, thanks to the French National Program
“For Woman in Science”, distinguishing Claire
Lefort for her work on endomicroscopy.
REFERENCES
Cosignani, V., Dvornikov, A., Aguilar, J.-S., Stingari, C.,
Edwards, R., Mantulin, W. W., Gratton, E., 2012.
Deep tissue fluorescence imaging and in vivo
biological applications. Journal of Biomedical Optics,
17, 11, 116023.
Ducourthial, G., Lefort, C., Peyrot, D.A., Mansuryan, T.,
Kruglik, S.G., Vever-Bizet, C., Thiberville, L.,
Lacombe, F., Bourg-Heckly, G., Louradour, F., 2013.
Label free multiphoton imaging of human pulmonary
tissues through two-meter-long microstructured fiber
and multicore image-guide. Progress in Biomedical
Optics and Imaging - Proceedings of SPIE, 85750H.
Gu, M., Bao, H., Kang, H., 2014. Fibre-optical
microendoscopy. Journal of Microscopy, 254, 1, pp.
13-18.
Kim, J., Lee, W. M., Kim, P., Choi, M., Jung, K., Kim, S.,
Yun, S. H., 2012. Fabrication and operation of GRIN
probes for in vivo fluorescence cellular imaging of
internal organs in small animals. Nature Protocols, 7,
8, pp 1456-1469.
DesignofanOptimizedDistalOpticforNonLinearEndomicroscopy
11

Lefort, C., Hamzeh, H., Louradour, F., Pain, F., Abi
Haidar, D., 2014. Characterization, comparison and
choice of a commercial double-clad fiber for
nonlinear endomicroscopy. Journal of Biomedical
Optics, 19, 7, 076005.
Lelek, M., Suran, E., Louradour, F., Barthelemy, A.,
Viellerobe, B., Lacombe, F., 2007. Coherent
femtosecond pulse shaping for the optimization of a
non-linear micro-endoscope. Optics Express, 15, 16,
pp 10154-10162.
Miller, A. B., Hoogstraten, B., Staquet, M., & Winkler, A.
1981. Reporting results of cancer treatment. Cancer,
47(1), 207-214.
Myaing, M. T. M., MacDonald, D. J., Li, X., 2006. Fiber-
optic scanning two-photon fluorescence endoscope.
Optics Letters, 31, 8, pp 1076-1078.
Salaün, M., Roussel, F., Hauss, P.-A., Lachkar, S.,
Thiberville, L., 2010. In vivo imaging of pulmonary
alveolar proteinosis using confocal endomicroscopy.
European Respiratory Journal, 36, 2, pp 451-453.
Wang, T., Li, Q., Xiao, P., Ahn, J., Kim, Y.E., Park, Y.,
Kim, M., Song, M., Chung, E., Chung, W.K., Ahn, G.-
O., Kim, S., Kim, P., Myung, S.-J., Kim, K.H., 2014.
Gradient index lens based combined two-photon
microscopy and optical coherence tomography, Optics
Express, 22, 11, pp 12962-12970.
PHOTOPTICS2015-InternationalConferenceonPhotonics,OpticsandLaserTechnology
12
