
Discrimination of Different Foodborne Pathogens onto Carbohydrate
Microarrays Using Surface Plasmon Resonance Imaging
Emilie Bulard
1,2,3,4,5
, Aurélie Bouchet-Spinelli
1,2,3
, Patricia Chaud
4,5
, André Roget
1,2,3
,
Roberto Calemczuk
1,2,3
, Sébastien Fort
4,5
and Thierry Livache
1,2,3
1
Univ. Grenoble Alpes, INAC-SPrAM-CREAB, F-3800 Grenoble, France
2
CNRS, SPrAM-CREAB, F-3800 Grenoble, France
3
CEA, INAC-SPrAM-CREAB, F-3800 Grenoble, France
4
Univ. Grenoble Alpes, CERMAV, F-3800 Grenoble, France
5
CNRS, CERMAV, F-3800 Grenoble, France
Keywords: Biosensor, Spri, Bacterial Detection, Carbohydrate, Escherichia Coli, Listeria Monocytogenes, Salmonella
Enteritidis.
Abstract: Food safety is a public health challenge. Devices allowing early, fast, label-free and in situ detection of
bacteria are of great interest to prevent outbreaks. Listeria monocytogenes, Salmonella spp. and Escherichia
coli O157:H7 are foodborne pathogens which were responsible of 60% of the hospitalizations in the USA in
2011. In this study, we conceived a carbohydrate microarray in order to detect and discriminate these three
food pathogenic bacteria. In less than 10 hours, from an initial bacterial suspension of 100 bacteria per mL,
Surface Plasmon Resonance imaging allowed the detection and the discrimination of these bacteria while
they were growing and interacting specifically with the carbohydrate microarray. Moreover, this device is
easily regenerable and can be re-used: it is probably a promising tool to early detect bacteria in food.
1 INTRODUCTION
Foodborne illness is one of the major public health
problems. The estimation of hospitalizations and
deaths caused by pathogenic food pathogens is a
challenge. However, Centers for Disease Control
and Prevention estimate that 9.4 million episodes of
foodborne illnesses occurred in the USA in 2011.
For example, 35% of hospitalizations (i.e 19,336
hospitalizations) and 28% of deaths were caused by
Salmonella spp., 19% of deaths were caused by
Listeria monocytogenes and Escherichia coli O157
outbreaks contribute to 4% of hospitalizations in
2011 (Scallan, 2011). Then these three pathogenic
strains are part of the top five pathogens contributing
to foodborne diseases resulting in hospitalizations
and/or deaths. Conventional methods to detect
bacteria in food are reliable but time-consuming.
The need for bacterial cultures is one of the major
disadvantages of these techniques allowing the
spread of epidemics. For example, detection of L.
monocytogenes require one week with standards
methods (Velusamy, 2010). During this period,
consumers are not warned.
Since the last decade, the development of fast,
sensitive and reliable techniques has emerged. To
this aim, nanotechnology has already improved early
nanodiagnostics based on selective capture of
bacteria using nanoparticles (Tallury, 2010),
fluorescent nanoparticles, quantum dots (Gilmartin,
2012), bioconjugated magnetic particles (Chu,
2013), etc) or microengines modified with lectins
(Campuzano, 2012). However, these different
methods require complex functionalized probes and
a robust chemistry for surface functionalization.
Moreover, they consist at least in a two-step process,
the first one being the capture of bacteria and the
second one being the detection of bacteria-
nanoparticles interactions. For example, bacteria-
magnetic nanoparticles are easy to remove from the
sample by magnetic separation techniques but they
still need to be identified using other classical
techniques such as MALDI-MS spectrometry, flow
cytometry (Cellular analysis and detection using
surface plasmon resonance techniques, 2013),
fluorescence or scanning electron microscopy (Gu,
2006). The disadvantage of these techniques is that
they do not allow a real-time and in situ monitoring
of the bacteria-probe interactions. To solve this
121
Bulard E., Bouchet-Spinelli A., Chaud P., Roget A., Calemczuk R., Fort S. and Livache T..
Discrimination of Different Foodborne Pathogens onto Carbohydrate Microarrays Using Surface Plasmon Resonance Imaging.
DOI: 10.5220/0005254901210126
In Proceedings of the International Conference on Biomedical Electronics and Devices (BIODEVICES-2015), pages 121-126
ISBN: 978-989-758-071-0
Copyright
c
2015 SCITEPRESS (Science and Technology Publications, Lda.)

problem, label-free and real-time cutting edge
methodologies have been proposed such as Quartz
Crystal Microbalance (Chu, 2013). However, this
detection technique requires a high number of
bacteria and a uniformly functionalized surface
difficult to obtain in general. Microcantilevers have
also been used in order to detect bacteria in a
complex sample (Mader et al., 2012).
Surface Plasmon Resonance (SPR) has emerged
as a very well-adapted method for the detection of
analytes onto microarrays (Abadian, 2014, Safina,
2012). This technique, based on refractive index
changes, monitors the interactions occurring
between biomolecules grafted on a biochip and
target molecules within the sample. SPR imaging
(SPRi) collects the reflected light with a CCD
camera. Futhermore, it allows label-free detection in
real-time of up to one hundred images and SPRi
signals simultaneously within one biochip
(Bouguelia, 2013).
Our team has developed a new method called the
Culture-Capture-Measure (CCM) (Bouguelia, 2013,
Mondani, 2014). It consists in following in situ the
bacterial growth in a medium by SPRi. It allows
detecting bacteria in one step from an initial
concentration of 20 Colony Forming Units (CFU)
per mL. In these works, antibodies were used as
probes and grafted on gold surfaces. Antibodies
microarrays are efficient to detect bacteria
(Delehanty, 2002, Gao, 2010) but their cost and
fragility (dehydration and denaturation sensitivity,
single use) make them difficult to use on an
industrial scale. In this study, antibodies were
replaced by carbohydrates. Carbohydrates provide
interesting alternatives to antibodies in order to
overcome their limitations. They are less expensive,
easily-chemically-modified than antibodies. They
usually allow regeneration of the biochip because
their interactions are known to be low-energetic.
Besides, bacteria are known to interact with
carbohydrates by different ways: through particular
lectins produced on the outer cell wall, named
adhesins (Bierne, 2007, Chessa, 2009, Cowart,
1990) and also by non-specific bindings such as
interactions with membrane transporters or
electrostatic interactions (Audfray, 2013, Mader,
2012). This underlines the great potential of the use
of carbohydrates as probes for bacteria detection and
interactions.
We chose seven simple mono- and di-
saccharides for the conception of the microarray:
glucose (Glc), galactose (Gal), mannose (Man),
fucose (Fuc), maltose (Malt), N-acetylglucosamine
(GlcNAc), and sialic acid (Neu5Ac). First, pyrrole-
carbohydrate conjugates were synthetized and then
grafted onto gold surfaces by
coelectropolymerization. The microarray
functionalization was then characterized by lectin-
carbohydrate recognitions. Finally, bacterial
detection was evaluated by SPRi onto the
carbohydrate microarray and monitored by the CCM
method.
This biochip allows the detection and the clear
discrimination of the three bacterial strains tested: E.
coli O157:H7, L. monocytogenes subserotype 1/2a
and S. enteritidis.
2 MATERIALS & METHODS
2.1 Pyrrole-Carbohydrate Conjugates
Syntheses
2.1.1 Reactants
Monosaccharides, maltose, lithium bromide, sodium
hydride, allyl bromide, dimethylformamide,
acetonitrile, cysteamine, phosphate buffer,
manganese(II) chloride tetrahydrate, sodium
chloride, and sodium hydroxide were purchased
from Sigma-Aldrich (Saint-Quentin-Fallavier,
France). Pyrrole was purchased from Acros
Organics (Geel, Belgium), calcium(II) chloride from
Merck (Darmstadt, Germany).
2.1.2 Syntheses
According to the previously reported procedure
(Fort et al., 2005), pyrrole-carbohydrate conjugates
have been prepared from the corresponding allyle
glycoside by UV-promoted radical addition of
cysteamine followed by reaction with a
pentafluorophenyl-activated pyrrole ester. Allyl
glycosides have been prepared as reported in the
literature: allyl -D-glucopyranoside and allyl -D-
galactopyranoside (Lin, 2010), allyl -D-
mannopyranoside (Nishida, 2004), allyl -maltoside
(Takeo, 1987), allyl -D-fucopyranoside (Vermeer,
2001), allyl DN-acetyl-neuraminic acid (Roy,
1990), allyl 2-acetamido-2-deoxy-beta-D-
glucopyranoside (Vauzeilles, 2001).
The different conjugates were isolated in 30-50%
yield after purification by reverse phase Solid Phase
Extraction and characterized by
1
H,
13
C NMR and
MS spectrometry. Final solid products were stored at
4°C.
BIODEVICES2015-InternationalConferenceonBiomedicalElectronicsandDevices
122

2.2 Fabrication of a Carbohydrate
Microarray
Aliquots of pyrrole-carbohydrate conjugates were
dissolved in spotting buffer (50 mM phosphate
buffer, pH 6.8, 50 mM NaCl and 10% glycerol)
containing 20 mM pyrrole. The concentration of
pyrrole-carbohydrate conjugate in the mixture was
10 mM.
SPRi biochips were purchased from Horiba
Scientific (Chilly-Mazarin, France) and are made of
a high index glass prism covered with a 2 nm-thick
chromium and a 50nm-thick gold layer used as a
working electrode (about 2 cm
2
).
Coelectropolymerization of pyrrole and pyrrole-
carbohydrate conjugates on the biochips was carried
out in an automatized pipette tip (diameter 500µm)
filled with the solution to be polymerized and
containing a platinum wire used as a counter
electrode. The pipette tip was moved at the vicinity
of the gold layer of the SPR biochip, till an electrical
contact was applied between the working (gold
surface) and counter (platinum wire) electrodes. The
polymerization on the prism gold layer was
performed with a 100 ms electric pulse at a 2.0 V
bias independently of any reference electrode. After
microarraying, biochips were copiously washed with
water, dried and stored in air at 4°C (Mercey, 2008).
Each biochip was arrayed with quadruplicates of
pyrrole-carbohydrate conjugates. Moreover, four
spots of polypyrrole (Ppy) deprived of any
carbohydrates were also deposited onto the gold
surface to assess nonspecific SPR response.
2.3 SPRi Setup
Signal measurements were performed using a SPRi-
Lab+TM system (Horiba Scientific, Chilly-Mazarin,
France). Using this commercial software, regions of
interest (ROI) corresponding to individual spots on
the biochips were defined (diameter 260 µm). The
SPRi signal was monitored with a CCD camera, and
reflectivity changes (ΔR) of each ROI were followed
and plotted upon time.
2.4 Characterization of the
Carbohydrate Microarray
Functionalized biochips were characterized by SPR
measurements after injection of different lectins
already known to interact specifically with
carbohydrates (Chang, 2011, Safina, 2012) in
phosphate buffer at 25°C.
2.4.1 Lectins
UEA I (Ulex Europaeus Agglutinin-I) from Ulex
europaeus, PNA (Peanut Agglutinin) from Arachis
hypogaea, WGA (Wheat Germ Agglutinin) from
Triticum vulgaris and concanavalin A (ConA) from
Canavalia ensiformis (jack bean) were purchased
from Sigma-Aldrich (Saint-Quentin-Fallavier,
France).
2.4.2 SPRi Monitoring of Lectin -
Carbohydrate Recognitions
The concentrations used were: 500 nM of PNA
(specific for Gal), 280 nM of UEAI (specific for
Fuc), 50 nM of WGA (specific for GlcNAc,
Neu5Ac) and 1 µM of ConA in the presence of 1
mM Ca
2+
and Mn
2+
(specific for Man, Malt).
SPRi signals (not shown in this study) proved
the efficient grafting and the accessibility of the
grafted sugars by revealing an increase in the
reflectivity variation corresponding to the
recognition of specific spots by lectins.
2.5 Detection of Bacterial Growth by
SPRi
2.5.1 Bacterial Suspensions
E. coli O157:H7 CIP 105917 strain, L.
monocytogenes subserotype 1/2a and S. enterica
subserotype enteritidis were purchased from the
Institut Pasteur (Paris, France).
Bacterial cells were grown overnight at 37 °C in
a Tryptic Soy Broth medium (TSB, Saint-Quentin-
Fallavier, France). Overnight grown bacterial
cultures – corresponding to 10
8
-10
9
CFU.mL
-1
–
were used for SPRi experiments after serial dilutions
(up to 10
2
CFU.mL
-1
). Bacterial counting was
carried out either by McFarland turbidity
measurements (Densimat apparatus, BioMerieux,
Marcy l’Etoile, France) or colony counting after
plating and culture on solid media Tryptic Soy Agar
(TSA, Saint-Quentin-Fallavier, France). For colony
counting, the counting of 4 plates was averaged and
standard deviation was calculated.
2.5.2 Monitoring of Bacterial Kinetics using
SPRi
The freshly bacterial suspension of 100 CFU.mL
-1
in
TSB medium was deposited in the thermalized
(37°C) SPRi chamber (1.6 mL) onto the
carbohydrate microarray. SPRi kinetic experiment of
DiscriminationofDifferentFoodbornePathogensontoCarbohydrateMicroarraysUsingSurfacePlasmonResonance
Imaging
123
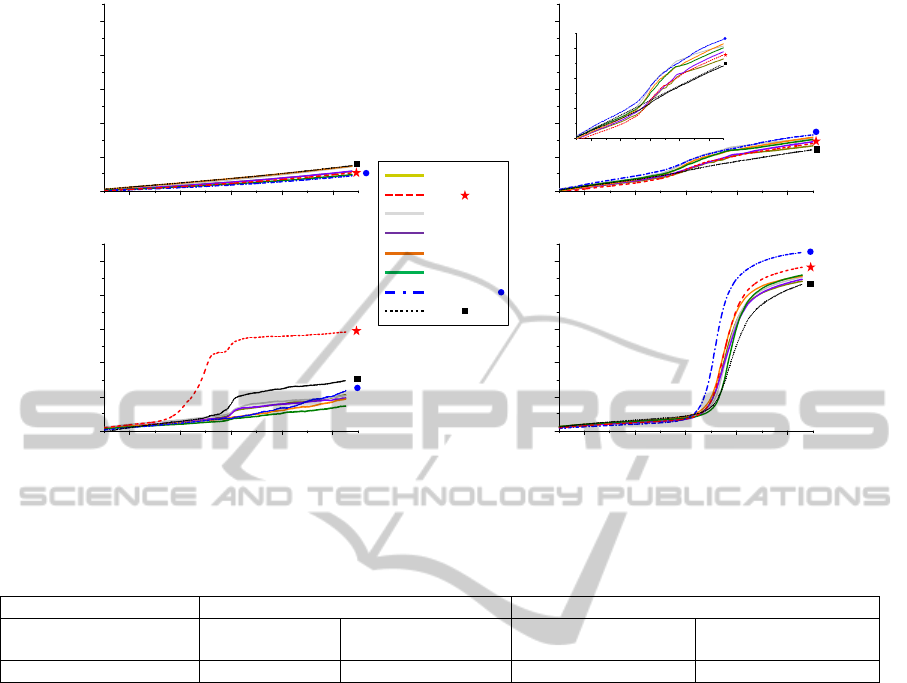
Figure 1: SPRi signals obtained from the spots of the carbohydrate microarray, after deposition of the bacterial suspension
at 10
2
CFU.mL
-1
in TSB; in the case of: A. buffer (control), B. S. enteritidis, C. E. coli O157:H7, and D. L. monocytogenes.
Table 1: Detection times at the inflection point of SPRi signals obtained after deposition of the bacterial suspension at 10
2
CFU.mL
-1
in TSB. Data were obtained from the SPRi signal averages of three independent runs.
Bacteria E. coli O157:H7 L. monocytogenes
Interacting carbohydrate Gal Ppy, the others
carbohydrates
Sialic Acid Ppy, the others
carbohydrates
Detection Time (min) 529 ± 26
604 9 739 19 783 12
the bacterial growth was realized by Culture-
Capture-Measure (CCM) (Bouguelia, 2013,
Mondani, 2014). SPRi signals were recorded in real-
time during the culture (1100 min) over the biochip.
2.5.3 SPRi Data Treatment
For each experiment, an average of SPRi signal
coming from quadruplicates was realized.
SPRi signals (i.e ΔR) of the bacterial growth
onto the carbohydrate microarray are represented by
an inverse tangent function: after smoothing kinetic
curves, first order derivative of this function was
realized. The maximum of the derivative
corresponds to the inflection point of kinetic curve
called “detection time”.
Finally, all the results present in this paper are
the average of at least three independent runs.
3 RESULTS AND DISCUSSION
Using the CCM method developed in our laboratory
(Bouguelia, 2013, Mondani, 2014), we monitored
the kinetic SPRi signal after bacterial deposition
onto the carbohydrate microarray. The curves are
represented in Figure 1.
Experimental kinetic curves were similar to
standard bacteria growth kinetics occurring in three
different stages: first, the lag phase (bacteria adapt to
the new medium), then the exponential growth
(bacteria divide regularly) and finally the stationary
phase (growth stops because of the lack of nutrients
and overpopulation). Figure 1.A represent the SPRi
signal obtained from the control (i.e TSB medium):
the linear increase in reflectivity corresponds to the
liquid evaporation occurring during the SPRi
experiment. The kinetic SPRi curve of S. enteritidis
(Figure 1.B) presents a low SPRi signal but a shape
of bacterial growth for all the carbohydrate-bacteria
interactions. On the contrary, Figures 1.C, and 1.D
corresponding to E. coli O157:H7 and L.
monocytogenes onto the carbohydrate microarray
respectively, show different carbohydrate-bacteria
interactions. In the case of E. coli O157:H7, the
galactose-E. coli interaction (red curve) was earlier
200 400 600 800 1000
0
10
20
30
40
50
TSB
R(%)
Time (min)
200 400 600 800 1000
0
10
20
30
40
50
S. enteritidis
R(%)
Time (min)
200 400 600 800 1000
0
10
20
30
40
50
L. monocytogenes 4.12
R(%)
Time (min)
200 400 600 800 1000
0
10
20
30
40
50
R(%)
E.coli O157:H7
Time (min)
A. B.
C. D.
ΔR%
Time(min)
ΔR%
Time(min)
ΔR%
Time(min)
ΔR%
Time(min)
E.coliO157:H7
TSB
L.monocytogenes
200 400 600 800 1000
0
5
10
15
S. enteritidis
zoom
S.enteritidis
Glc
Gal
Man
Fuc
Malt
GlcNAc
Sialicacid
Ppy
BIODEVICES2015-InternationalConferenceonBiomedicalElectronicsandDevices
124

detected by SPRi than the others interactions. In the
case of L. monocytogenes, the SPRi signal earlier
detected is the sialic acid-L. monocytogenes
interaction (dark blue curve). Moreover, the SPRi
curve presents two plateaux: the first one may
correspond to the classical stationary phase and the
second may correspond to the development of the
bacterial biofilm.
In this study, the amplitude of the SPRi signal
could not be relevant to discriminate the different
strains. In the case of S. enteritidis and E. coli
O157:H7, ΔR is less than 20-30%. On the contrary,
in the case of L. monocytogenes, ΔR is around 50-
60%. Indeed, theSPRisignalalsodependsonthe
contributionofonebacteriumtothisSPRisignal.
Thus, the ΔR value can not be used as a criterion
because of the different shapes and sizes of the three
strains. However, it is possible to rationalize the
results by defining for each bacterium a “detection
time” (Table 1). In the case of E. coli O157:H7, the
“detection time” of the galactose-E. coli interaction
is 529 ± 26 min whereas the average “detection
time” of the {control, others carbohydrates}-E. coli
interaction is 604 9 min. Then the time difference
between these two “detection times” is 76 32 min.
That significates that E. coli interact 76 32
minutes earlier with the galactose spots than with the
others. In the case of L. monocytogenes, the time
scale is rather different from the one of E. coli
O157:H7. The “detection time” of the sialic acid-L.
monocytogenes interaction is 739 19 min and thus
the time difference between this time and the
“detection time” of the {control, others
carbohydrates}-L. monocytogenes interaction is 44
9 minutes.
The observation of the SPRi signals and the
quantitative analysis is promising for the further
identification and differentiation of the three
bacterial strains onto our carbohydrate microarray.
This microarray is also regenerable through soft
washing (SDS 2% and sodium hydroxide 0.02M)
and can be stored at room temperature in air up to 6
months.
4 CONCLUSIONS
This work in progress presents an innovative
concept to detect specifically food pathogenic
bacteria. Thanks to the Culture-Capture-Measure-
ment methodology developed in our team, bacteria
are detected in less than 10 hours, from an initial
suspension of 10
2
CFU.mL
-1
, onto a carbohydrate
microarray by SPRi.
We have demonstrated that S. enteritidis, E. coli
O157:H7 and L. monocytogenes bacteria interact
differently on the carbohydrate microarray (i.e
different SPRi signals) that is promising to identify
these three pathogenic strains. Furthermore, E. coli
O157:H7 has showed particular interaction with the
galactose spots whereas L. monocytogenes interacted
preferentially with the sialic acid spots.
Then, this cheap, regenerable carbohydrate
microarray seems to be a promising tool to detect
bacteria in food and a good alternative to the use of
expensive, and fragile antibodies. The identification
and the differentiation of different strains inside one
bacteria specie, in particular E. coli and L.
monocytogenes, are ongoing in our team.
ACKNOWLEDGEMENTS
This work has been partially supported by the Labex
ARCANE (ANR-11-LABX-0003-01). We thank the
Chimie NanoBio-ICMG platforms (Université
Joseph Fourier, Grenoble, France) for mass
spectrometry and NMR analyses. We akcnowledge
the French Agency for Food, Environmental and
Occupational Health and Safety (ANSES), Food
Safety Laboratory (Maisons-Alfort, France) for
providing us bacterial strains and the Centre de
Ressources Biologiques de l’Institut Pasteur (Paris,
France) for providing the E. coli O157:H7 strain
(CIP105917).
REFERENCES
Abadian, P.N., Kelley, C.P., Goluch, E.D., 2014. Cellular
analysis and detection using surface plasmon
resonance techniques. Anal. Chem. 86, 2799-2812.
Audfray, A., Varrot, A., Imberty, A., 2013. Bacteria love
our sugars: interaction between soluble lectins and
human fucosylated glycans, structures,
thermodynamics and design of competing
glycocompounds. C.R. Chimie 16, 482-490.
Behra, M., Azzouz, N., Schmidt, S., Volodkin, D.V.,
Mosca, S., Chanana, M., Seeberger, P.H., Hartmann,
L., 2013. Magnetic porous sugar-fonctionalized PEG
microgels for efficient isolation and removal of
bacteria from solution. Biomacromolecules 14, 1927-
1935.
Bierne, H., Cossart, P., 2007. Listeria monocytogenes
surface proteins: from genome predictions to function.
Microbiol. Mol. Biol. Rev.71, 377-397.
Bouckaert, J., Mackenzie, J., de Paz, J.L., Chipwaza, B.,
Choudhury, D., Zavialov, A., Mannerstedt, K.,
Anderson, J., Piérard, D., Wyns, L., Seeberger, P.H.,
DiscriminationofDifferentFoodbornePathogensontoCarbohydrateMicroarraysUsingSurfacePlasmonResonance
Imaging
125

Oscarson, S., De Greve, H., Knight, S.D., 2006. The
affintiy of the FimH fimbrial adhesin is receptor-
driven and quasi-independent of Escherichia coli
pathotypes. Mol. Microbiol. 61(6), 1556-1568.
Bouguelia, S., Roupioz, Y., Slimani, S., Mondani, L.,
Casabona, M.G., Durmort, C., Vernet, T., Calmeczuk,
R., Livache, T., 2013. On-chip microbial culture for
the specific detection of very low levels of bacteria.
Lab Chip. 13, 4021-4032.
Campuzano, S., Orozco, J., Kagan, D., Guix, M., Gao, W.,
Sattayasamitsathit, S., Claussen, J.C., Merkoci, A.,
Wang, J., 2012. Bacterial isolation by lectin-modified
microengines. Nano Lett. 12, 396-401.
Chang, C-F., Pan, J-F., Lin, C-N., Wu, I-L., Wong, C-H.,
Lin, C-H., 2011. Rapid characterization of sugar-
binding specificty by in-solution proximity binding
with photosensitizers. Glycobiology 21(7), 895-902.
Chessa, D., Winter, M.G., Jakomin, M., Bäumler, A.J.,
2009. Salmonella enterica serotype Typhimurium Std
fimbriae bind terminal α (1,2)fucose residues in the
cecal mucosa. Mol. Microbiol. 71(4), 864-875.
Chu, Y.W., Engebretson, D.A., Carey, J.R., 2013.
Bioconjugated magnetic nanoparticles for the
detection of bacteria. J. Biomed. Nanotechnol. 9,
1951-1961.
Cowart, R.E., Lashmet, J., McIntosh, M.E., Adams, T.J.,
1990, Adherence of a virulent strain of Listeria
monocytogenes to the surface of a hepatocarcinoma
cell line via lectin-substrate interaction. Arch.
Microbiol. 153, 282-286.
Delehanty, J.B., Ligler, F.S., 2002. A microarray
immunoassay for simultaneous detection of proteins
and bacteria. Anal. Chem. 74, 5681-5687.
Fort, S., Birikaki, L., Dubois, M-P., Antroine, T., Samain,
E., Driguez, H., 2005. Synthesis of conjugatable
saccharide moieties of GM2 and GM3 glycosides by
engineered E. coli. Chem. Commun. 20, 2558-2560.
Gao, J., Liu, C., Wang, Z., Dong, S., 2010. Antibody
microarray-based strategies for detection of bacteria
by lectin-conjugated gold nanoparticle probes. Talanta
81, 1816-1820.
Gilmartin, N., O’Kennedy, R., 2012. Nanobiotechnologies
for the detection and reduction of pathogens. Enzym.
Microb. Techol. 50, 87-95.
Gu, H., Xu, K., Xu, C., Xu, B., 2006. Biofunctional
magnetic nanoparticles for protein separation and
pathogen detection. Chem. Commun. 941-949.
Lin, Y-Y.A., Chalker, J.M., Davis, B.G., 2010. Olefin
Cross-Metathesis on Proteins: Investigation of Allylic
Chalcogen Effects and Guiding Principles in
Metathesis Partner Selection. J. Am. Chem. Soc.
132(47), 16805-16811.
Mader, A., Gruber, K., Castelli, R., Hermann, B.A.,
Seeberger, P.H., Rädler, J.P., Leisner, M., 2012.
Discrimination of Escherichia coli strains using
glycan cantilever array sensors. Nanolett. 12, 420-423.
Mercey, E., Sadir, R., Maillart, E., Roget, A., Baleux, F.,
Lortat-Jacob, H., Livache, T., 2008. Polypyrrole
oligosaccharide array and surface plasmon resonance
imaging for the measurement of glycosaminoglycan
binding interactions. Anal. Chem. 80, 3476-3482.
Mondani, L., Roupioz, Y., Delannoy, S., Fach, P.,
Livache, T., 2014. Simultaneous enrichment and
optical detection of low levels of stressed Escherichia
coli O157:H7 in food matrices, J. Appl. Microbiol.
117(2), 537-546.
Nishida, Y., Mizuno, A., Kato, H., Yashiro, A., Ohtake,
T., Kobayashi, K., 2004. Stereo- and Biochemical
Profiles of the 5-6- and 6-6-Junction Isomers of α-D-
Mannopyranosyl [60]Fullerenes. Chem. Biodivers. 1,
1452-1464.
Roy, R., Laferriere, C.A., 1990. Synthesis of protein
conjugates and analogues of N-acetylneuraminic acid.
Can. J. Chem. 68, 2045-2054.
Safina, G., 2012. Application of surface plasmon
resonance for the detection of carbohydrates,
glyconjugates, and measurement of the carbohydrate-
specific interactions: a comparison with conventional
analytical techniques. Anal. Chim. Acta. 712, 9-29.
Scallan, E., Hoekstra, R.M., Angulo, F.J., Tauxe, R.V.,
Widdowson, M-A., Roy, S.L., Jones, J.L., Griffin,
P.M., 2011. Foodborne illness acquired in the United
States – Major pathogens. Emerg. Infect. Dis. 17(1), 7-
15.
Takeo, T., Imai, T., 1987. Synthesis of trisaccharide
glycosides related to nigeran. Carbohyd. Res. 165(1),
123-128.
Tallury, P., Malhotra, A., Byrne, L.M., Santra, S., 2010.
Nanobioimaging and sensing of infectious diseases.
Adv. Drug Deliv. Rev. 62, 424-437.
Vauzeilles, B., Dausse, B., Palmier, S., Beau, J-M., 2001.
A one-step β-selective glycosylation of N-acetyl
glucosamine and recombinant
chitooligosaccharides. Tetrahedron Lett. 42, 7567-
7570.
Velusamy, V., Arshak, K., Korostynska, O., Oliwa, K.,
Adley, C., 2010. An overview of foodborne pathogen
detection: in the perspective of biosensors. Biotechnol.
Adv. 28, 232-254.
Vermeer, H.J., van Dijk, C.M., Kamerling, J.P.,
Vliegenthart, J.F.G., 2001. Fucosylation of Linear
Alcohols: A Study of Parameters Influencing the
Stereochemistry of Glycosylation. Eur. J. Org. Chem.
1, 193-203.
BIODEVICES2015-InternationalConferenceonBiomedicalElectronicsandDevices
126
