
3DArcLens: Interactive Network Analysis on Geographic Surfaces
Alberto Debiasi, Bruno Sim
˜
oes and Raffaele De Amicis
Fondazione Graphitech, Trento, Italy
Keywords:
3D Geovisualization, Edge Congestion, Interactive Visualization, Graph Layout, Distortion Lens.
Abstract:
Geographic datasets such as international telecommunications traffic, financial flows, trading patterns, and
national migration patterns describe the movement of entities between geographical locations. In spatial rela-
tions analyses the exact route of the connections is not important. Hence, one of the most preferred methods
for its depiction is a graph representation with data nodes layered over a geographical surface (such as a flat
map or a virtual globe). However, a large number of arcs can produce dense visual clutters that make difficult
the extraction of information from: occluded geographical surfaces, occluded nodes and occluded arcs. In this
work we present a novel focus+context technique for 3D virtual environments that interactively distorts and
filters arcs layouts, revealing underneath information about the three aforementioned visual elements: nodes,
arcs and geographical surface. Moreover, changing the camera does not affect the geographical focus of the
lens. In our use cases, we observed that such technique is an advantage for tasks that include the exploration
of geographical networks.
1 INTRODUCTION
A huge amount of geographical data is available
nowadays. Many of these datasets describe the move-
ment of entities from geographical locations, repre-
sented in form of origin-destination data. In such data
representation only the origin, the destination and
magnitude of the flows are known. Examples of such
datasets are international telecommunications traffic,
financial flows, trading patterns, and national migra-
tion patterns (Tobler, 1987). Representations based
on geographical maps can be useful to the study of
these datasets, e.g. allow users to reason about ge-
ographic patterns of the movement. In such case a
node-link structure is used to represent the informa-
tion over a flat map or over a virtual globe. In such
context the exact route of the connections is not im-
portant, hence links are represented as straight lines,
arcs, or even curves drawn in 2D or 3D virtual envi-
ronment.
According to the first law of Geography, ”Every-
thing is related to everything else, but near things
are more related than distant things” (Tobler, 1970)
the perception of the distance between the origin and
destination of a flow is extremely important. There-
fore, the use of flat map representations is not rec-
ommended if the dataset covers the entire world, e.g.
with the Mercator projection, nodes located in oppo-
site sides of a map appear very far, but in the real
world the physical distance is shorter. Also, flat maps
can also increase the clutter problem, e.g. links that
connect nodes placed in North America with oth-
ers placed in the Asia stretch across the entire map,
occluding the network in Europe. Representing the
Earth as a virtual globe overcomes this limitation be-
cause distances are true to scale and the length of
the link (represented as a three-dimensional arc) that
connects the two points is proportional to the short-
est distance between them. The main limitation of
3D globes when compared to 2D maps is that only
one hemisphere is visible at a time. A technique that
works on a 3D space and that is not affected by the
aforementioned occlusion problem is ArcMap (Cox
et al., 1996). It is a geographic visualization that uses
a two-dimensional representation of the Earth com-
bined with three-dimensional arcs that connect the
nodes.
In both, virtual globe and ArcMap, the depiction
of considerable amount of links over an area often
causes visual clutter, either on the nodes and arcs that
are not visible or on the layered geographical map
(Figure 1). The latter is particular important due to the
geographical information encoded into the dataset.
For example, if the dataset to be analyzed describes
tourist flows then it can be relevant to visualize the
layered map that contains the major touristic attrac-
tions in the world.
Although the user can move, pan, tilt and zoom
291
Debiasi A., Simões B. and De Amicis R..
3DArcLens: Interactive Network Analysis on Geographic Surfaces.
DOI: 10.5220/0005255202910299
In Proceedings of the 6th International Conference on Information Visualization Theory and Applications (IVAPP-2015), pages 291-299
ISBN: 978-989-758-088-8
Copyright
c
2015 SCITEPRESS (Science and Technology Publications, Lda.)

(a) (b)
Figure 1: (a) Visual clutter in a virtual globe with arcs. (b)
Visual clutter in a flat map with arcs. This visualization
shows Internet traffic flows between countries.
the camera, in some situations this in not enough to
reveal the hidden information. In addition, the re-
quired time to compute these interactions might not
be acceptable and performing the operations in 3D
space can be disorienting for the user (Kaur et al.,
1999). Since the nodes encode geographical informa-
tion, techniques that rearrange node positions, such as
graph layout approaches are not recommended.
In this paper, we introduce a novel focus+context
technique called 3DArcLens that interactively reduces
the occlusion problem without removing links or
moving nodes. We define a lens technique that acts
on the arcs depending on their position and incident
nodes. For example, if the interactive lens intersects
only with the arc and not with its incident nodes, then
the arc is replaced with an aesthetically pleasing curve
placed around the lens to be easily traced. If the arc
has an incident node inside the lens, the node is vi-
sualized as a sphere with an unique color, meanwhile
the segment inside the lens is not drawn and the rest is
colored accordingly with the node’s color. Due to the
fact that the arcs that depict origin-destination data do
not represent a real route, changing their shape or not
drawing a part of them does not affect the informa-
tion they represent. Combined, these two methods al-
low the visualization of elements inside the lens (map,
nodes and arcs) to be clutter free. This interactive lens
is specifically designed to support the identification of
elements of geographical networks as well as the ex-
ploration of the layered map with 3D view preserving
the geographic context such as the virtual globe and
the ArcMap.
This paper is structured as follows. Section 2 de-
scribes the related work. Section 3 introduces the arc
congestion problem. Section 4 describes our theoret-
ical framework. In the Section 5 a comparison with
similar techniques is made, and a discussion on the
limitation of the proposed technique is done. We con-
clude with some remarks about the usability of the
technique in Section 6.
2 RELATED WORK
This section provides a brief overview of interactive
techniques for reducing the visual clutter in graph
drawing domain and in 3D space.
Interactive Techniques for Clutter Reduction
in Graph Drawing Domain. An approach to re-
duce visual clutter in graph layouts is through con-
tent filters (Wong and Carpendale, 2007). The down-
side of this approach is that we also lose information
about purged or less relevant edges (Furnas, 1986).
Becker (Becker et al., 1995) suggested an alternative
that does not required purging data. The idea is to
draw the arcs only half the way to their target. How-
ever, this approach requires more cognitive effort to
track or find the edges destination.
Edge aggregation (i.e. edge bundling) is a well
adopted technique that became popular in the last ten
years. Holten et al. (Holten and Van Wijk, 2009)
presented a force-directed algorithm in which edges
are modeled as flexible springs that can attract each
other while node positions remain fixed. A force-
directed algorithm (Debiasi et al., 2014) is used for
the automatic generation of flow maps where flows
are aggregated together and the magnitude of each
flow is represented by the thickness of the lines. Cui
et al. (Cui et al., 2008) describes a mesh-based edge
clustering method for graphs. Additional works on
edge bundling are described in the survey by Zhou et
al. (Zhou et al., 2013). The peculiarity of the edge
bundling is that it is used to understand the overall
patterns but not the single links of the graph because
the connections become harder to read.
Wong et al. (Wong et al., 2003) proposed Edge-
Lens; a technique that iteratively curves graph edges
away from the point of focus. This consents to dis-
ambiguate the relationship between nodes and edges
without losing information. Bearing this in mind,
Schmidt et al. (Schmidt et al., 2010) used a multi-
touch interaction in conjunction with some edge dis-
placement techniques. Tominski et al. proposed to
draw in a local focus region only the edges that con-
nect certain vertices within the lens scope (Tominski
et al., 2006).
Pietriga et al. (Pietriga and Appert, 2008) pre-
sented Sigma Lenses, a set of interactive lenses
that replaces standard optical distortions with dy-
namic translucence to transition between focus
and context areas. Another strategy presented to
reduce the clutter problem is to apply a unique
color to paths of interest that differentiates from
background clutters (Moscovich et al., 2009). Link
Sliding (Moscovich et al., 2009) allows users to slide
IVAPP2015-InternationalConferenceonInformationVisualizationTheoryandApplications
292

a link-cursor along the edge towards the destination
node. To explore crowded areas (overlapping bun-
dles), semantic lenses can be used. MoleView (Hurter
et al., 2011) is a semantic lens that selects a set of
data elements falling within the lens position and
having an attribute value defined by the user. In case
of graph layout the lens moves the control points that
compose the links around the lens.
Interactive Techniques for Clutter Reduction
in 3D Space. Different approaches were used to-
gether with extra interactions, such as panning and
tilting to reduce the visual clutter where the 3D vir-
tual environment is projected in a 2D display. View-
point dependent distortion of 3D data (Sheelagh et al.,
1996) highlights regions of interest by dedicating
more space to them. Viega et al. (Viega et al., 1996)
introduced the 3D Lens, which is a Magic Lens with a
volume, that affects objects contained within it. Bell
et al. (Bell et al., 2001) introduced Toolglass and
Magic Lenses as a see-through interface to modify
the visual appearance of application objects, enhance
data of interest or suppress distracting information.
McGuffin et al. (McGuffin et al., 2003) explored an
alternate strategy that uses deformations, where the
user can cut into and open up parts of the volume in
real time, making the interior visible while still re-
taining surrounding context. In contrast, the Balloon-
Probe (Elmqvist and Tudoreanu, 2007) provides an
inflatable force field controlled by the user that can be
used in areas of locally high object congestion. Al-
though these techniques try to solve the clutter prob-
lem in the 3D space, none of them are specifically
designed for the arc congestion problem over geo-
graphic surface.
A recent trend in 3D virtual environments made
use of properties like transparency to expose hidden
content. Looser et al. (Looser et al., 2004) described
a 3D magic lens implementation for Augmented Real-
ity that supports information filtering using the stencil
buffer, allowing the user to see through a house. Cof-
fin and H
¨
ollerer (Coffin and Hollerer, 2006) presented
a similar technique with active interaction where the
user controls a volume that is dynamically subtracted
from the surrounding world geometry, again using the
stencil buffer. Elmqvist et al. (Elmqvist et al., 2007)
presented a technique that uses dynamic transparency
for managing occlusion of important target objects
in 3D visualization applications. In these techniques
the focus is clearly highlighted but due to the trans-
parency effect, part of the context is lost.
3 ARC CONGESTIONS OVER A
GEOGRAPHIC SURFACE
The problem addressed by this work falls into the cat-
egory of ”occlusion problems in 3D visualization”
where the camera view, the environment itself and
its geometrical properties cause occlusion of objects.
In this particular scenario the problem is called ”arc
congestion over a geographic surface”, i.e. it de-
scribes the situation where a large numbers of three-
dimensional arcs occlude the nodes and their incident
arcs depicted over a geometric surface.
Formally, there is a 3D space U defined by a
Cartesian space (x,y,z) ∈ R
3
. A geographic surface
S is the surface of a volume V within U (i.e., subset of
U). The volume V can be a virtual globe or a flat plane
just to mention the more popular examples. Nodes in
the set N are points located over S. A 3D-arc a is
composed by a sequence of points p
1
, p
2
,..., p
n
∈ U
such that the first and the last points represent nodes
(i.e. p
1
, p
n
∈ N). Let S
0
be the area of interest over
S (i.e. S
0
⊂ S), N
0
contains the nodes of interest such
that are inside S
0
. A line segment r is blocked by an
object o if it intersects o. An arc a occludes S
0
if exists
a line segment r between the viewpoint position v and
S
0
such that r is blocked by a.
The arcs are classified, as shown in Figure 2, in
the following way:
• the arcs of interest are the ones with one endpoint
in N
0
.
• the arcs of high interest are the ones with both
endpoints in N
0
.
• the undesired arcs are the arcs that occlude S
0
that
are not arcs of interest neither arcs of high inter-
est.
• the context arcs are the arcs in background (i.e.
the arcs in the context).
Figure 2: The arcs are classified accordingly with their re-
lations with the area of interest.
3DArcLens:InteractiveNetworkAnalysisonGeographicSurfaces
293
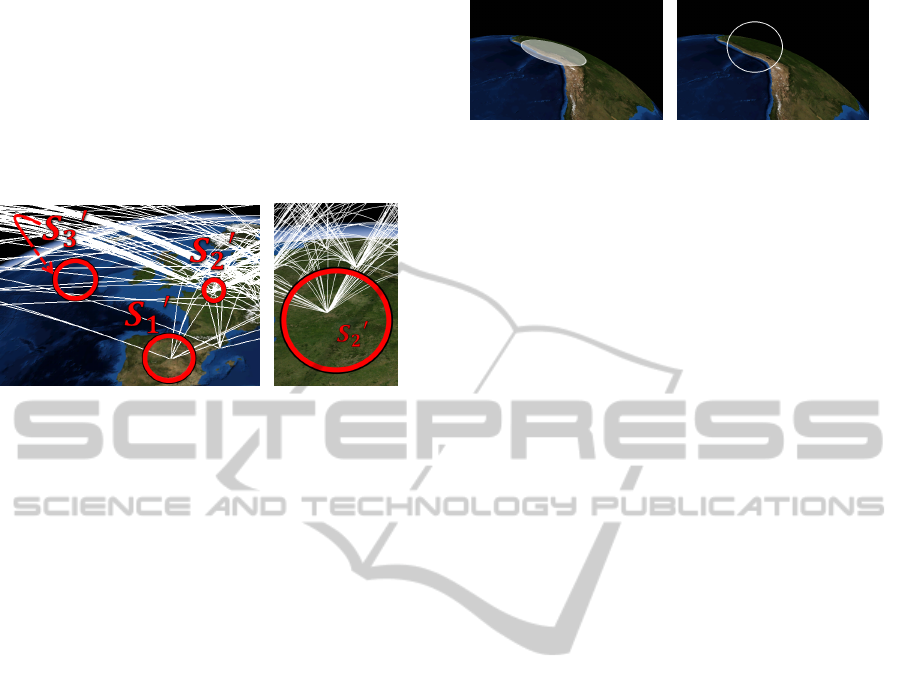
The area S
0
is defined as:
• not visible if there exists at least one line segment
r between v and S
0
such that r is blocked by V .
• visible if there are no line segment r between v
and S
0
such that r is blocked by V .
• fully visible if it is visible and there are no unde-
sired arcs.
(a) (b)
Figure 3: Arc congestion over a geographic surface. (a)
fully visible area (S
0
1
), visible area (S
0
2
) that is partially hid-
den by undesired arcs and not visible area (S
0
3
) occluded by
the globe. (b) After moving the camera the area S
0
2
becomes
f ully visible.
Figure 3 shows examples of arc congestion over
a geographic surface. There are three area of inter-
ests S
0
1
,S
0
2
, and S
0
3
identified by a colored circle. In
Figure 3(a), S
0
1
is fully visible, it is possible to see the
nodes inside the area and their connected arcs. S
0
2
is
visible, in fact some arcs occlude a part of its area,
thus also some nodes inside. Figure 3(b) shows the
same area S
0
2
but from a different camera view v, in
this case S
0
2
is fully visible. S
0
3
is placed in the hid-
den hemisphere so it is not visible, i.e. hidden by the
globe.
This paper proposes a solution to the following
question: How can we reduce the arc congestion in a
given area, revealing information about the nodes, the
arcs and the geographic surface independently from
the camera view?
This question is formalized by the definition of
the following requirements, which the desired solu-
tion has to satisfy:
1. No arc or node is removed from the scene to pre-
serve all the information related to the visible ele-
ments of the network.
2. Nodes are not moved due to the importance of
their geographical location.
3. The surface S must not be deformed due to the
importance of its geographical context.
4. The hidden information on the visible area S
0
must
be revealed, in particular about the following vi-
sual primitives, listed by importance in descend-
ing order: (a) The location of the nodes in N
0
. (b)
(a) (b)
Figure 4: (a) The lens is represented as a circle over the
globe, hence the lens’ shape is not distortion-free. (b) Our
adopted approach: the lens is a circle in 2D screen space.
The arcs of high interest. (c) The arcs of interest.
(d) The map layered on S
0
. (e) The undesired arcs,
although they cause the clutter, they may encode
useful information to the viewer. (f) The context
arcs.
5. A visible selected S
0
must be fully visible without
the need to change the viewpoint v.
6. After selecting an area of interest, the solution
must work also if the camera view is changed. Let
S
0
the visible selected area for a set of viewpoints
V , S
0
must be always fully visible.
4 PROPOSED APPROACH
As mentioned in Section 1, our goal is to facilitate the
exploration of both geographical network and layered
map with 3D view when arc congestion situations oc-
cur. Our proposed technique uses a lens metaphor that
is defined by a given point of focus and a radius.
The lens can be represented as a circle that fol-
lows the terrain. Therefore, its shape is not distortion-
free. As shown in Figure 4(a), if the camera is tilted
the area of the lens becomes oval. For this reason we
opted to represent the lens as a circle in screen space
with the radius r in pixels. Hence, the camera move-
ment does not affect the lens’ shape (Figure 4(b)) and
the zoom interaction does not change the lens radius.
Up to now we refer to S
0
as the area of interest that is
covered by the lens.
As shown in Figure 5, the lens works in the fol-
lowing way: the undesired arcs are distorted in a way
that they do not pass though the surface of the globe
covered by the lens (i.e. S
0
). The distortion is applied
not only to the subsegments affected by the lens, but
also to the entire curve making arcs easier to trace.
In fact the arcs are depicted as splines composed by
a sequence of control points. The arc congestion can
be also affected by arcs of interest, thus their subseg-
ments inside the lens are filtered out from the visual-
ization. This strategy permits to clearly identify the
nodes inside the lens and the arcs of high interest.
What is important to know about each arc is not its
IVAPP2015-InternationalConferenceonInformationVisualizationTheoryandApplications
294
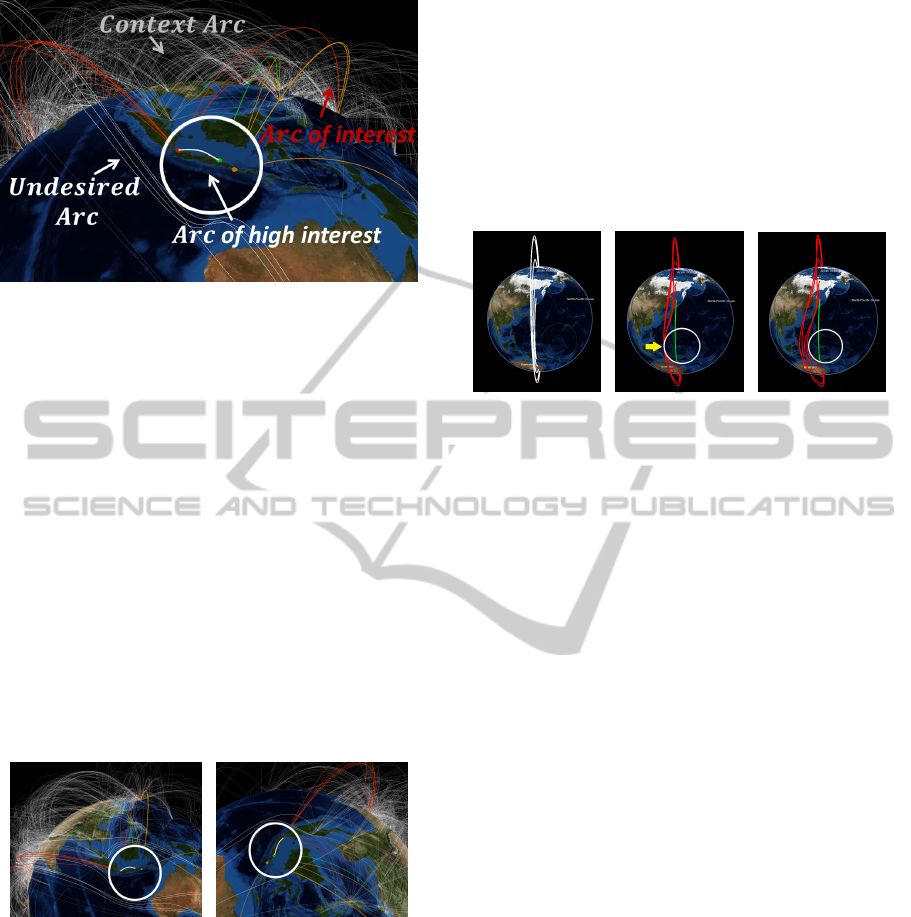
Figure 5: Each class of arcs is represented in a different
way. Context arcs are drawn with transparency, undesired
arcs are deformed, arcs of interest are colored differently
and parts of them are filtered out, and arcs of high interest
are white colored.
shape but which are the incident nodes. Bearing this
in mind, each node of interest is represented as a col-
ored sphere and each arc of interest is colored with the
same color of its incident node inside the lens. Nodes
of interest are therefore easily identified together with
their incidents arcs. Moreover, the surrounding map
is also revealed (requirement 4). If the user navigate,
tilt or pan the camera (i.e v changes) the lens still re-
veal hidden information of S
0
previously covered by
the lens (i.e. S
0
remains fully visible thus the require-
ment 6 is satisfied). In fact its movement is snapped to
the terrain to improve the system usability; the camera
movement affects the lens position in screen coordi-
nates but not its geographical position, (Figure 6).
(a) (b)
Figure 6: Navigation and panning using the lens to highlight
the edges and the nodes over a given location. The latter is
always focused from different camera view.
Moreover, the effect of the lens is transient, i.e. the
deformed arcs return to their original shape when not
marked as undesired arcs. If the user detects an area
that requires further investigation and that is cluttered
by arcs (i.e., S
0
is visible but not fully visible), then
without moving the camera (i.e. v does not change),
he/she can drag the lens to that geo-location to reveal
the hidden information (i.e. S
0
becomes fully visible
thus the requirement 5 is satisfied).
It might happen that arcs might share a common
space from a given perspective, as depicted in Fig-
ure 7(a). Hence, that arcs are shifted to the border of
the lens and because of its intersection (yellow arrow
on Figure 7(b)) the two sides of the arcs can no longer
be traced. Although this drawback can be solved by
applying different color for each arc, we instead de-
cided to update the arcs’s distance to the lens circum-
ference based on its distance to the point of focus (see
Figure 7(c)).
(a) (b) (c)
Figure 7: (a) Arcs sharing a common area. (b) Arcs affected
by the lens sharing a common area. (c) Arcs affected by the
lens with shapes easier to trace. In these images green arcs
are arcs of interests and red arcs are undesired arcs.
This distortion can have negative implications in
(1) the context arcs that are near the lens area, (2) the
deformed undesired arcs, (3) the arcs of interest and
consequently their incident nodes. However, in the
first case the arcs are the context thus for the analysis
of those visual elements the user can move the lens
over that location or increase the size of the lens. To
limit the second case all the context arcs are colored
with a medium level of transparency. Regarding the
last case, during the rendering phase the arcs of inter-
est are drawn on top of the other elements.
4.1 Implementation Details
Each arc is designed as a relaxed cubic spline com-
posed by a sequence of points p
1
, p
2
,..., p
n
∈ R
3
that
are defined by a sequence of equal-distance control
points cp
1
,cp
2
,...,cp
m
∈ R
3
where cp
1
is the source
node and cp
m
is the target node, see Figure 8(a). We
use this kind of curve because it is possible to design a
polynomial curve segments controlling their shape in
an easy way and that pass through given data points.
The altitude of the control points over the ge-
ographical surface follows the formula of similar
works (Cox et al., 1996; Munzner et al., 1996):
1 + H sin(xπ ) where H is the maximum height and
x varies between 0 and 1 along the arcs path. In order
to take into account the path length l, the H parameter
is equal to l/4.
To detect whether a point that composes the arc
or a node is contained inside the lens area we use the
two combined approaches: (1) in screen coordinates
3DArcLens:InteractiveNetworkAnalysisonGeographicSurfaces
295
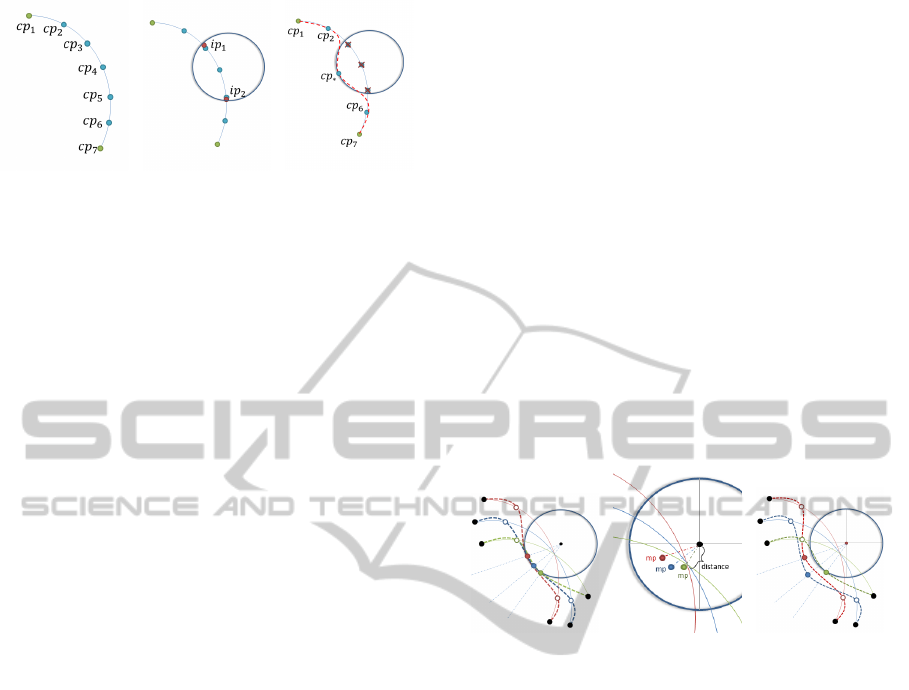
(a) (b) (c)
Figure 8: The steps required to apply the effects of the lens
over the arcs are: (a) each arc is composed by m control
points, (b) one or more couples of consecutive intersecting
points are detected, (c) for each couple a new control point
is used to deform the arc.
the distance between the element and the lens center
must be less that the lens radius. (2) using a ray-cast
technique we check if the line that connects the view-
point with the element in the world space does not
intersect the surface.
Arcs Deformation. The main aspect of the de-
formation of undesired arcs is that the original con-
trol points are removed and then new control points
are created making curves more aesthetically pleas-
ing and easier to trace. For this class of arcs the al-
gorithm is defined by two steps that are executed at
every frame, before the main rendering phase:
Step 1. In the first step the undesired arcs are
found and the intersecting points between these arcs
and the circumference of the lens are detected. These
points are defined as ip
1
,ip
2
,... ⊂ p
1
, p
2
,..., p
n
such
that, in screen coordinates, they are the nearest to
the real intersection points ∈ R
2
. Then, the algo-
rithm identifies the couples of consecutive intersect-
ing points that will be used to create the new control
points of the cubic curve (see Figure 8(b)). This step
is based on a GPU-based implementation to achieve
an acceptable frame rate. The points that compose
the lines are passed to the GPU into a single buffer
and then a geometry shader computes the intersecting
points to be passed to the next step using the trans-
form feedback buffer.
Step 2. In this step, the sets of control points are
updated and the arcs are redrawn. As shown in Fig-
ure 8(c), for each undesired arc, the control points in-
side the lens are removed and a new control point cp
?
is created and placed over the lens’ circumference.
The formula to calculate the screen coordinates of
the new control point cp
?
starting from the couple of
points {ip
1
,ip
2
} is the following:
mp = (ip
1
+ ip
2
)/2;
cp
?
= c + r ∗
ˆ
(mp − c);
mp is the middle point between ip
1
and ip
2
, c is
the center of the lens and r is the radius of the lens.
The aforementioned formula is applied to the x and
y attribute of cp
?
, meanwhile the z dimension, that is
the screen depth-coordinate, is calculated taking the
middle value between the z of ip
1
and ip
2
. Finally the
deformed arc is drawn reconverting the cp
?
in world
coordinates and recomputing the points p
1
, p
2
,... , p
n
.
Control Points Relocation. A feature that im-
proves the scenario where the shifted arcs can no
longer be traced, (see Figure 9(a)), is described in the
following steps:
Step 1. The lens is divided in p sections of equal
area. For each new control point cp
?
, the distance in
screen coordinates between its associated mp and the
center lens is stored, (see Figure 9(b)). Therefore for
each section, a list of control points ordered accord-
ingly with their distance is computed.
Step 2. Each control point is moved from the lens
center, accordingly to the distance as depicted in Fig-
ure 9(c). A maximum distance is defined to limit the
effect in a closed area around the lens.
(a) (b) (c)
Figure 9: (a) the basic solution: new control points are
placed around the lens. (b) the lens is subdivided in sec-
tions. Control points are ordered accordingly to the distance
factor relative to their sector. (c) control points are placed
at different distances from the lens center around the lens.
The sector-based approach is applied to separate
the control points that do not share the same loca-
tion in screen space. For example if there are two
deformed arcs respectively on the opposite sides of
the lens, due to the fact that are in different sections
no control point will be relocated.
Arc Segments Filtering. For the creation of the
arcs of interest the steps are the following:
Step 1. As preprocessing phase a different color is
assigned for each node. During the rendering phase,
if the node is inside the lens and it is visible, than a
sphere colored with the node’s color is generated.
Step 2. Every part of the arc inside the lens
is drawn completely transparent using the blending
function, and the rest of the arc is colored with the
same color of its incident node inside the lens.
In order to facilitate the interaction with the sys-
tem, we added two graphical components to the GUI:
a slider interface allowing the user to readjust the lens
radius and a button to place the lens at the center of
IVAPP2015-InternationalConferenceonInformationVisualizationTheoryandApplications
296
the screen. This last feature is handy when the user
loses sight of the lens while navigating.
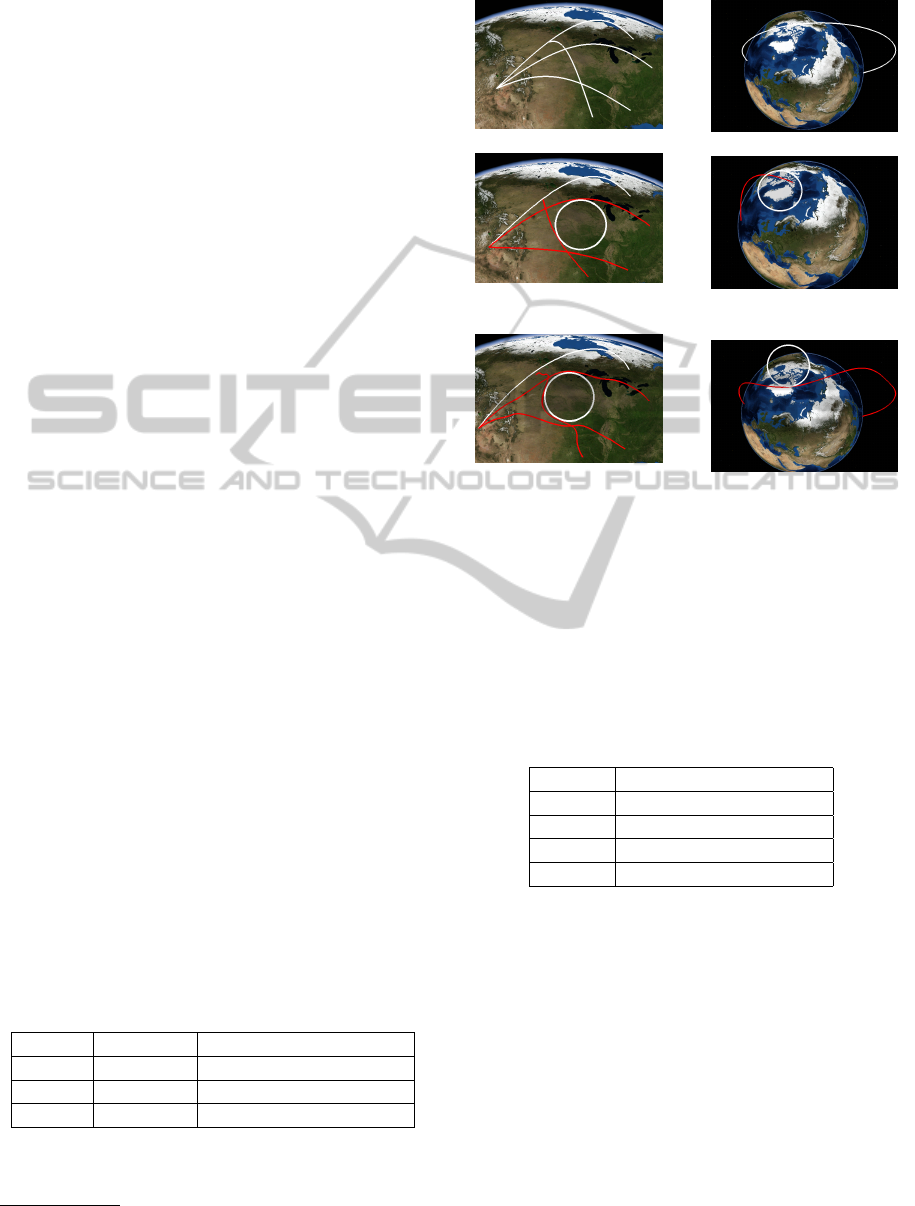
4.2 Input Parameters
The parameters required by the algorithm affect di-
rectly the quality of the result. The first parameter
is the number of control points m. If the number of
control points is too high the deformation technique
affects only a small localized area and if m is too
low the edges are deformed along their entire length.
As depicted in Figure 10, the advantage of using low
number of control points appears evident, however, if
the geographical surface is over a globe and both inci-
dents nodes are placed in different hemisphere, there
are extreme cases where the curve may pass through
the geographical surface. For such reason, we set m
equal to 7, to avoid to overlapping with the globe. The
second parameter is the number of sections p, if p is
high, only the control points close with each other will
be placed with different distances from the lens cen-
ter. As opposite, if the value is too low, more layers
will be used. This decision is up to the user. In our
tests we used p = 4. Another parameter is the number
of points n that compose each arc. Higher the value
is and smoother will be the curve. We set n = 200
to have a good balance between the aesthetic result
and the performance. The last parameter is the radius
of the lens r. Since this value has a considerable im-
pact on the effectiveness of the proposed technique,
the user can modify the lens size during the explo-
ration of the network.
4.3 Performance
In order to measure the performance of our technique
we take as metric the frame rate. 3DArcLens was de-
veloped extending NASA WorldWind
1
, an open source
virtual globe, and was tested on a single proces-
sor Intel Xeon 2.26 GHz equipped with an NVIDIA
GeForce GTX 280 with 1024 MB dedicated video
memory. Table 1 shows the fps on WorldWind with
and without 3DArcLens taking into account datasets
with different number of arcs tot arcs.
Table 1: The fps are shown with and without the use of
3DArcLens on WorldWind.
tot arcs fps (WW) fps (WW + 3DArcLens)
600 55 - 56 20 - 22
3000 33 - 35 15 - 17
15000 8 - 10 6 - 7
The performance of 3DArcLens depends mainly
on the number of arcs that are distorted. The Table 2
1
http://worldwind.arc.nasa.gov/java/
(a) Short edges
Initial situation
Good case with low
number of control points
Bad case with high
number of control points
(b) Long edges
Initial situation
Bad case with low
number of control points
Good case with high
number of control points
Figure 10: Two situations, one with short length edges (a)
and one with long edges (b). Examples showing advantages
and drawbacks of using high and low number of control
points. In these images the red color is used to depict unde-
sired arcs.
shows the fps on WorldWind taking into account the
deformed arcs of the dataset with 3000 arcs.
Table 2: The fps and the number of deformed arcs are shown
on WorldWind.
def arcs fps (WW + 3DArcLens)
0 21
150 18
300 15
400 13
5 DISCUSSION
At the current stage of the research there are no inter-
action techniques that can effectively reveal the infor-
mation about arcs, nodes and geographical surfaces
hidden behind an area congested in a 3D virtual envi-
ronment.
EdgeLens (Wong et al., 2003) is a technique that
iteratively curves graph edges, that are represented by
2D straight lines, away from the point of focus in a 2D
plane. Although it helps to disambiguate the relation-
ship between nodes and edges without losing infor-
3DArcLens:InteractiveNetworkAnalysisonGeographicSurfaces
297

mation, it can not solve the arc’ congestion problem
due to the following:
Arcs’ Shape. In a 2D space, a straight line is de-
formed by taking into consideration the start and end
points (together with the lens focus and radius). With
3D arcs, the distortion and selection of these objects
is more complex.
The View Camera Information. The behavior of
the lens depends also on the position of the view cam-
era; if the view camera changes, the arcs affected can
differ in both number and shape.
The Occlusion Problem. In 3D virtual environ-
ments the effect of occlusion has to be considered;
arcs that intersect the lens having their extremities be-
hind a geographical surface can generate undesirable
behaviors.
The coordinate systems. In 3D virtual environ-
ments, the distortion process must take into account
the screen coordinates and the world coordinates.
MoleView (Hurter et al., 2011) is another inter-
active technique to reveal what is hidden behind a
congested area. The control points of the edges are
moved around the lens meanwhile the edges which
are selected in the lens stay unmoved, making them
easy to spot. Although this technique gives satisfac-
tory results it differs from 3DArcLens in the follow-
ing:
Information About Arcs. 3DArcLens puts more
effort on the traceability of arcs. In particular, the
control points affected by the lens are replaced with
others that are placed in different ”orbits” around the
lens. Additionally, the arcs that are contained inside
the lens are clutter free.
Geographical Context. Our technique allows not
only the graph elements to be visualized but also the
map inside the lens to be depicted without visual clut-
ters.
Interactive Navigation. In our technique the cam-
era view is also taken into account. This implies that
if the lens highlights a geographical area and the cam-
era view moves, then the lens remains still but the way
it reveals what is hidden in that area maybe differ.
Although choosing suitable colors is fundamental
for an effective utilization of 3DArcLens the definition
of a proper color pattern is not the aim of this work.
Moreover, the effectiveness of the colors assigned to
nodes depends on the task that has to be accomplish.
For example one task might involve information about
node attributes that can be encoded in a color pattern
defined at priori.
A potential shortcoming may arises if the dataset
presents a large number of connected nodes in a small
location that is totally covered by the lens. In such
case the visual clutter is caused by the arcs of high
interest. However, if the area of interest is reduced,
changing the lens radius or zooming in, can consider-
ably alleviate this issue.
6 CONCLUSION
In this paper we describe 3DArcLens, an interactive
technique for exploring both geographical networks
and geographic surfaces.
Our aim is to enrich tools that can depict geo-
graphical networks, e.g. the virtual globes imple-
mented by Cox et al. (Cox et al., 1996), Munzner et
al. (Munzner et al., 1996), Buschmann (Buschmann
et al., ), Google Earth
2
and NASA WorldWind, as
well as the ArcMap technique, see Figure 11.
(a) (b)
Figure 11: 3DArcLens applied on an ArcMap.
In our informal test cases, we observed certain ad-
vantages in applying our technique to the exploration
of geographical networks. Overall our technique can
increase the effectiveness on low-level tasks for graph
analysis. Since it is locally applied to a specific area,
higher-level tasks such as finding connectivity pat-
terns remain difficult. Also, for datasets with ∼3000
edges the frame rate was acceptable. Yet, it might
drop for much larger datasets. Future improvements
include shifting the generation of the splines to the
GPU side and the definition of an evaluation strategy.
ACKNOWLEDGEMENTS
This research has been supported by the European
Commission (EC) under the project LIFE+IMAGINE
(Grant Agreement N. 325232). The authors are solely
responsible this work which does not represent the
opinion of the EC. The EC is not responsible for any
use that might be made of information contained in
this paper.
2
http://www.google.com/earth/
IVAPP2015-InternationalConferenceonInformationVisualizationTheoryandApplications
298

REFERENCES
Becker, R. A., Eick, S. G., and Wilks, A. R. (1995). Vi-
sualizing network data. Visualization and Computer
Graphics, IEEE Transactions on, 1(1):16–28.
Bell, B., Feiner, S., and H
¨
ollerer, T. (2001). View man-
agement for virtual and augmented reality. In Pro-
ceedings of the 14th annual ACM symposium on User
interface software and technology, pages 101–110.
ACM.
Buschmann, S., Nocke, T., and Tominski, C. Towards visu-
alizing geo-referenced climate networks.
Coffin, C. and Hollerer, T. (2006). Interactive perspective
cut-away views for general 3d scenes. In 3D User
Interfaces, 2006. 3DUI 2006. IEEE Symposium on,
pages 25–28. IEEE.
Cox, K. C., Eick, S. G., and He, T. (1996). 3d geographic
network displays. ACM Sigmod Record, 25(4):50–54.
Cui, W., Zhou, H., Qu, H., Wong, P. C., and Li, X. (2008).
Geometry-based edge clustering for graph visualiza-
tion. Visualization and Computer Graphics, IEEE
Transactions on, 14(6):1277–1284.
Debiasi, A., Sim
˜
oes, B., and De Amicis, R. (2014). Super-
vised force directed algorithm for the generation of
flow maps. In Proceedings of the WSCG 2014 - 22nd
International Conference on Computer Graphics.
Elmqvist, N., Assarsson, U., and Tsigas, P. (2007). Em-
ploying dynamic transparency for 3d occlusion man-
agement: Design issues and evaluation. In Human-
Computer Interaction–INTERACT 2007, pages 532–
545. Springer.
Elmqvist, N. and Tudoreanu, M. E. (2007). Occlusion man-
agement in immersive and desktop 3d virtual environ-
ments: Theory and evaluation. IJVR, 6(2):21–32.
Furnas, G. W. (1986). Generalized fisheye views, vol-
ume 17. ACM.
Holten, D. and Van Wijk, J. J. (2009). Force-directed edge
bundling for graph visualization. In Computer Graph-
ics Forum, volume 28, pages 983–990. Wiley Online
Library.
Hurter, C., Telea, A., and Ersoy, O. (2011). Moleview:
An attribute and structure-based semantic lens for
large element-based plots. Visualization and Com-
puter Graphics, IEEE Transactions on, 17(12):2600–
2609.
Kaur, K., Sutcliffe, A. G., and Maiden, N. A. (1999). To-
wards a better understanding of usability problems
with virtual environments. In Proceedings of INTER-
ACT, volume 99, pages 527–535.
Looser, J., Billinghurst, M., and Cockburn, A. (2004).
Through the looking glass: the use of lenses as an in-
terface tool for augmented reality interfaces. In Pro-
ceedings of the 2nd international conference on Com-
puter graphics and interactive techniques in Australa-
sia and South East Asia, pages 204–211. ACM.
McGuffin, M. J., Tancau, L., and Balakrishnan, R. (2003).
Using deformations for browsing volumetric data. In
Visualization, 2003. VIS 2003. IEEE, pages 401–408.
IEEE.
Moscovich, T., Chevalier, F., Henry, N., Pietriga, E., and
Fekete, J.-D. (2009). Topology-aware navigation in
large networks. In Proceedings of the SIGCHI Confer-
ence on Human Factors in Computing Systems, pages
2319–2328. ACM.
Munzner, T., Hoffman, E., Claffy, K., and Fenner, B. G.
N. D. (1996). Visualizing the global topology of the
mbone. In Information Visualization’96, Proceedings
IEEE Symposium on, pages 85–92. IEEE.
Pietriga, E. and Appert, C. (2008). Sigma lenses: focus-
context transitions combining space, time and translu-
cence. In Proceedings of the SIGCHI Conference on
Human Factors in Computing Systems, pages 1343–
1352. ACM.
Schmidt, S., Nacenta, M. A., Dachselt, R., and Carpendale,
S. (2010). A set of multi-touch graph interaction tech-
niques. In ACM International Conference on Interac-
tive Tabletops and Surfaces, pages 113–116. ACM.
Sheelagh, M., Carpendale, T., Cowperthwaite, D. J., and
Fracchia, F. D. (1996). Distortion viewing techniques
for 3-dimensional data. In Information Visualiza-
tion’96, Proceedings IEEE Symposium on, pages 46–
53. IEEE.
Tobler, W. R. (1970). A computer movie simulating urban
growth in the detroit region. Economic geography,
pages 234–240.
Tobler, W. R. (1987). Experiments in migration mapping by
computer. The American Cartographer, 14(2):155–
163.
Tominski, C., Abello, J., van Ham, F., and Schumann, H.
(2006). Fisheye tree views and lenses for graph vi-
sualization. In Information Visualization, 2006. IV
2006. Tenth International Conference on, pages 17–
24. IEEE.
Viega, J., Conway, M. J., Williams, G., and Pausch, R.
(1996). 3d magic lenses. In Proceedings of the 9th
annual ACM symposium on User interface software
and technology, pages 51–58. ACM.
Wong, N. and Carpendale, S. (2007). Supporting interactive
graph exploration with edge plucking. Proc. VDA’07.
Wong, N., Carpendale, S., and Greenberg, S. (2003). Edge-
lens: An interactive method for managing edge con-
gestion in graphs. In Information Visualization, 2003.
INFOVIS 2003. IEEE Symposium on, pages 51–58.
IEEE.
Zhou, H., Xu, P., Yuan, X., and Qu, H. (2013). Edge
bundling in information visualization. Tsinghua Sci-
ence and Technology, 18(2):145–156.
3DArcLens:InteractiveNetworkAnalysisonGeographicSurfaces
299
