
Quantitative Scoring of Muscle Involvement in MRI of
Neuromuscular Diseases
M. E. Fantacci
1,2
, G. Astrea
3
, R. Battini
3
, A. Retico
2
, C. Sottocornola
1,2
and M. Tosetti
3
1
Physics Department, Pisa University, Largo Pontecorvo 3, Pisa, Italy
2
Pisa Section of INFN, Pisa, Italy
3
Stella Maris Scientific Institute, Calambrone, Pisa, Italy
Keywords: Muscle MRI, Neuromuscular Diseases, Muscle Segmentation.
Abstract: An automated method to evaluate the fat infiltration in tissues has been developed and applied to images of
the human leg. The final aim is to obtain a quantitative evaluation of fat infiltration percentage and to relate
it to the grade of muscle impairment in subjects affected by Neuro-Muscular Diseases (NMD). Through a
muscle segmentation algorithm on structural T1-weighted magnetic resonance images (MRIs), the estimated
non-muscle percentage (eNMP) in the segmented muscle area has been evaluated in healthy subjects as a
reference value. A semi-automated procedure allows extending the algorithm to MRIs of NMD patients. A
strong correlation has been demonstrated between the eNMP index and the disease severity.
1 INTRODUCTION
Magnetic Resonance Imaging (MRI) is an extremely
useful imaging method to carry out reliable and non-
invasive clinical assessment and follow up of
subjects affected by NeuroMuscular Diseases
(NMD).
In particular, as MRI is able to detect muscle
involvement and to reveal the severity of disease, it
is already used also in pediatric protocols for
diagnostic study of NMD (Mercuri, 2002).
However, the interpretation of muscle MRI data
and the assessment of NMD severity is currently
carried out only visually by expert neurologists;
software tools for automated quantitative analysis of
muscle MRI have not yet been developed and
provided in clinical diagnostic protocols.
Standardization procedures and quantitative methods
could be very useful instruments to optimize the
muscle MRI diagnostic performance.
Recently the muscle fat fraction (MFF) has been
evaluated (Gaeta, 2011; Gaeta, 2012), relying on the
dual-echo dual-flip-angle spoiled gradient-recalled
acquisition in the steady state (SPGR) magnetic
resonance (MR) imaging technique. The muscle
biopsy has been used in that case as reference
standard.
A quantitative assessment has been made with
Dixon method (Dixon, 1984) to highlight significant
increase in fat fraction in longitudinal studies
(Willis, 2013).
Quantitative 3-point Dixon method has been
compared to qualitative radiological scoring,
concluding that the qualitative method overestimates
the fat fraction (Wokke, 2013). In all cases, manual
segmentation of each single muscle, which is an
extremely time consuming task and hardly
reproducible across different experts, is needed to
compute the fat faction in each ROI. Attempts to
automatize the segmentation of skeletal muscles on
Dixon images have recently been introduced, e.g.
the automated computation of the fat fraction
thought the extraction of subcutaneous adipose
tissue with parametric deformable models
(Makrogiannis, 2012) and the segmentation of calf
muscles through Random Walks with shape prior
information (Baudin, 2012).
In this paper we present a method for automatic
quantitative analysis of T1-weighted Spin Echo
(T1w SE) MR images of the leg, based on
algorithms for tissues segmentation and histograms
analysis. This method has been assessed on the
images of healthy volunteers with the extraction of
information used as reference standard in the
analysis of the images of NMD patients in order to
obtain a quantification of their fatty infiltrations and
to study its correlation with the grade of muscle
impairment in the NMD pathology.
100
Fantacci M., Astrea G., Battini R., Retico A., Sottocornola C. and Tosetti M..
Quantitative Scoring of Muscle Involvement in MRI of Neuromuscular Diseases.
DOI: 10.5220/0005255801000105
In Proceedings of the International Conference on Bioimaging (BIOIMAGING-2015), pages 100-105
ISBN: 978-989-758-072-7
Copyright
c
2015 SCITEPRESS (Science and Technology Publications, Lda.)

2 MATERIALS AND METHODS
2.1 Subjects
Sixteen NMD patients and ten healthy subjects (HS)
were considered for this study.
Patients age ranges between 1 to 54 years. In our
Institute clinical studies follow the ethical guidelines
of our local ethics committee. Informed written
parental consent was obtained before the enrollment
in the study. As expected, any side effects from
muscle MRI examination has not observed. This
examination is now routinely performed and does
not require the use of anesthetic in young children
after the 6 or 7 years of age. Sometimes muscle MRI
has been performed in children less 6 yrs of age
following general anaesthesia when brain MRI has
been also required for diagnostic investigation.
The Medical Research Council (MRC) scale was
used to assess the weakness in lower limbs. Patients
were stratified in the five classes listed below
according to MRC scores and maximal functional
motor achievement: class 1 asymptomatic, class 2
mild symptomatic, class 3 moderate symptomatic,
class 4 severely symptomatic, class 5 non-
ambulatory. All patients except one were
ambulatory.
The MRI exams of NMD patients were acquired
between 2011 and 2012 at the MR laboratory of
IRCCS Stella Maris Institute (Pisa, Italy) with a
1.5T scanner MR Signa GE Medical Systems HdxT
with a whole body TX-RX coil. The standard MR
protocol consisted of a 2D axial T
1-weighted Spin
Echo sequence with acquisition matrix of 256 x 256,
FOV = 44 cm x 44 cm, TE = 14 ms and TR = 540
ms. The resulting images have an in-plane resolution
of 1.72 mm x 1.72 mm and 5 mm of slice thickness.
Only the scan of the proximal third of the thigh
of each subject was taken into account for analysis.
All images were qualitatively assessed for the
presence/absence of fat infiltration by a pediatric
neurologist expert in muscle MRI, using the Mercuri
grading (Mercuri, 2002).
The MRI scans of the ten healthy volunteers
(healthy subjects, HS) have been acquired with the
same acquisition protocol to obtain the reference
standard for the eNMP (estimated Non Muscle
Percentage) index in the healthy condition.
2.2 Software Tools
MRI data were analyzed with the medical image
processing and visualization tool MeVisLab (MeVis
Medical Solutions AG and Fraunhofer MEVIS in
Bremen, Germany, http://www.mevislab.de/). It
consists in an image-processing environment with a
special focus on visualization and analysis of
diagnostic images. It is structured in a modular
framework, where algorithms for segmentation,
registration and quantitative image analysis can be
implemented. It is based on Python programming
language and modular expandable C++ image
processing libraries. The Insight Toolkit (ITK) and
Visualization Toolkit (VTK) software are integrated;
they are open-source, freely available software
systems that support computer graphics, image
processing, modeling techniques and advanced
visualization applications.
2.3 Characterization of Healthy
Subjects
The MRI data set of the ten healthy subjects was
studied in order to make an automatic analysis of
anatomical features such as geometry and signal
intensity of muscle and fat tissues.
We introduced an original index, the eNMP
index, to take into account the fraction of non-
muscle tissues, which are present within the muscle
area. More in details, considering as muscle area the
geometric area defined on the MR image excluding
the bone and the subcutaneous fat by means of a
segmentation procedure, it is evident that in this area
blood vessels, nerves, fat and connective tissue are
still included. By the eNMP index, the percentage of
any tissues different from muscle included in the
delineated muscle area is taken into account. To the
best of our knowledge this reference standard
obtained in the analysis of healthy subjects has not
previously been reported in the literature.
The basic idea of the whole analysis is to take
advantage of the different signal intensity of muscle
and fat in MR images. An example of thigh MR
image is shown in Figure 1, where the main muscle
districts, the subcutaneous fat and the femur bone
are clearly visible.
2.3.1 Image Histogram Analysis
The analysis has been performed on a particular 2D
image of the thigh, i.e. a slice selected by the child
neurologist, where all the muscle sectors are clearly
visible (at about half thigh length). It starts with a
multiple Gaussian fit of the histogram of the image
intensity values. Assuming that voxels values which
are respectively part of muscle and fat tissue follow
Gaussian distributions, a process of curve fitting has
been executed in each histogram by using a least
QuantitativeScoringofMuscleInvolvementinMRIofNeuromuscularDiseases
101

squares fit method to find the mean and standard
deviation values of subcutaneous fat and muscle
distributions.
Figure 1: An axial T1-weighted MR image through the
middle thigh of a healthy subject acquired with a 1.5 T
MRI scanner.
The ratio between the fitted subcutaneous fat and
muscle peaks (
and
F
) has been computed for all
subjects and averaged, thus generating a standard
reference measure of the ratio (R =
F
/
) of the
intensity values of fat and muscle.
The ratio between the fitted subcutaneous fat and
muscle peaks (
and
F
) has been computed for all
subject and averaged, thus generating a standard
reference measure of the ratio (R =
F
/
) of the
intensity values of fat and muscle.
2.3.2 Muscle Area Segmentation
In the following step an automatic segmentation
method has been performed in order to isolate
muscle tissue from femur bone and subcutaneous
fat; the objective was to quantify the percentage of
voxels of non-muscular tissue as blood vessels,
nerves and connective tissue present in muscular
districts present in muscular district.
The automatic segmentation algorithm has been
developed and implemented using a
CSOIsoGenerator (Contour Segmentation Objects)
module algorithm of the MeVisLab software
package. The CSO library provides data structures
and modules for an interactive or an automatic
generation of contours in voxel images.
Furthermore, these contours can be analyzed,
maintained, grouped and converted into a voxel
image or a set of markers. The module
CSOIsoGenerator generates iso-contours for a whole
image at a fixed iso value: the input image is
scanned by a marching-square algorithm that always
produces closed CSOs. The border is treated as
being always lower that the iso value and the CSOs
can be interpolated by a linear interpolation scheme
and/or smoothed by applying a spline
approximation. A Creation mode lets the user adjust
which CSOs on one slice should be kept; if the mode
is set to All, all CSOs are kept. If it is set to Largest,
only the largest CSO (measured in number of seed
points) on a slice is kept of the generating contours.
In our case, two different ISO contours are
needed to isolate the muscle tissue from neighboring
bone and subcutaneous fat. Within the segmented
muscle area, also non-muscle components are
present, including fat, connective tissue, nerves and
blood vessels.
2.3.3 ENMP Index Evaluation
Allowing that the muscle tissue shows intensity
values are in the
± 3 range, where
is the
fitted central of the muscle peak in the intensity
histogram of each subject and is the standard
deviation according to our Gaussian distribution
assumption.
The eNMP has thus been computed (1) as the
ratio of non-muscle components in the segmented
muscle area:
eNMP
∑
|
|
|
∑
|
∀ ∈ (1)
where n
i
is the number of voxels with intensity I
i
and
i runs on all voxels belonging to the mask M, i.e. the
muscle mask identified with the iso-contour based
segmentation algorithm.
The eNMP index has been evaluated for all HC
subjects and its average value constitutes the
reference standard for the healthy population.
2.4 Analysis of NMD Patients
The evaluation of the eNMP has been carried out
also on NMD subjects with the final aim to correlate
it with the grade of muscle impairment in the NMD
pathology.
In this case it is unfortunately very difficult to
discriminate the subcutaneous fat from the fat
infiltrated in the muscle with an automated
segmentation procedure, as shown in the two
example of Figure 2. For this reason, an expert child
neurologist was asked to interactively draw the
manual subcutaneous fat delineation contour, thus
defining the muscle masks also in case of NMD
subjects. Once verified the validity of the method, in
the near future it may be possible an automatic
segmentation of the muscle area by means of a
three-dimensional image analysis based on
innovative image processing methods developed for
very noisy image segmentation as, for example
BIOIMAGING2015-InternationalConferenceonBioimaging
102
virtual ants based models (Cerello, 2010). Taking
into account the known ratio R between the intensity
values of fat and muscle in our images, and
measuring trough a Gaussian fit the average value of
the fat (
F
) in the MRI image of a NMD patient, the
corresponding
has be obtained. The eNMP index
has thus been evaluated also for NMD subjects and
is available for correlation with the NMD severity.
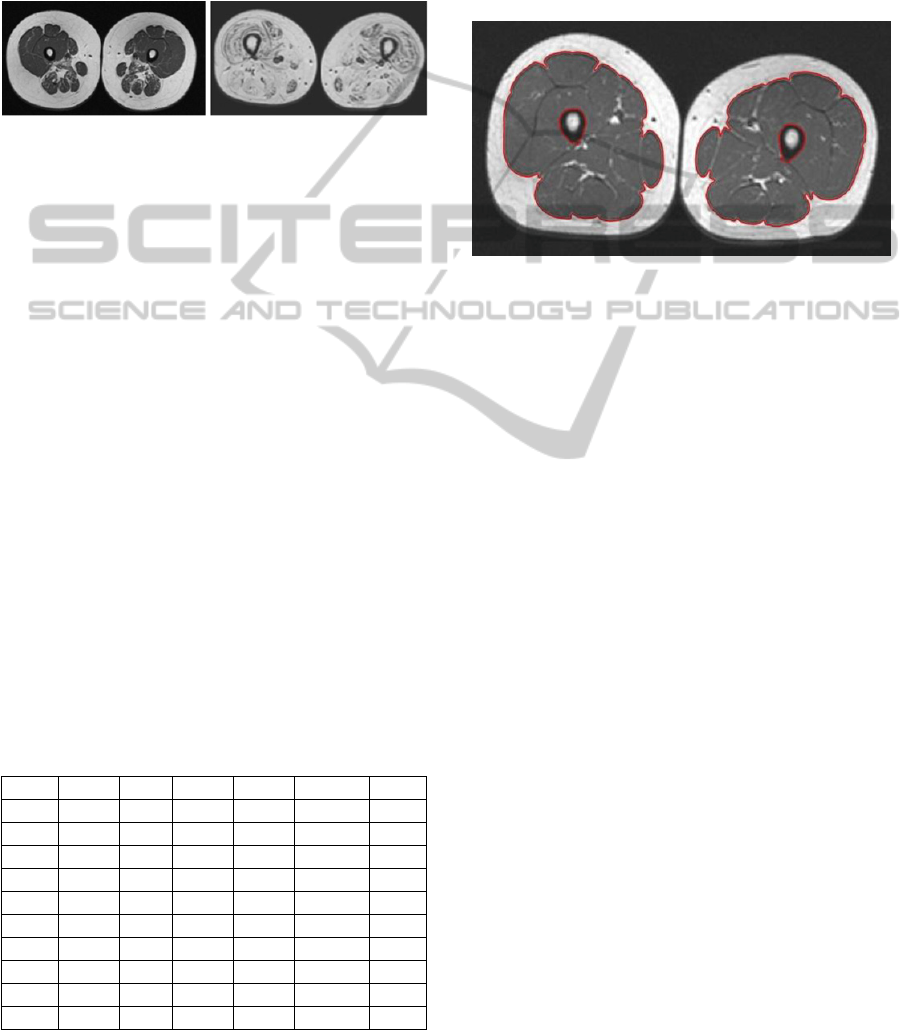
Figure 2: Two examples of axial image of thighs in NMD
patients. On the left a NMD patient with a low-grade
MRC score (mild symptomatic) and mild involvement of
thigh muscles in the posterior compartment. On the right a
second patient with a high-grade MRC score (severely
symptomatic) and massive fat infiltration of all the thigh's
muscles with only minimal preservation.
3 RESULTS
To compute the eNMP index, first of all the
M
,
,
F
and
F
values were obtained trough a multiple
Gaussian fit on the image histogram of the ten
healthy subjects. The values obtained are reported in
Table 1, where also the ratio R =
F
/
is shown
together with the estimated error on these quantities.
The average ratio results R
M
= 3.4 ± 0.3. This
quantity has been used as a reference standard in the
analysis of NMD patients. The eNMP index
computed for each HS is also reported in Table 1. It
can be noticed that the eNMP indices computed on
HS never exceeded the threshold of 7%.
Table 1: The
M
,
M
,
F
and
F
values obtained through a
Gaussian fit on the image histogram for each HS are
reported. The ratio R=
F
/
M
is also shown. The last
column reports the eNMP index obtained of each HS.
ID
m
m
f
f
R
eNMP
HS1
174.7 27.2 601.0 93.7 3.4±0.8 6.3%
HS2
162.3 25.8 548.0 91.4 3.4±0.8 5.1%
HS3
165.2 14.3 550.1 121.0 3.3±0.9 3.5%
HS4
146.6 25.0 470.6 109.5 3.2±0.9 6.2%
HS5
170.1 24.0 571.9 125.5 3.4±0.9 6.2%
HS6
177.3 30.6 615.8 89.6 3.5±0.8 6.6%
HS7
187.0 42.8 694.0 108.3 3.7±1.0 4.4%
HS8
164.7 30.4 542.0 114.1 3.3±0.9 6.5%
HS9
182.5 32.4 670.1 107.8 3.7±0.9 4.2%
HS10
189.6 28.4 669.4 87.5 3.5±0.7 6.3%
In the segmentation step to isolate muscle tissue
from femur bone and subcutaneous fat the input
image has been scanned by a marching-square
algorithm that produces closed contour segmentation
objects. The largest contour defines the boundary
between the muscle and the surrounding
subcutaneous fat, whereas the smaller defines the
boundary between the muscle and the femur bone, as
shown in Figure 3.
Figure 3: Example of automatic segmentation of femur
bone and muscular district in a HC subject: the iso-contour
generator module provides closed contours at fixed iso-
values.
The muscle peak in the histograms of the images
of NMD patients is far less evident, when not
completely absent, whereas the fat peak is higher
due to fat replacement in muscular area. Only the
F
and
F
values have thus been extracted through a
Gaussian fit from the histogram of the images of
NMD subjects and are reported in Table 2. The
corresponding
M
and
M
expected values have been
obtained for each NMD subject according to the
average coefficient R
M
estimated in the analysis of
HC subjects. The so obtained eNMF indices are also
reported for the NMD subjects in Table 2. It can be
noticed that the eNMP indices obtained on NMD
subjects are generally higher with respect to the HC
subjects. The eNMP indices we computed on NMD
subjects have also shown a positive correlation with
the grade of muscle impairment in NMD subjects as
well as it was evaluated from a clinical point of view
by means of the MRC scale and from an imaging
point of view with a visually grading (Mercuri,
2002). In particular, a strong correlation has been
found between the visually scored muscle
involvement (Mercuri grading) and the quantitative
eNMP index estimated on MR images. In Figure 4
the scatter plot of the Mercuri grading versus the
eNMP index is reported.
As the correlation between muscle involvement
and disease severity is known not to be a linear
function, with small advance of fat infiltration being
QuantitativeScoringofMuscleInvolvementinMRIofNeuromuscularDiseases
103
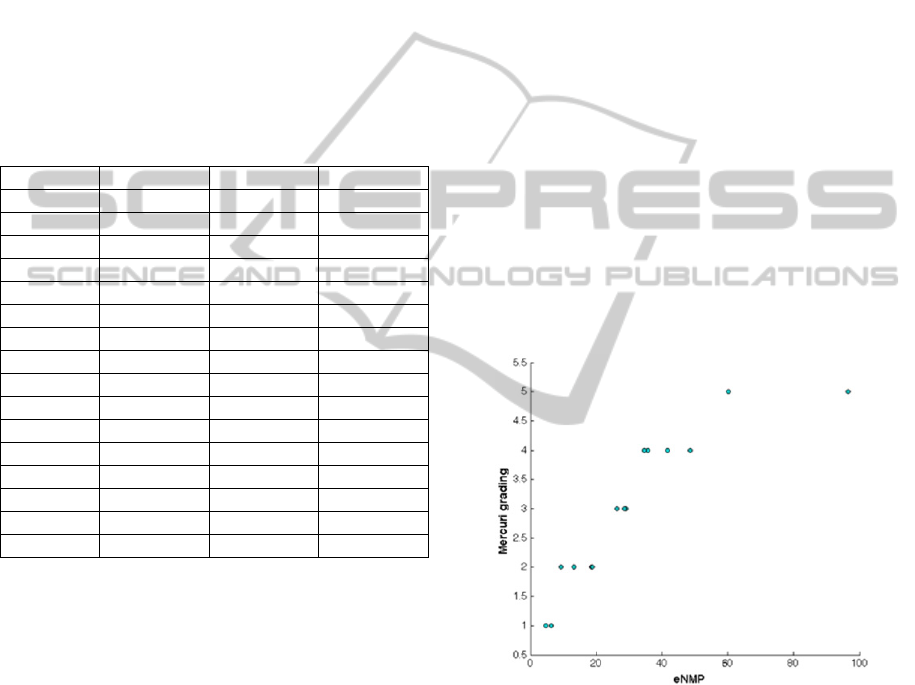
weightier in the first categories with respect to the
higher ones (i.e. in those patients mild symptomatic
respect to those severely affected), the Spearman
rank correlation coefficient has been estimated,
obtaining
= 0.97 (p<10
-5
). This preliminary result
is very interesting from an analytical point of view
and seem in agreement with clinical experience, that
shows some patients with a high degree of fat
infiltration but with a more of less stable clinical
progression. This trend can also be related to the
different pathogenetic mechanisms underneath the
different diseases.
Table 2: The
F
and
F
values obtained through a Gaussian
fit on the image histogram for each NMD subject are
reported. The last column reports the eNMP index
obtained for NMD subjects.
ID
f
f
eNMP
NMD1 590.8 61.9 6.4%
NMD2 678.0 62.3 18.6%
NMD3 680.4 51.6 35.6%
NMD4 591.5 50.3 26.2%
NMD5 544.5 74.0 29.0%
NMD6 674.3 68.3 41.7%
NMD7 585.8 37.3 48.6%
NMD8 629.2 34.4 60.2%
NMD9 719.4 50.9 18.8%
NMD10 658.2 67.5 35.7%
NMD11 698.3 64.0 4.7%
NMD12 751.7 42.6 96.6%
NMD13 735.5 34.9 34.7%
NMD14 581.0 59.4 9.2%
NMD15 650.2 79.3 13.1%
NMD16 599.4 61.0 28.6%
4 CONCLUSIONS
A totally automatic analysis of MR images of the
thigh of healthy subjects has been carried out,
allowing the extraction of a reference standard
useful for a semi-automatic evaluation of muscle
involvement in NMD patients. Besides the strong
correlation obtained between the Mercuri grading
and the eNMP index, lower values of the eNMP
involvement scores were attributable to patients with
neurogenic alterations at muscle biopsy, correlated
to less altered muscle structures, while higher eNMP
values were found for the dystrophic patients, in
correlation with their massive muscle architecture
disruption.
In view of realizing a fully automated
system of quantitative analysis, the few
morphological differences between subcutaneous fat
and fat infiltration in muscle may render ineffective
the standard procedures of segmentation and the
analysis of the two-dimensional MR images may not
be sufficient for the automatic segmentation and
quantitative analysis of the muscles in the
pathological subjects. May therefore be necessary
reformatting the volumes and making a three-
dimensional analysis of three-dimensional images.
Moreover, may have to be used innovative methods
for pattern recognition such as the use of virtual ants
and active contours methods driven by local/global
histogram statistics. Then, such pattern recognition
module devoted to the segmentation and 3D
reconstruction of muscles area may be followed by a
feature extraction tool which will be able to identify
the characteristics which can indicate the presence of
the pathology, both geometrical (i.e. muscular
shapes and volumes) than related to the local signal
intensities (i.e. presence of fibrosis or fat
infiltration). In the last step these features will be
used to train an artificial intelligence based
classifier. Overall, these preliminary results show
that a quantitative analysis of muscle MRI could be
a promising instrument to quantify the patterns of fat
infiltration in neuromuscular patients.
Figure 4: Scatter plot of the Mercuri grading versus the
eNMP index obtained for each NMD patient.
REFERENCES
Baudin, P.Y. et al., 2012. Prior Knowledge, Random
Walks and Human Skeletal Muscle Segmentation.
Lecture Notes in Computer Science 7510:569-576.
Cerello, P. et al., 2010. 3-D object segmentation using ant
colonies. Pattern Recognition 43(4):1476-1490.
Dixon, W.T., 1984. Simple proton spectroscopic imaging.
Radiology 153:189-194.
Gaeta, M. et al., 2011. Muscle Fat Fraction in
Neuromuscular Disorders: Dual-Echo Dual-Flip-
BIOIMAGING2015-InternationalConferenceonBioimaging
104

Angle Spoiled Gradient-Recalled MR Imaging
Technique for Quantification-A Feasibility Study.
Radiology 259(2):487-494.
Gaeta, M. et al., 2012. Muscle fat-fraction and mapping in
Duchenne muscular dystrophy: evaluation of disease
distribution and correlation with clinical assessments.
Skeletal Radiol 41:955–961.
Makrogiannis, S. et al., 2012. Automated quantification of
muscle and fat in the thigh from water-, fat-, and
nonsuppressed MR images. J Magn Reson Imaging
35(5):1152-61.
Mercuri, E. et al., 2002. Clinical and imaging findings in
six cases of congenital muscular dystrophy with rigid
spine syndrome linked to chromosome 1p (RSMD1).
Neuromuscul Disord 12:631-638.
Willis, T.A. et al., 2013. Quantitative Muscle MRI as an
Assessment Tool for Monitoring Disease Progression
in LGMD2I: A Multicentre Longitudinal Study. PLOS
ONE 8/8: e70993.
Wokke B.H. et al., 2013. Comparison of dixon and T1-
weighted MR methods to assess the degree of fat
infiltration in duchenne muscular dystrophy patients. J
Magn Reson Imaging 38(3):619-624.
QuantitativeScoringofMuscleInvolvementinMRIofNeuromuscularDiseases
105
