
Optical Measurement of Temperature in Tissue Culture Surfaces
under Infrared Laser Light Excitation at 800nm using a Fluorescent
Dye
Claire Lefort, David Moreau, Philippe Lévêque and Rodney O’Connor
XLIM Institute, CNRS, Limoges University UMR 7252, 123 avenue Albert Tomas, Limoges, France
Keywords: Optical Temperature Measurement, Infrared Laser Light Excitation, Evolution of Temperature, Fluorescence
of Rhodamine B.
Abstract: The use of infrared laser light (IRLL) for biomedical applications has gained momentum the potential
applications in humans. The use of IRLL presents some limitations due to the dangerousness of these
radiations when exceeding some safety thresholds depending on the target tissue. This position paper
describes step by step a well-known technical method usually applied for microfluidics but here applied for
the first time to measure the temperature and the heat evolution in a cell culture environment under IRLL
excitation at 800 nm. The measurement of temperature is based on the property of Rhodamine B (RhB), a
fluorescent dye whose fluorescence intensity decreases linearly with temperature increases, illustrated by
preliminary microscopic measurements of temperature in cell culture dishes containing RhB solution under
the IRLL excitation from 0 mW to 300 mW.
1 INTRODUCTION
Infrared laser light (IRLL) in the near infrared range
(NIR) has become an indispensable tool for biological
studies with multiple applications, including
multiphoton microscopy (Hoover and Squier, 2013),
photodynamic therapy (Li et al., 2009) and neural
stimulation (Richter and Tan, 2014). A recurring
question often appears in the context of IRLL
excitation of biological targets (Welch 1984): what is
the potential impact of an IRLL excitation on tissue
health with respect to hyperthermic stress, cell or
DNA damage? This issue is particularly important in
the case of a tool dedicated to a clinical use on
humans. The evaluation of the short term or long term
effects of IRLL excitation on tissues is a complex
problem, including a large number of parameters to
consider: excitation parameters (average power,
wavelength, repetition rate, duration of exposition
and power or energy density). The first consequence
of IRLL excitation to be considered is the
modification of local temperature in the exposed
tissue and the range of temperature increase obtained
(Liljemaln et al., 2013).
The effects of different exogenous heating
sources, such as the IRLL excitation, have been
investigated with wide variety of microscopy
techniques for mapping temperature at the single-cell
level (Baffou et al., 2014). Among them, several were
applied to cultured cell lines, as in the Fluorescence-
lifetime microscopy based cellular measurements of
temperature (Shang et al., 2013). Fluorescence
lifetime depends on other parameters like the pH, the
viscosity or the solvent of the target making this
method uncertain for temperature measurement
above a limit of 37°C (Okabe et al., 2012). The
anisotropy of the fluorescence from green fluorescent
protein (GFP) has also been used for intracellular
temperature mapping in cultured cells exposed to
focal and bulk liquid heating (Donner et al., 2012).
This technique is highly promising, but requires the
use of established cell lines stably expressing
fluorescent proteins, making it unsuitable for neurons
or primary tissue cultures that are difficult to
transfect. Fluorescent quantum dot sensors have also
been used for intracellular temperature measurements
induced by external heat sources in a single living cell
(Martinez Maestro et al., 2010) or the Er
3+
-doped
nanoparticle spectrum (Vetrone, et al. 2010). Other
methods include use of the temperature sensitivity of
the fluorescence spectra of the rare earth EuTTA
fluorescence spectrum (Zohar et al. 1998) or the
47
Lefort C., Moreau D., Lévêque P. and O’Connor R..
Optical Measurement of Temperature in Tissue Culture Surfaces under Infrared Laser Light Excitation at 800nm using a Fluorescent Dye.
DOI: 10.5220/0005256300470052
In Proceedings of the 3rd International Conference on Photonics, Optics and Laser Technology (PHOTOPTICS-2015), pages 47-52
ISBN: 978-989-758-092-5
Copyright
c
2015 SCITEPRESS (Science and Technology Publications, Lda.)
doped silica nanoparticles containing these
substances (Yang et al. 2014). Despite the nanometric
size of these particles, their application are hindered
by their repartition in the sample and differential
uptake into organelles and membranes, perturbing
their biochemical properties. The pioneering studies
using NBD (7-nitrobenz-2-oxa-1,3-diazol-4-yl) and
Laurdan showed the potential of small organic
fluorescent probes as optical thermometers in living
cells (Chapman et al., 1995). Indeed, it was shown
that NBD fluorescence lifetime recordings were
suitable for monitoring ultrafast phenomena as the
impact of short pulse microirradiation on single cells.
Unfortunately the temperature resolution provided by
this method was approximately 2°C.
Rhodamine B (RhB), is a fluorescent, water
soluble dye, with an absorption peak at 554 nm, an
emission peak at 576 nm, and a temperature
dependent fluorescence quantum yield (Ferguson et
al., 1973). This quantum yield decreases linearly with
an increase in temperature (Kubin et al., 1982). When
the temperature is reduced, the value of the quantum
yield of spontaneous luminescence sharply increases
and makes certain that any possible negative effects
due to intermolecular relaxation processes are
overridden (Ali et al., 1990). RhB is highly
temperature sensitive, negligibly pressure sensitive,
and nominally pH independent above a pH of 6 (Shah
et al., 2009), and has been used to measure the
temperature in a wide variety of fluidic applications
(Shah et al., 2007; Gui et al., 2008; Ross et al., 2002;
Low et al., 2008; Sakakibura et al., 1999).
Interestingly, RhB has been also used as a
mitochondrial probe for measuring mitochondrial
membrane potential in cells (Reungpatthanaphong et
al., 2003). This work suggested that RhB can
distribute across biological membranes in response to
the transmembrane potential. This property lead us to
think that RhB dye could be useful in making
temperature measurements on small biological
compartments at the subcellular level. The sensitivity
of this technique was shown in the measurement of
temperature in rat tail tendon samples exposed to
radiofrequency electromagnetic fields (Chen et al.,
2009), and used to rule out any mean temperature
increases in cells exposed to nanosecond pulsed
electromagnetic fields (Kohler et al., 2013).
In this position paper, we present preliminary
work describing the method for the temperature
measurement in microscopic environment relevant to
the culture of biological cells under IRLL excitation
at 800 nm using the temperature-sensitive fluorescent
dye RhB. The calibration procedure is detailed and an
application for the measurement of temperature of a
cell culture surface containing RhB under an IRLL
excitation at 800 nm from a Titanium-Sapphire laser
delivered through an optical fibre is shown.
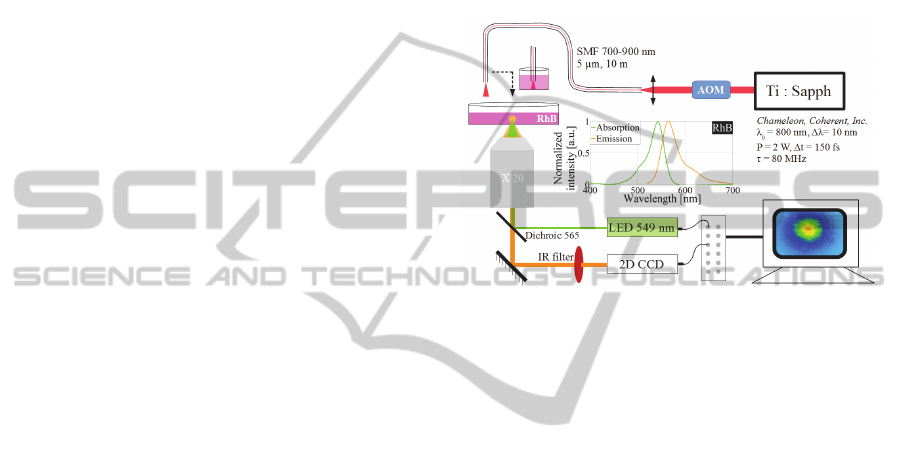
2 EXPERIMENTAL SETUP
The experimental setup is composed of two distinct
parts located in a temperature experimental room at
23.0°C. The global setup is presented in Figure 1.
Figure 1: Setup schematic for temperature measurements of
a RhB solution after heating with IRLL excitation from a
commercial Titan Sapphire laser system.
2.1 Setup for RhB Level of
Fluorescence Measurement
The local heating of the solution of RhB was tested
with a concentration of 50 µmol/L. The whole
experimental setup was placed inside a wide field
fluorescent microscope coupled with a light-emitting
diode (LED)-based light engine (Spectra7,
Lumencorp) and a combination of dichroics and
emission filters (Chroma or Semrock). The light from
the LED at 549 nm with 50 mW of average power
was focused at the surface of a petrie dish containing
RhB solution by a 20x microscope objective. The
backward emitted fluorescence from RhB was
collected in epifluorescent detection, with an electron
multiplied CCD with 512x512 pixels registered at 16
bits precision (Evolve 512, Photometrics). Both the
LED and CCD were controlled and synchronized by
a computer using freely available software (Winfluor,
Strathclyde University). The LED excitation and the
resulting RhB fluorescence emission were thus
measured at a frame rate of 0.198 s.
PHOTOPTICS2015-InternationalConferenceonPhotonics,OpticsandLaserTechnology
48

2.2 Conversion of the RhB
Fluorescence Intensity into
Temperature
The sensitivity of RhB fluorescence in measuring
temperature was previously shown to be 0.2°C
(Kohler et al., 2013) using two calibration steps. The
first calibration was made using a fibre optic
thermometer (Luxtron) with analogue voltage output
that was sampled with an analogue to digital board
(USB-6229-BNC, National Instruments) interfaced
with Winfluor, measuring the temperature of a dish of
water progressively heated with a metallic ring
containing heating resistance (Warner Instruments).
This step evaluated the linear relation between the
temperature of the target, measured with the
thermometer, and the voltage output of the fibre
thermometer, as read by Winfluor. Figure 2a presents
the evolution of the water temperature in the dish and
the voltage recorded by software. This defined the
calibration curve of the thermometer. Next, the petri
dish was filled with 2.5 ml of RhB solution and its
temperature was manipulated by the heating
resistance chamber. For each steps of 0.198 s when
the RhB solution temperature increased, the
fluorescence level was recorded. Figure 2b shows the
evolution of the temperature as measured with the
level of fluorescence detected by the CCD pixels with
a grayscale encoded on 16 bits.
Figure 2: a. Calibration of temperature measured by the
fibered thermometer as a function of its voltage measured
by Winfluor. b. Calibration of the temperature as a function
of the level of RhB fluorescence encoded in a grayscale on
16 bits measured by the CCD interfaced with Winfluor.
As expected, the level of RhB fluorescence decreased
linearly with the increase of the temperature of the
RhB solution. All the further results of measurements
will be expressed using this conversion of
fluorescence to temperature.
2.3 Infrared Laser Light Excitation
The focal excitation of temperature in the RhB
solution was realized by a femtosecond infrared
Titan-Sapphire (Ti: Sapph) laser. As this system is
very bulky, the IRLL was injected into a 10-m-long
fibre deporting the laser source wherever required in
the experimental room. The single mode fibre (SMF)
from Fibercore (reference SM750) was chosen for
delivering the IRLL with a mode field diameter of 5
µm and a numerical aperture (NA) equal to 0.12.
Figure 1 shows the whole experimental setup.
The IRLL came from a Ti: Sapp laser
(Chameleon, Coherent, INC.) delivering 140 fs pulses
at 800 nm, 10 nm of spectral bandwidth at the full
width half maximum (FWHM) at the repetition rate
of 80 MHz. Before the SMF input, an acousto-optical
modulator was inserted (Figure 1), allowing the rapid
modulation of average power before the IRLL
injection into the SMF. At the SMF output, the
maximum of average power stabilized at around 300
mW. After the propagation through a 10-m-long
fibre, the spectrum was broadened from 10 nm
FWHM to 100 nm FWHM resulting from nonlinear
effects and the pulse duration was increased from 140
fs to 10 ps due to dispersion effects. In the first
instance, in the context of the measurement of
temperature evolution of a solution of RhB, the
femtosecond properties of the pulses were not a
critical point in this experiment, although it might be
relevant and pursued in future experiments on
biological sample in the condition of imaging with a
two photon microscope.
3 RESULTS AND DISCUSSION
The optical fibre was placed 1 mm above the bottom
of the petri dish containing the RhB solution. Three
series of experiments were performed to illustrate the
use of RhB as a fluorescent dye allowing the
temperature measurement of a solution in response to
IRLL heating. The first experiment was carried out
with a continuous IRLL excitation. Next, the effect of
a periodic, intermittent IRLL excitation on RhB
fluorescence was investigated. Finally, the evaluation
of the temperature distribution of the RhB solution in
2D was studied in the cone of IRLL from the optical
fibre.
3.1 First Experimental Determination
of the Temperature Increase of a
Solution of RhB under a
Permanent IRLL Excitation
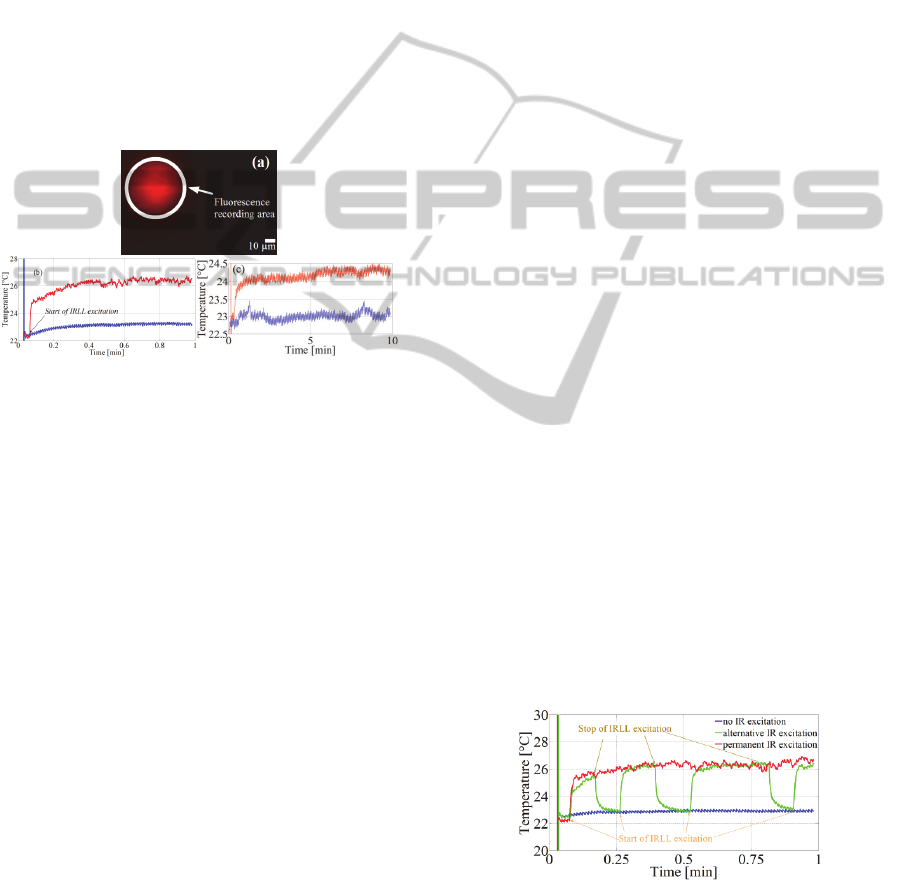
For the first set of experiments, the RhB fluorescence
was recorded on an area containing the entire region
illuminated by the IRLL. Figure 3a represents the
position of the optical fibre realized when delivering
few microwatts of IRLL at 800 nm, insufficient to
changing the RhB solution fluorescence. The
OpticalMeasurementofTemperatureinTissueCultureSurfacesunderInfraredLaserLightExcitationat800nmusinga
FluorescentDye
49
recorded image is shown in pseudo-colour without
the IR filter (Figure 1) in front of the CCD. This step
was dedicated to the fibre positioning in the field of
view of the CCD camera and the physical
delimitation of the ROI and selection of fluorescence
measurements by Winfluor. No LED excitation was
used to achieve this picture.
The objective of this part was to determine the
averaging of temperature in this ROI, resulting from
the continuous IRLL excitation at 800 nm over a total
duration of one min. This first experiment was done
with an average power of IRLL excitation of 200 mW
at the fibre output. Figure 3b shows the resulting
temperature measurement, determined after the
conversion of fluorescence to temperature, as
previously described.
Figure 3: a. Localisation of the optical fibre and ROI
delimitation of the measured level of fluorescence under
200 mW of IRLL excitation. b. Resulting temperature
measured in the ROI, blue: temperature measured without
excitation, red: temperature measured under the IRLL
excitation. c. Temperature measured in the ROI with 100
mW of IRLL excitation using exposure time of 10 min.
First, to compare the local heating resulting from the
IRLL excitation with a reference, we have measured
the temperature in the ROI without IRLL (Figure 3b,
3c blue curves). Then, the temperature of the ROI
under IRLL excitation was measured and is shown on
the same graph representing the temperature
measurement without IRLL. The fluorescence
measurements, switching on the LED at 549 nm, were
started after 2 s of recording, so as not to miss a
starting event. Then, the IRLL excitation thought the
optical fibre was started 3 s after the start of
fluorescence acquisition.
When the IRLL was started, the modification of
temperature was immediately visible and
characterized by the strong increase in the red curve
compared to the blue one (Figure 3b, 3c). In Figure
3b, the rapid deviation in the curve represents a
temperature increase of 1.7°C with a rise time less
than the 0.192 s between each point of the measure.
In the next seconds and until the half of the measure,
the local temperature increases until asymptoting to
26.3°C. The temperature was then stabilized at
26.5°C until the end of the recording. The decline of
the increase in temperature reveals the presence of a
steady state reached, illustrated also with the Figure
3c with an illumination duration of excitation of 10
and 20 min, respectively. The limitation in
temperature increase presumably results from the
large volume of RhB solution of 2.5 mL in the petri
dish, compared to the small volume under IRLL
excitation. By a simple calculation considering the
optical fibre NA, the index of the medium equal to
1.33 and the distance of 1 mm between the fibre tip
and the bottom of the dish, only 8.6.10
-6
mL of the
RhB solution was heated by IRLL excitation which
represents less than 0.01% of the total volume.
Therefore, an averaging of the temperature of the
ROI, by temperature exchanges with the whole
solution of RhB, are limiting focal elevation in
temperature. Further, the constancy in the
temperature especially in the case of the 10 min of
IRLL excitation, suggests that there is not a
significant photobleaching effect in the limit of the
duration of the measurement.
3.2 RhB Fluorescence Characterization
under an Alternative IRLL
Excitation
The objective was to investigate the possible effects
of an intermittent IRLL excitation compared to a
permanent illumination. The experimental protocol
implements three phases of 1 min of fluorescence
recording in the same ROI as the one defined in
Figure 3a. During the first phase of 1 min, the RhB
fluorescence without IRLL was recorded in order to
have a reference value. Next, the RhB fluorescence
was measured under IRLL excitation with an average
power of 150 mW. Finally, the influence of
alternating between IRLL excitation at 150 mW and
switching off was studied.
Figure 4: Intermittent IRLL excitation in the RhB
fluorescence. Blue line: without IRLL. Red line: constant
IRLL excitation. Green line: intermittent IRLL excitation.
The points of start and stop of the IRLL excitation are
explicitly identified. Globally, during the intermittent
PHOTOPTICS2015-InternationalConferenceonPhotonics,OpticsandLaserTechnology
50
IRLL excitation on and off (Figure 4 green curve), the
RhB solution was excited with IRLL for a total of 38
s. Different durations of IRLL excitation were applied
from 5 s until 18 s. The delay between two IRLL
excitations was constant and set at 6 s. The green
curve is alternatively very well merged with the red
line and with the blue line, respectively,
corresponding to the IRLL excitation or the absence
of IRLL (Figure 4). When the IRLL starts, in the
second and third start of excitation, the time necessary
for the green curve to be superimposed with the red
one was 1.5 s. In the case where the IRLL stopped,
the time delay for the RhB fluorescence was higher
than for the start. For the first stop, it was 3 s; for the
second, it was 3.6 s, as it was for the third one. These
long times of stabilization of more than 1 s, regardless
of high or low state status, may result from the
relatively small volume of the IRLL excitation highly
sensitive to temperature exchanges between the
excited volume and the whole volume of RhB
solution with a constant temperature equal to the
room temperature at 23°C.
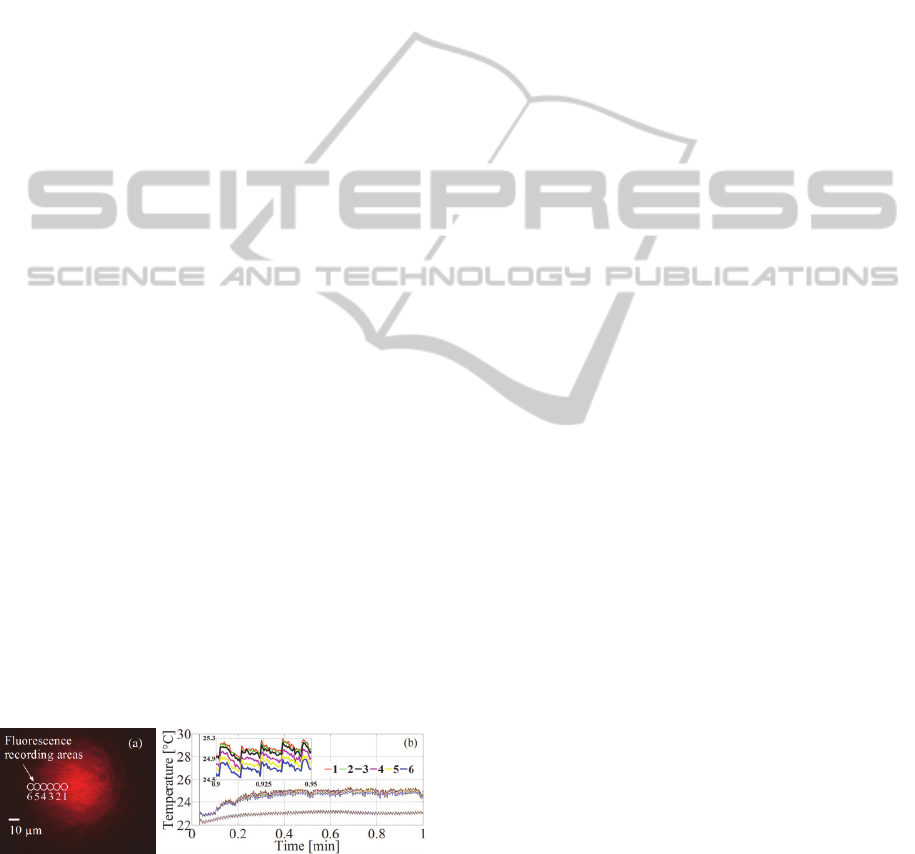
3.3 Temperature Mapping
The optical fibre delivers the IRLL vertically as a
cone of light, without focusing or collimation of the
beam. The apex angle of the cone depends
exclusively on the numerical aperture of the fibre core
and the index of the medium approximated at water
at 1.33. The excitation is therefore spatially non
uniform leading to a not homogenous temperature of
the RhB solution in the whole petri dish. Thus, as the
level of RhB fluorescence is measured on a 2D plane,
a decrease in temperature distribution was observed
when moving away from the centre of the IRLL
illumination cone. Figure 5a details the position of the
6 ROIs. All of the 6 ROIs was touched together in a
line. Figure 5b reveals the resulting measurement of
temperature mapping in the 6 ROIs with and without
excitation.
Figure 5: a. Positions of the 6 ROIs in the cone of light from
the optical fibre; 6 areas in a line with a common limit. b.
Temperature mapping inside the cone of IRLL with and
without excitation. Inset: temperature evolution in the 6
ROIs between 0.90 and 0.95 min.
For all the measurement with or without IRLL,
each of the 6 ROIs fluorescence levels were recorded
in the same time. The first record without IRLL has
defined the reference temperature at 23°C. Then, the
IRLL was used to heat the target cone of RhB solution
with an average power of 70 mW. The temperature of
the 6 ROIs followed the same evolution law during
the rise time. During the following time, and until the
end, the temperature was stabilized, similar to that of
the first experiment (Figure 3c and 3d).
4 CONCLUSIONS
We have presented a method for measuring the local
temperature of a biological sample thanks to an
optical method using the temperature sensitive dye
Rhodamine B. The experimental setup was built
around a fluorescence microscope, with a light-
emitting diode illumination system for measuring the
level of fluorescence of RhB. We have first shown the
immediate influence of the infrared laser light
excitation at 800 nm at 200 mW caused a focal
increase of temperature of 1.7°C and the process of
temperature stabilisation for a recording duration
between 1 min and 10 min. Then, we have shown that
the fluorescence of the RhB can be also used in the
case of an intermittent IRLL excitation, with a good
reproducibility. Finally, the distribution of
temperature inside the cone of infrared laser light was
measured.
The important interest of this setup lies in its
simplicity of implementation, first requiring RhB, a
very standard and sensitive fluorescent dye with a
high sensitivity to temperature changes and resolution
of 0.2°C. Then, the insertion of the global setup for
temperature measurement around a fluorescent
microscope requires few simple modifications of the
microscope itself. Finally, as biological observations
are often made using fluorescent microscopy, the
additional tool of temperature analysis allows the
correlation of biological processes with the
modification of temperature.
For our future experiments, we will test this
method on the temperature modification of cells
under the effect of IRLL. The influence of
illumination and temperature on cell properties like
plasma membrane permeability under IRLL
illumination will be used to define a threshold of
optical parameters of the excitation not to be
exceeded to maintain cell viability in experiments.
OpticalMeasurementofTemperatureinTissueCultureSurfacesunderInfraredLaserLightExcitationat800nmusinga
FluorescentDye
51

ACKNOWLEDGEMENTS
This work has been highly supported by the LABEX
program of XLIM Institute in the axis “Biophysics
and health”, the Limousin Region and Limoges
University for the transversal thematic “Bio-Electro-
Photonic”. We also thank Fibrecore Inc. for providing
30 meters of the single mode fibre for free.
REFERENCES
Ali, M. A., Moghaddasi, J., Ahmed, S. A., 1990.
Temperature effects in rhodamine b dyes and
improvement in cw dye laser performance, Laser
Chem., 11, pp. 31-38.
Baffou, G., Rigneault, H., Marguet, D., Jullien, L., 2014. A
critique of methods for temperature imaging in single
cells, Nature Methods, 11, 9, pp. 899-901.
Chapman, C. F., Liu, Y., Sonek, G. J., Tromberg, B. J.,
1995. The use of exogenous fluorescent probes for
temperature measurements in single living cell,
Photochemistry and photobiology, 62, 3, pp 416-425.
Chen, Y.Y., Wood, A.W., 2009. Application of a
temperature-dependent fluorescent dye (Rhodamine B)
to the measurement of radiofrequency radiation-
induced temperature changes in biological samples,
Bioelectromagnetics, 30, 7, pp. 583–590.
Donner, J.S., Thompson, S.A., Kreuzer, M.P., Baffou, G.,
Quidant, R., 2012. Mapping Intracellular Temperature
Using Green Fluorescent Protein, Nano Letters, 12, 4,
pp. 2107-2111.
Ferguson, J. and Mau, AWH, 1973. Spontaneous and
stimulated emission from dyes. Spectroscopy of the
neutral molecules of acridine orange, proflavine, and
rhodamine B, Australian Journal of Chemistry 26, 8,
pp. 1617 – 1624.
Gui, L., Ren, C.L., 2008. Temperature measurement in
microfluidic chips using photobleaching of a
fluorescent thin film, Applied Physics Letters, 92, 2.
Hoover, E.E., Squier, J.A., 2013. Advances in multiphoton
microscopy technology, Nature Photonics Review, 7,
pp. 93-101.
Kohler, S., O’Connor, R.P., Thi Dan Thao Vu, Leveque, P.,
Arnaud-Cormos, D., 2013. Experimental
microdosimetry techniques for biological cells exposed
to nanosecond pulsed electric fields using
microfluorimetry, IEEE Transactions on Microwave
Theory and Techniques, 61, 5.
Kubin, R. F., and Fletcher, A. N., December 1982–February
1983. Fluorescence quantum yields of some rhodamine
dyes, Journal of Luminescence, 27, 4, pp. 455–462.
Li, B.-H., Xie, S.-S., Huang, Z., Wilson, B.C., 2009.
Advances in photodynamic therapy dosimetry. Progress
in Biochemistry and Biophysics, 36, 6, pp. 676-683.
Liljemaln, R., Nyberg, T., von Holst, H., 2013. Heating
during neural stimulation, Lasers in Surgery and
Medicine, 45, pp. 469-481.
Löw, P., Kim, B., Takama
,
N., Bergaud,C., 2008. High-
Spatial-Resolution Surface-Temperature Mapping
Using Fluorescent Thermometry, Small, 4, 7, pp. 908-
914.
Martinez Maestro, L., Rodriguez, E.M., Sanz Rodriguez,
F., Iglzsias-de la Cruz, M.C., Juarranz, A., Naccache,
R., Vetrone, F., Jaque, D., Capobianco, J.A., Garcia
Sole, J., 2010. CdSe Quantum Dots for Two-Photon
Fluorescence Thermal Imaging, Nano Letters, 10, 12,
pp. 5109-5115.
Okabe, K., Inada, I., Gota, C., Harada, Y., Funatsu, T.,
Uchiyama, S., 2012. Intracellular temperature
mapping with a fluorescent polymeric thermometer and
fluorescence lifetime imaging microscopy, Nature
Communication, 3, 705, pp. 1-9.
Reungpatthanaphong, P., Dechsupa, S., Meesungnoen, J.,
Loetchutinat, C., Mankhetkorn,S., 2003. Rhodamine B
as a mitochondrial probe for measurement and
monitoring of mitochondrial membrane potential in
drug-sensitive and -resistant cells, Journal of
Biochemical and Biophysical Methods, 57, 1, pp. 1-16.
Richter, C.-P., and Tan, 2014. Photons and neurons,
Heating research, 311, pp. 72-88.
Ross, D., Gaitan, M. and Locascio, L.E., 2001.
Temperature measurement inmicrofluidic systems
using a temperature-dependent fluorescent dye,
Analytical Chemistry, 73, pp. 4117–4123.
Sakakibara, J., and Adrian, R.J., 1999. Whole field
measurement of temperature in water using two-color
laser induced fluorescence, Exper.Fluids, 26, pp. 7–15.
Shah, J. J., Gaitan, M., Geist, J., 2009. Generalized
temperature measurement equations for rhodamine b
dye solution and its application to microfluidics,
Analytical Chemistry, 81, 19, pp 8260–8263.
Shah, J. J., Sundaresan, S. G., Geist, J., Reyes, D. R., Booth,
J. C. Mulpuri, Rao, V., Gaitan,M., 2007. Microwave
dielectric heating of fluids in an integrated microfluidic
device, Journal of Micromechanics and
Microengineering, 17, 11.
Shang, L., Stockmar, F., Azadfar, N., Nienhaus, G.U.,
2013. Intracellular Thermometry by Using Fluorescent
Gold Nanoclusters, Angewandte Chemie International
Edition, 52, 42, pp. 11154–11157.
Vetrone, F., Naccache, R., Zamarron, A., Juarranz de la
Fuente, A., Sanz-Rodriguez, F., Marinez, L.,
Rodriguez, E.M., Jaques, D., Garcia Sole, J.,
Capobianco, J.A., 2010. Temperature sensing using
fluorescence nanothermometers, ACS Nano, 4, 6, pp.
3254-3258.
Welch, A.J., 1984. The thermal response of laser irradiated
tissues, IEEE Journal of Quantum Electronics, 20, 12
pp. 1471-1481.
Yang, L., Peng, H.-S., Ding, H., You, F.-T., Hou, L.-L.,
Teng, F., 2013. Luminescent Ru(bpy)3 2+-doped silica
nanoparticles for imaging of intracellular temperature,
Microchimica Acta, 181, 7-8, pp. 743-749.
Zohar, O., Ikeda, M., Shinagawa, H., Inoue, H., Nakamura,
H., Elbaum, D., Alkon, D.L., Yoshioka, T., 1998.
Thermal imaging of receptor-activated heat production
in single cells, Biophysical Journal, 74, 1, pp. 82-89.
PHOTOPTICS2015-InternationalConferenceonPhotonics,OpticsandLaserTechnology
52
