
Automatic ROI for Remote Photoplethysmography using PPG and Color
Features
Elisa Calvo-Gallego
1
and Gerard de Haan
2
1
Instituto de Microelectr
´
onica de Sevilla (IMSE-CNM), CSIC-University of Seville, Seville, Spain
2
Eindhoven University of Technology, Eindhoven, The Netherlands
Keywords:
Biomedical Monitoring, Photoplethysmography (PPG), Image Analysis, Skin Detection, Fuzzy Logic.
Abstract:
Remote photoplethysmography (rPPG) enables contact-less monitoring of the blood volume pulse using a
regular camera, thus providing valuable information about the cardiovascular system. However, the quality
of the acquired rPPG signal is strongly affected by the region of skin where the analysis is carried out and,
therefore, to be confident of obtaining valid information, a pre-selection of the region-of-interest (ROI) for
the PPG analysis is necessary. In this paper, we propose a method for the automatic extraction of this ROI
combining the local characteristics of the PPG-signal with the color information using fuzzy logic. Results of
the quality of the ROI extraction and its application on pulse rate detection are provided.
1 INTRODUCTION
Photoplethysmography (PPG) is an optical technique
that allows monitoring of vital signals, such as pulse
or respiratory rate, from the optical absorption varia-
tions of the human skin caused by the blood volume
variations during the cardiac cycle.
The first reference to this technique dates from
1930s (Hertzman, 1937), when the first characteri-
zations of the PPG signals, the capture of the first
recordings from human fingers and the first measures
of blood volume changes from PPG signals in diffe-
rent situations, like exercise and exposure to cold of
the subject, were carried out and published. At the
time, the origin of the different components of the
PPG signal were only partially understood. Howe-
ver, it was generally accepted that they could provide
valuable information about the cardiovascular system
and, consequently, research on this topic continued.
It was not until 1980s when many of these advances
gave rise to the creation of a commercial device, a
pulse-oximeter, which greatly increased the relevance
of these studies in clinical care (Allen, 2007).
Due to its low-cost and its non invasiveness,
efforts to develop PPG have been multiplied recently,
following mainly two lines of research. On one hand,
the desire of preventing contact in extreme sensiti-
vity cases (e.g. neonates, patients with burns) or si-
tuations requiring strict unobtrusiveness (e.g. surveil-
lance, fitness) and the ambition of removing the sen-
sitivity to the varying force or pressure of the probe
on the skin, has promoted the evolution towards re-
mote PPG (rPPG) (Huelsbusch et al., 2002),(Takano
et al., 2007). On the other hand, studies in ambient
light conditions using regular video cameras have
been done to replace dedicated light sources (typically
red/infra-red wavelength), initially used as a result of
a shallower penetration depth in skin (Verkruysse et
al., 2008).
The quality of the acquired rPPG signal is strongly
affected by the subject motion, the region and type of
skin (defined mainly by its thickness and its color, in
turn determined by the concentration of melanin in
the epidermis and the concentration of hemoglobin in
the dermal blood vessels) and the illumination.
Many studies have been aimed at increasing the
robustness against motion and changing illumination
conditions. This is where the use of an RGB-video
camera is advantageous, as it simultaneously pro-
vides multiple color channels with different PPG and
noise mixtures. To retrieve the desired clean sig-
nal from the observed set without prior information
about the mixing process, Blind Source Separation
(BSS) techniques have been used for decades in this
kind of physiological measurement applications e.g.
in multi-channel electroencephalogram and electro-
cardiogram (Glass, 2004). Indeed, motion robust
methods to find the pulse-signal, i.e. the pulsatile
component of the PPG, from video using BSS have
been described in (Huelsbusch et al., 2002), (Poh et
357
Calvo-Gallego E. and de Haan G..
Automatic ROI for Remote Photoplethysmography using PPG and Color Features.
DOI: 10.5220/0005259003570364
In Proceedings of the 10th International Conference on Computer Vision Theory and Applications (VISAPP-2015), pages 357-364
ISBN: 978-989-758-089-5
Copyright
c
2015 SCITEPRESS (Science and Technology Publications, Lda.)

al., 2010), or (Lewandowska et al., 2011). A diffe-
rent, chrominance-based, approach was used by (de
Haan et al., 2013) who assumed non-local intensity-
variation and specular reflection to cause the main
distortions. Furthermore, they assumed a constant
standardized skin-color, which enabled them to con-
struct a linear combination of the normalized mean
skin-color signals orthogonal to the assumed distor-
tions regardless the color of the illumination. This eli-
minated the periodicity-based component-selection of
BSS-based methods, which performed poorly on fit-
ness videos with their strong periodic subject motion.
To segment the relevant skin regions for remote-
PPG, however, not much progress has been docu-
mented. The majority of the publications need a seg-
mentation of the ROI, either manually or, using a face
detector which involves an increase of computational
complexity, a limitation of the part of skin that can be
detected, or the necessity of an initialization or perio-
dic reset process (Lempe et al., 2013).
At this point, this paper aims to contribute by
proposing an automatic ROI-detection in a video
sequence for remote PPG analysis. This goal is
achieved with a system (Fig. 1) that uses the output
of the pursued application (the PPG analysis), combi-
ning it with other input (the color, specifically the hue
component), to detect the pixels belonging to human
skin (that is, the ROI). The idea is that, in a later pro-
cessing stage, from this skin template, the performed
PGG analysis or the conclusions obtained from it can
be filtered, modified or/and improved and, to demon-
strate it, a simple system for automatically obtaining
the pulse rate of a person in a video sequence is pre-
sented. Since the inputs of the proposed system are
already required by the application, the added compu-
tational complexity is low (barely some comparators
and multipliers).
The reason to combine the different kinds of in-
formation is mainly to reinforce the classification pro-
cess made by systems based on a single feature, owing
to the fact that, as a result of the already mentioned
problems to acquire a good PPG signal under cer-
tain scenarios and to similar circumstances with the
color, decisions taken in those process could be wrong
or undetermined. Due to that imprecise nature of
data, fuzzy logic inference systems have been con-
sidered for the mixture. They are universal interpola-
tors which allow to perform any non-linear mapping
Figure 1: Block diagram of the proposed system.
between the input and output space.
The paper is organized as follows. In Sections II
and III, the methods for the calculation of the inputs of
the fuzzy system as well as the reasons for its choice
are briefly explained. Section II is focused on rPPG
signals and information obtained from them whereas
Section III is centered on the acquisition of chromatic
information of the image. Section IV describes the
proposed fuzzy system for skin detection. This sys-
tem is composed by two rule-bases whose functio-
nality is to calculate the probability of belonging to
a skin fuzzy set (first rule base) and to adjust dyna-
mically the threshold for a final binarization process
(skin/non-skin) (second rule base). Assessment de-
tails and simulations results are summarized in Sec-
tion V and VI. The obtained conclusions are exposed
in Section VII.
2 PPG PROCESSING
The first feature for skin-detection extracted from the
video sequence is based on an analysis of PPG signals
in the frequency domain.
PPG signals are obtained using the chrominance-
based method of (de Haan et al., 2013) since this con-
cept has demonstrated a relevant improvement on mo-
tion robustness against earlier proposed blind source
separation techniques. Our system, illustrated in Fig.
2, adds a true-motion estimation block to achieve
pixel alignment ((de Haan et al., 1994),(de Haan,
2010)). Later, a 2048 point Fast Fourier Transform
(FFT) is applied on the Hanning windowed PPG sig-
nals and a peak detection and a signal-to-noise rate
calculation are carried out in the signals.
The position of the maximum peak of the sig-
nal provides the pulse rate (P), that is, the rate of
heart contractions, measured in beats/min. Since, for
adults, this value lies between 30 beats/min (in case
of a well trained athlete, in rest) and 240 beats/min
(in case of an person at maximum level exercise), the
peak detection is limited to that frequency interval.
The signal-to-noise rate (SNR) provides the rela-
tion between the energy around the fundamental fre-
quency plus the first harmonic of the pulse signal and
the remaining energy contained in the spectrum. It is
computed using Eq. (1), where harmonics of the spec-
trum of the PPG signal (denoted as
b
S( f )) are isolated
using unitary templates around them (U
t
( f )).
SNR = 10 ∗ log
10
(
∑
240
30
(U
t
( f )
b
S( f ))
2
∑
240
30
((1 −U
t
( f ))
b
S( f ))
2
) (1)
In Fig. 3.b, an example of a PPG signal in the fre-
quency domain calculated in one pixel of the example
VISAPP2015-InternationalConferenceonComputerVisionTheoryandApplications
358
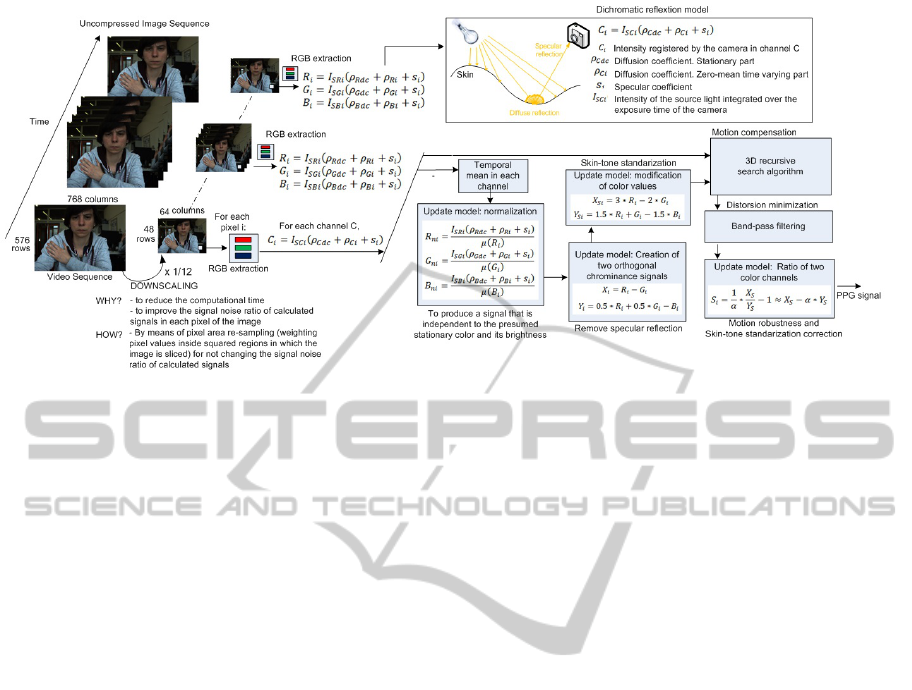
Figure 2: Flowchart of considered PPG signal extraction.
frame is shown. The values of detected P and SNR
in the whole image are shown in 3.d and 3.e, where
brighter pixels indicate higher values of these magni-
tudes. It can be recognized that skin pixels have a re-
latively high SNR (up to 10 dB) and a valid pulse rate
value (in this case, 82 beats/min). In pixels where
SNR and pulse rate values are not the expected, for
example in the neck, it is considered that the PPG sig-
nal has not been acquired with sufficient quality.
The appreciable homogeneity of these magnitudes
in the skin regions leads to the definition of other two
measures as inputs of the system:
• Uniformity of the pulse rate (HP): A 3 x 3 win-
dow is considered around each pixel of P to calcu-
late the number of pairs in that window in which
differences between pulse rate values exceed a
threshold (Eq. 2 and 3, being Thp=5). This allows
us to measure the uniformity of P, checking how
many pixels are substantially equal in the neigh-
borhood. The values of this matrix are between 0
and 81. As shown in Fig. 3.d, pulse rate values are
equal or homogeneous in skin regions. For that
reason, HP matrix (Fig. 3.g) has higher values in
skin areas than in non skin areas.
HP
i j
=
j+1
∑
v= j−1
i+1
∑
u=i−1
j+1
∑
s= j−1
i+1
∑
r=i−1
(d(u, r, v, s)) (2)
d(u, r, v, s) = 1 i f abs(P(u, v) − P(r, s)) ≥ T h
p
(3)
d(u, r, v, s) = 0 i f otherwise
The computational cost of this equation can be
reduced removing (v,u) = (s,r) pairs and (r,u,s,v)
combinations.
• Uniformity of SNR (TSNR, values in natural
units): The texture of the SNR values in a 9 x 9
neighborhood centered in each pixel is calculated
by means of an entropy filter. It has been com-
puted using the ‘entropyfilt’ instruction of Matlab
whose theoretical base is Eq. (4), where p(u,v)
is the probability of (u,v) value in the conside-
red sub-histogram. TSNR values normally fall
between 0 and 10, being lower when the tex-
ture of that SNR sub-matrix is less random, this
means softer in changes. For that reason, values
are higher in points where PPG signal is detected,
i.e. in skin areas. An example of TSNR matrix is
shown in Fig. 3.h.
T SNR
i j
=
j+4
∑
v= j−4
(
i+4
∑
u=i−4
(p(u, v) ∗ log
2
(p(u, v)))) (4)
3 COLOR PROCESSING
The majority of methods proposed in the literature
for skin detection are based on color, texture, or ap-
pearance features. In general, the major drawbacks
of many textures and object detection methods like
face-detectors are that they can not deal with different
skin-regions, partial occlusion or changes in the ob-
ject position or scale, moreover their computational
complexity is high. Consequently, our search for fea-
tures to complement the PPG-signal has focused on
color methods that, in many situations, allow to over-
come these kind of problems ((Kelly et al., 2008)-
(Kakumanu et al., 2007)). One of the simplest pos-
sible options, a thresholding of the hue component of
the image (Fig. 3.f), was initially selected as as mea-
sure of interest for the considered system. Later, to
work with a more reliable measure, also an index of
hue homogeneity was calculated as follows (Fig. 3.i):
AutomaticROIforRemotePhotoplethysmographyusingPPGandColorFeatures
359

Figure 3: (a) Example frame, (b) PPG signal in frequency
domain for a pixel belonging to forehead, (c) Binary tem-
plate window for calculating SNR in case (b), (d) P, (e)
SNR, (f) Hue component, (g) HP, (h) TSNR, (i) HI.
• Hue index (HI): In the whole image, the hue (H)
and the uniformity of the hue (HH) in each pixel
are evaluated. HH is calculated in the same way
that it was previously done with pulse rate (Eq.
2). If both measures are in a specific range (Eq.
5, where T h
hl
= 0.1, T h
hs
= 0.95 and T h
hh
= 60)
it is considered that this pixel belongs to skin and
the HI
nds
acquires ’1’ value in that pixel. Oth-
erwise, a zero value is assigned to it. After that,
a downscaling process is done over HI (Eq. 6,
where n=12) as it was done with the original
image in Fig. 2. The values of this final matrix are
between 0 and 1, being values closer to ’1’ when
the probability of skin in that pixel is higher.
HI
nds i j
= [(H
i j
< T h
hl
)||(H
i j
> T h
hs
)] ◦ (5)
[HH
i j
> T h
hh
]
HI
ds i j
=
1
n
2
j∗n
∑
v=( j−1)∗n−1
(
i∗n
∑
u=(i−1)∗n−1
HI
nds
(u, v)) (6)
4 FUZZY SYSTEM
The contribution presented in this paper is a hierar-
chical system composed by two rule-bases.
The first rule base combines, in each pixel, HP,
HI, TSNR and SNR to provide a value in the interval
[0,1] that indicates the probability of belonging of a
pixel to the skin or, in other words, the membership
grade to a skin fuzzy subset. While closer to ’1’, the
belonging to skin will be higher. The set of IF-THEN
rules that defines this subsystem is shown in Table 1.
It has been deducted from the following principles,
obtained analyzing the inputs of the system.
Table 1: Fuzzy skin detection rule base.
ID IF ANTECEDENTS THEN CONSEQ
1 HI = LARGE AND HP = LARGE SKIN
2 HI = LARGE AND TSNR = LARGE SKIN
3 HI = SMALL AND HP = LARGE AND TSNR = LARGE AND SNR = LARGE SKIN
3 OTHERWISE NON-SKIN
• Normally, color information is more reliable than
PPG information. However, it is insufficient for
reliable classification.
• False positive cases in a classification process
based only on HI matrix are mainly due to noisy
dark areas and some red areas such as clothes or
the mouth of the person. They can be reduced
corroborating HI decision with some other inputs:
HP or TSNR. If HI is large and, either HP or
TSNR are large, the output should be skin. SNR
is not used in these situations since it is very de-
pendent on the the quality of the acquired signal.
• False negative cases in a classification process
based only on HI matrix results occur, e.g. when
there are highlights in the face of the person. They
can be reduced if, in case HI was small, HP, TSNR
and SNR are all large.
As this heuristic knowledge does not provide
enough information to determine the values that de-
fine the fuzzy sets of the antecedents, a tuning process
has been employed to adjust them, using the well-
Known supervised learning Marquardt-Levenberg al-
gorithm within of the fuzzy system development en-
vironment Xfuzzy 3.3 (Xfuzzy WebPage). Typical
values in the literature have been selected as ini-
tial value for the Hessian addition (0.2) and the in-
crease/decrease adaptation factors (2 and 0.2, respec-
tively). The training has been performed with some
prepared files, composed by sets of inputs/output
patterns generated for one or several video test se-
quences. The final considered fuzzy sets for each in-
put variable are shown in Fig. 4. The fuzzy mean has
been chosen as defuziffication method, generating the
output of the system as the mean of the consequent
values (defined by two singleton fuzzy sets in zero
and one), weighted by its activation grade.
The second rule base allows to calculate dynami-
cally the threshold used in the final binary classifica-
tion into skin and non-skin sets. The inputs to this
rule-base are three indexes that measure the quality of
the types of information by means of the variance of
its values in each frame, being it calculated according
Eq. 7 and 8 (nc is the number of columns of the frame
and nf is the number of rows of the frame). These in-
puts are represented using fuzzy sets whose member-
ship grade are shown in Fig. 5.
V =
1
nc ∗ n f
n f
∑
v=1
(
nc
∑
u=1
(x
uv
− µ)
2
) (7)
VISAPP2015-InternationalConferenceonComputerVisionTheoryandApplications
360
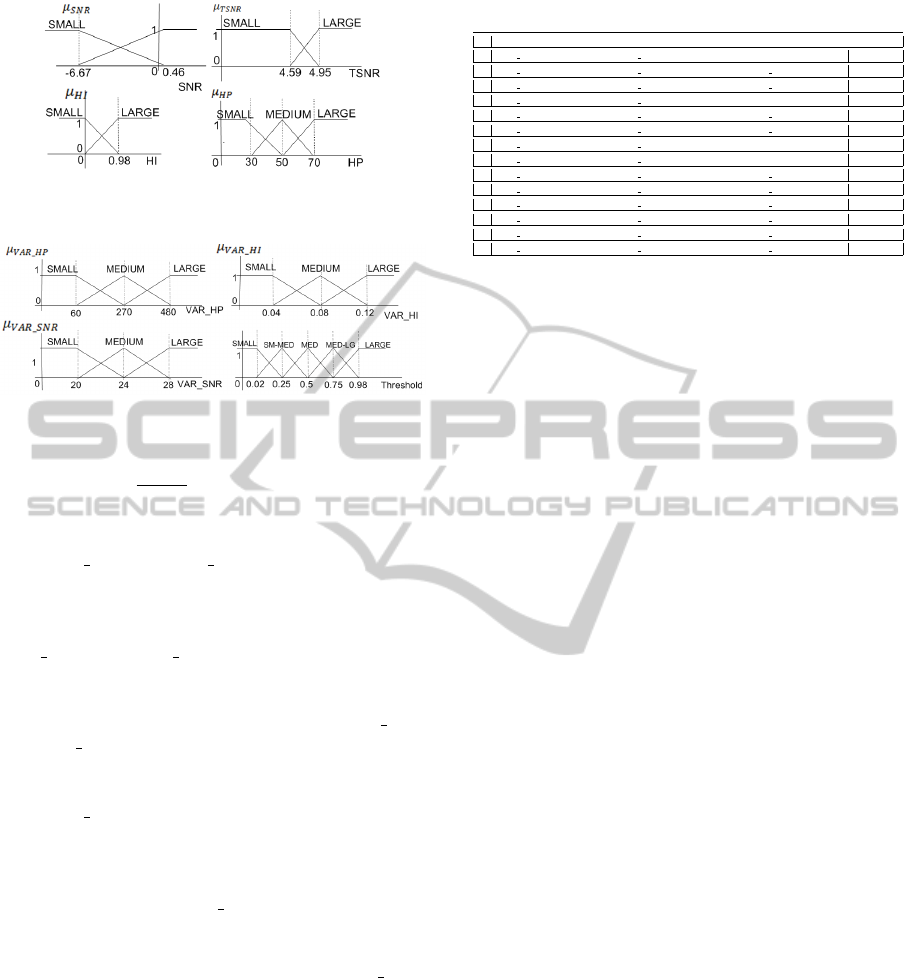
Figure 4: Fuzzy skin detection rule-base: Membership
functions for the fuzzy sets.
Figure 5: Fuzzy threshold calculation: Membership func-
tions for the fuzzy sets.
µ =
1
nc ∗ n f
n f
∑
v=1
(
nc
∑
u=1
(x
uv
) (8)
In these sets, the variances of the SNR and HP va-
lues (VAR SNR and VAR HP, respectively) are small
when few pixels have a high value of these magni-
tudes. This can be why, either skin regions are small
or the quality of the acquired PPG signals is not good.
VAR SNR and VAR HP are medium when, either
the quality of the acquired PPG signals is medium
or there are regions with very good quality and re-
gions with very bad quality. And, finally, VAR SNR
and VAR HP are large when the quality of the PPG
input is usually good and region is medium in size.
With the last input, the variance of the hue index va-
lues (VAR HI), the followed reasoning is similar. It is
small when, in few pixels, there is a dominant color
in the red range and as before, this can be why, either
skin regions are small or the quality of hue compo-
nent is not good. If VAR HI is medium, it can be
considered that the quality of hue is good although it
also happens that red areas have been detected in the
image but not in the correct position. If VAR HI is
large, either the skin areas are large or the number of
red range false positive cases in the image is high.
Taking these ideas into account, in general, when
the value of these three indexes are small, the output
of the first rule base is less defined, that is, it is closer
to zero. Then, threshold should be also small. If one
or several indexes are high, the value of the threshold
will increase, but when the three indexes are high, the
subject in the image is usually taken the whole image
up. In this case, it is necessary to decrease the value
of the threshold. This knowledge has been expressed
using the rule set shown in Table 2.
Table 2: Fuzzy threshold calculation for binarization.
ID IF ANTECEDENTS THEN CONSEQ
1 VAR HI = SMALL AND VAR SNR = SMALL SMALL
2 VAR HI = SMALL AND VAR SNR = MEDIUM AND VAR HP = SMALL SMALL
3 VAR HI = SMALL AND VAR SNR = MEDIUM AND VAR HP = LARGE MEDIUM
4 VAR HI = SMALL AND VAR SNR = LARGE MED-LG
5 VAR HI = MEDIUM AND VAR SNR = SMALL AND VAR HP = SMALL SM-MED
6 VAR HI = MEDIUM AND VAR SNR = SMALL AND VAR HP = MEDIUM MEDIUM
7 VAR HI = MEDIUM AND VAR SNR = MEDIUM MEDIUM
8 VAR HI = MEDIUM AND VAR SNR = LARGE MEDIUM
9 VAR HI = LARGE AND VAR SNR = SMALL AND VAR HP = SMALL SM-MED
10 VAR HI = LARGE AND VAR SNR = MEDIUM AND VAR HP = SMALL MEDIUM
11 VAR HI = LARGE AND VAR SNR = MEDIUM AND VAR HP = MEDIUM MEDIUM
12 VAR HI = LARGE AND VAR SNR = MEDIUM AND VAR HP = LARGE MED-LG
13 VAR HI = LARGE AND VAR SNR = LARGE AND VAR HP = MEDIUM LARGE
14 VAR HI = LARGE AND VAR SNR = LARGE AND VAR HP = LARGE MEDIUM
The output variable has been defined by means of
five fuzzy sets which has been also shown in Fig.5.
As in the first subsystem, the fuzzy mean algorithm
has been used as defuzzification method.
5 SETUP AND VIDEO DATABASE
A 768 x 576 pixels, 8-bit, global shutter RGB CCD
camera (type USB UI-2230SE-C of IDS Gmbh) with
a flexible C-mount lens (Tamron 12VM412ASIR),
operated at 20 frames/s, has been used for recording
some videos to test the system. The duration of the
video recording was set to 2 min and uncompressed
data were stored. Subjects were asked to sit and re-
lax for 2 min prior to the recording to ensure a stable
pulse rate. Also, they were asked to remain stationary
for the duration of the recordings.
A total of 22 video sequences with 18 people with
different skin-types have been used in the final tests.
The followed nomenclature for identifying the men-
tioned recordings is: L1-L2N, where L1 is I, II, III,
IV or V (roughly estimated skin-type on Fitzpatrick
scale), L2 is M, or F (Male, or Female subject), and N
is the number of recordings of this type that have been
captured. Following this terminology, V-M1 means
the first sequence registering a male subject having an
estimated skin-type V on Fitzpatrick’s scale.
6 SIMULATIONS RESULTS
Fig. 6 shows some examples of sequences that have
been processed. The first seven rows describe the be-
havior of the first rule-base. Examining them, it is
possible to extract mainly three conclusions:
• Both, PPG information and hue information, play
an important role in the system. In I-M1 and I-F1
video sequences, for example, it is the PPG input
which provide more confident information since a
bad hue index detection has been done as a result
AutomaticROIforRemotePhotoplethysmographyusingPPGandColorFeatures
361
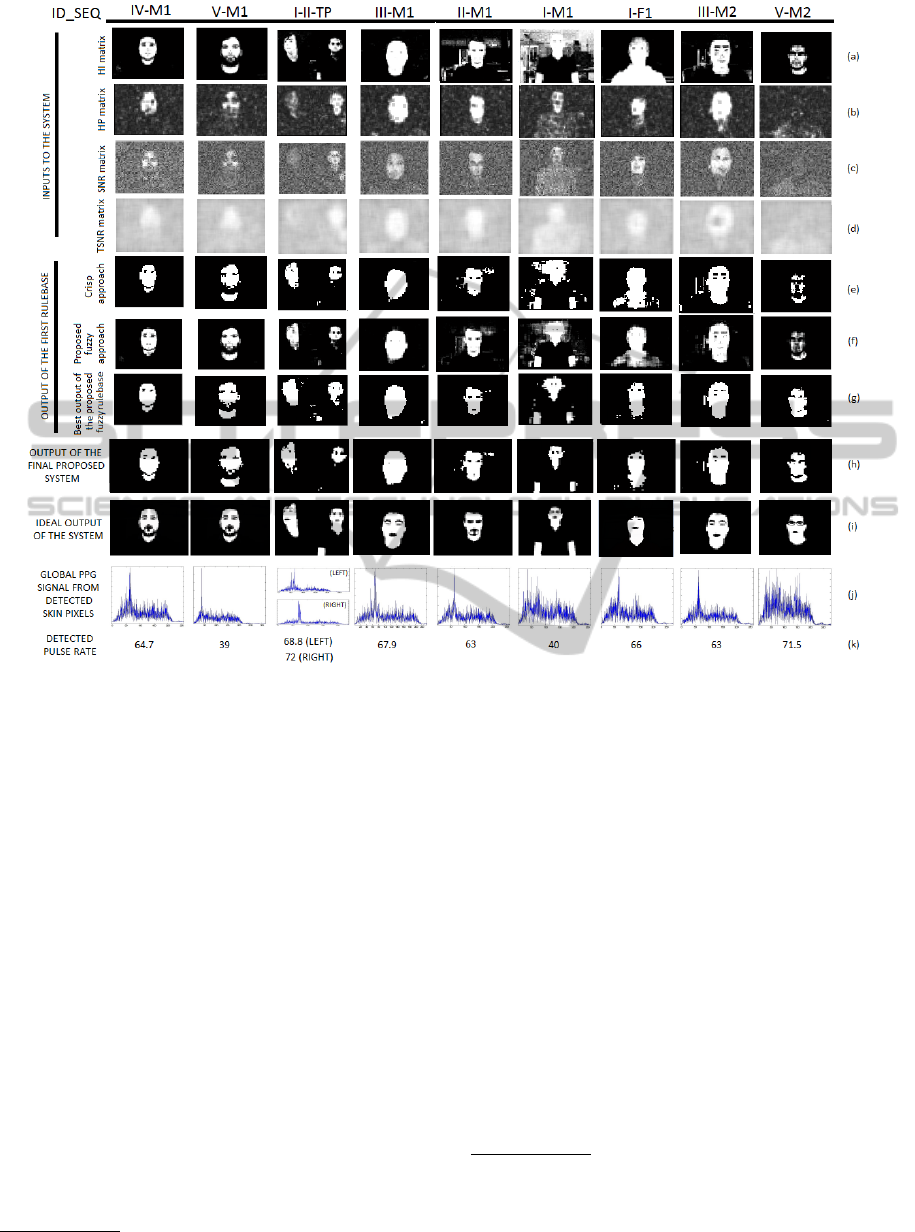
Figure 6: (a)-(d) Inputs of the first rule-base, (e) Output of the crisp approach for the first rule-base (f) Fuzzy output of
the first rulebase (g) Best output of the first rule-base calculated by means of the true and the false success rate trade-off
in the performed classification (See ROC Curves (Oberti et al., 1999)) (h) Output of the proposed final system (i) Ideal
hand-segmented output of the skin detection system (j) Global PPG signal in the image (k) Detected pulse rate from (j).
of red colors clothes and noise. In other cases, ho-
wever, such as V-M2, magnitudes obtained from
PPG signals have low values (skin shapes are not
visually appreciated) and, consequently, a deci-
sion about this pixel is hard based on this type
of information. In these cases, the input related
with hue is decisive and it is able to improve the
output of the system up to provide an acceptable
result in skin detection. Despite all, among these
cases, there are situations, as happens in IV-M1,
where PPG input can slightly improve the output
that provide only the hue input, for example, hel-
ping in the detection of eyes. An example where
both kind of input signals are good is II-M1.
• The influence of fuzzy logic in the system is rele-
vant. It can be easily corroborated comparing the
rows (e) and (f) of Fig. 6. In I-M1, I-F1 and V-
M2, specially, fuzzy logic improves significantly
results of crisp approach
1
.
1
Unlike the fuzzy approach in which a element can be-
• The performance of this first rule-base is good
since, in the figures of the row (f) it is already pos-
sible to distinguish visually the skin of the image,
which, in a perfect detection, should be equal to
the figures shown of the row (i). However, in cases
such as I-F1 or I-M1, the necessity to establish a
good threshold that changes dynamically with the
video sequences, is appreciated. With that desired
threshold value, the output of the system would be
similar to the ideal output (See rows (g) and (i)).
The performance of the second rule-base (it pro-
vides the searched threshold) has been evaluated
numerically, comparing the best and the calculated
threshold value. In 13 of the 22 processed video se-
quence, the committed error was less than 0.1. Al-
though in the majority of the rest of the sequences the
long to several sets with different membership grade, in the
crisp approach, each element can only belong to one set. In
this work, the limit between sets has been established as the
middle point of the parameters of the fuzzy set. The output
of the system in this case is obtained using a decision-tree.
VISAPP2015-InternationalConferenceonComputerVisionTheoryandApplications
362

error is a bit larger (between 0.15 and 0.25), this error
do not have too much influence on the output of the
system (see (h) and (i) rows of Fig.6). There are only
two cases, III-M1 and I-II-TP, where the error is re-
levant (around 0.45). In them, the difference between
the desired and the real output is significant.
The last two rows of Fig.6 show the results of
an simple example in which a global PPG signal has
been obtained from each set of extracted connected
skin pixels in the image. To achieve it, after the skin
detection carried out with the proposed system, a con-
nected component labeling (CCL) algorithm has been
also applied to discriminate between the different sub-
jects in the image, for example, in case of I-II-TP.
Later, the global signal for each blob is calculated,
choosing for each frequency value of the new signal,
the most frequent value in that frequency among all
the skin pixels belonging to that blob. Choosing the
mode value, although the signal was not good in all
the pixels of the skin, the detection will be right and,
as a result of it, the shape of the obtained global PPG
signals is very similar to the shape of a signal obtained
in a pixel belonging to the forehead of each subject
using (de Haan et al., 2013). Finally, a peak detection
is made in that global signal, allowing to obtain auto-
matically the pulse rate value of each person. Except
in case I-M1, in which the highest found peak (in 40
Mhz) doesn’t correspond to the actual pulse rate (in
72.5 MHz), the pulse rate value is correctly detected
with the proposed system.
6.1 Comparison with Other Techniques
The original idea to use rPPG for performing a
high level task like skin-detection was first shown in
(Schmitz, 2010) and claimed in (US 8542877, 2010).
Apart from the presented contribution, other work
where this method is used has been published recently
(Gibert et al., 2013). In it, the estimation of pixels
belonging to skin from a presence/absence of heart
rate index, which is calculated using the mean and the
maximum spectral power of the PPG signal in each
region of the image, is addressed. Later, a cleaning
processing of false detections is carried out, removing
ROIs that are not surrounding by others ROIs with a
valid heart rate value and including ROIs in the neigh-
borhood of well-detected ROIs whose difference of
pulse rate value with the true value was less than 3
beats per minute. Although (Gibert et al., 2013) did
not propose subsequent use for improving the PPG
analysis, in our benchmarking of the proposed sys-
tem, pulse rate detection has been also carried out
with an implementation of the (Gibert et al., 2013)
method, as it was done in the previous section with
Figure 7: Skin detection achieved by the (Gibert et al.,
2013) implementation.
the proposed system. The used implementation of the
Fast ICA algorithm needed to obtain the PPG signal
in that algorithm has been found in (Delorme’s Web-
Page). To get a fair comparison, the duration of the
considered analysis window has been 60 sec. whereas
the used ROI dimensions have been (12 x 12).
Fig. 7 shows the resulting skin detection. As it can
be appreciated visually, comparing this figure with re-
sults in Fig. 6, the proposed system improves the at-
tained resolution and definition of the pieces of skin
in addition to increase the detection index (for exam-
ple, in cases I-II-TP or V-M2). To support this visual
impressions, Table 3, which gathers some quantita-
tive measures of the quality of the skin extraction, has
been also included. In addition to the true positive
and negative rates (TPR and (1-FPR), respectively),
this table shows values of other two overall measures,
similarity and F-Measure, to also prove the improve-
ment of the proposed system. As a result of this bad
skin extraction with some sequences, the pulse rate
detection is not so good. In some cases, such as I-
II-TP, there is no peak for making the pulse rate de-
tection, whereas in some other cases, e.g. V-M1 and
V-M2, an incorrect peak is being detected.
7 CONCLUSIONS
The main contribution of our paper is a low-cost sys-
tem for increasing the robustness of an earlier pro-
posed pulse rate detector based on remote photo-
plethysmography. The system combines, by means of
fuzzy logic, PPG and hue features in a video sequence
Table 3: Quantitative quality measures of the skin ex-
traction. TN/TP = True negative/positive classified pixels,
FN/FP = False negative/positive classified pixels.
TPR 1-FPR Similarity F-Measure
T P
T P+FN
T N
T N+FP
T P
T P+FN+F P
2T P
2T P+FN+F P
(Gibert et
al., 2013)
V-M1 0.9422 0.8786 0.4988 0.6656
I-II-TP 0.5678 0.7912 0.3072 0.4701
III-M1 0.7734 0.9101 0.5879 0.7405
II-M1 0.8947 0.9363 0.5936 0.7450
III-M2 0.8707 0.9259 0.7020 0.8249
V-M2 0.1779 0.9949 0.1730 0.2950
Proposed
algorithm
V-M1 0.9911 0.9568 0.7534 0.8593
I-II-TP 0.6773 0.9846 0.6384 0.7793
III-M1 0.8771 0.9623 0.7745 0.8729
II-M1 0.9904 0.9495 0.7065 0.8280
III-M2 0.9682 0.9574 0.8506 0.9193
V-M2 0.8470 0.9730 0.7346 0.8470
AutomaticROIforRemotePhotoplethysmographyusingPPGandColorFeatures
363

to arrive at a robust skin detection. Once the region-
of-interest has been extracted, the already done PPG
analysis is filtered and modified to make the pulse
rate detection more confident. Achieved results on
skin and pulse rate detection have been evaluated and
benchmarked with a recent publication on this topic.
ACKNOWLEDGEMENTS
The authors like to thank the colleagues from the
Electronic Systems group, Dept. EE, of the Eind-
hoven University of Technology for acting as sub-
jects in our test, and particularly S.D. Fernando and
W. Wang for further assisting with the equipment and
the recording, and Cosmin Sabarnescu for the code
for estimating PPG signals that he build during his in-
ternship in the group.
This work was partially supported by TEC2011-
24319 from the Spanish Government and P08-TIC-
03674 from the Andalusian Regional Government
(both with support from FEDER). E. Calvo-Gallego
is funded by a FPU fellowship from the Spanish Gov-
ernment.
REFERENCES
Hertzman, A. B. (1937) Photoelectric plethysmography of
the fingers and toes in man, Exp. Biol. Med., vol. 37,
no. 3, pp. 529-534, 1937
Allen, J. (2007), Photoplethysmography and its application
in clinical physiological measurement, Physiological
Measurement, vol. 28, no. 3, pp. R1R39
Huelsbusch, M. and Blazek, V. (2002). Contactless map-
ping of rhythmical phenomena in tissue perfusion us-
ing PPGI, Proc. SPIE, vol. 4683, pp. 110-117
Takano, C. and Ohta, Y. (2007), Heart rate measurement
based on a time-lapse image, Med. Eng. Phys., vol.
29, pp. 853-857
Verkruysse, W. and Svaasand, L.O. and Nelson, J.S.
(2008), Remote plethysmographic imaging using am-
bient light, Opt. Exp., vol. 16, no. 26, pp. 21434/5
Glass, K.A., Frishkoff, G.A., Frank, R.M. Davey, C. Dien,
J. Malony, A.D. and Tucker, D.M. (2004), A frame-
work for evaluating ICA methods of artefact removal
from multichannel EEG, Proc. 5th Int. Conf. ICA
2004, Spain, Sept.
H
¨
ulsbusch, M. (2008), An image-based functional method
for opto-electronic detection of skin-perfusion, PhD
Thesis, RWTH Aachen, Depart. of EE, (in German)
Lewandowska, M. and Ruminski, J. and Kocejko, T. and
Nowak, J. (2011), Measuring pulse rate with a we-
bcam - A non-contact method for evaluating cardiac
activity, Proc. Federated Conf. Comput. Sci. Inform.
Syst., pp. 405-410
Poh, M.Z. and McDuff, D.J. and Picard, R.W. (2010), Non-
contact, automated cardiac pulse measurements using
video imaging and blind source separation, Optics
Express, vol. 18, no. 10, pp. 10762-10774
De Haan, G. and Jeanne, V. (2013), Robust Pulse Rate From
Chrominance-Based rPPG IEEE Transactions on
Biomedical Engineering, vol. 60, no. 10, pp. 2878/86
Lempe, G. and Zaunseder, S. and Wirthgen, T. and Zipser,
S. and Malberg, H. (2013), ROI Selection for Remote
Photoplethysmography Bildverarbeitung fr die Medi-
zin, Springer Berlin Heidelberg
De Haan, G. and Biezen, P.W. (1994), Sub-pixel motion
estimation with 3-D recursive search block-matching.
Signal Processing: Image Communication, vol. 6, n. 3
De Haan, G. (2010), Chapter 10: Motion compensation.
Digital Video Post Processing, Eindhoven, pp. 225/27
Kelly, W. and Donnellan, A. and Molloy, D. (2008), Screen-
ing for Objectionable Images: A Review of Skin De-
tection Techniques IEEE International Machine Vi-
sion and Image Processing Conference
Vezhnevets, V. and Sazonov, V. and Andreeva, A. (2003), A
survey on pixel-based skin color detection techniques.
Proc. Graphicon, vol. 3, pp. 8592
Kakumanu, P. and Makrogiannis, S. and Bourbakis, N.
(2007), A survey of skin-color modeling and detec-
tion methods. Pattern Recognition, vol. 40, no. 3
Xfuzzy [Online] http://www2.imse-cnm.csic.es/Xfuzzy/
Oberti, F. and Teschioni, A. and Regazzoni, C.S. (1999),
ROC curves for performance evaluation of video se-
quences processing systems for surveillance applica-
tions. Proceedings International Conference on Image
Processing, ICIP, vol. 2, pp. 949-953
Schmitz, G.L.L.H. (2010) Video camera based photo-
plethysmography using ambient light Master gradu-
ation paper, Electrical Engineering, Publ. of TUE
Jeanne, V. and De Bruijn, F.J. and Vlutters, R. and Cennini,
G. and Chestakov, D (2010) Processing images of at
least one living being US Patent 8,542,877
Gibert, G. and DAlessandro, D. and Lance, F. (2013),
Face detection method based on photoplethysmog-
raphy. 10th IEEE International Conference on Ad-
vanced Video and Signal Based Surveillance (AVSS)
Delorme’s WebPage [Online], http://sccn.ucsd.edu/ arno/
VISAPP2015-InternationalConferenceonComputerVisionTheoryandApplications
364
