
A Probabilistic Feature Fusion for Building Detection in Satellite Images
Dimitrios Konstantinidis
1
, Tania Stathaki
1
, Vasileios Argyriou
2
and Nikos Grammalidis
3
1
Communications and Signal Processing, Imperial College London, London, U.K.
2
Computing and Information Systems, Kingston University, London, U.K.
3
CERTH-ITI, Thessaloniki, Greece
Keywords:
Building Detection, Satellite Images, HOG, NDVI, FAST Algorithm, Probabilistic Fusion.
Abstract:
Building segmentation from 2D images can be a very challenging task due to the variety of objects that ap-
pear in an urban environment. Many algorithms that attempt to automatically extract buildings from satellite
images face serious problems and limitations. In this paper, we address some of these problems by applying a
novel approach that is based on the fusion of Histogram of Oriented Gradients (HOG), Normalized Difference
Vegetation Index (NDVI) and Features from Accelerated Segment Test (FAST) features. We will demonstrate
that by taking advantage of the multi-spectral nature of a satellite image and by employing a probabilistic fu-
sion of the aforementioned features, we manage to create a novel methodology that increases the performance
of a building detector compared to other state-of-the-art methods.
1 INTRODUCTION
Building detection is considered an important task for
several applications, such as city mapping and urban
planning. Cadastral offices can use such information
to prevent illegal building activity or track changes in
an urban environment that can occur either naturally
with the construction/demolition of buildings or by
the force of nature. Another application is the analysis
and assessment of the impact of fire, flood and natural
disasters on an urban environment, which can assist
municipalities on taking necessary measures and pre-
cautions to minimize consequences and save human
lives in the future. Although building detection can
be achieved manually by human experts, the speed
with which modern cities change, makes the develop-
ment of automatic building detection algorithms im-
perative. However, building detection can be a chal-
lenging task even for state-of-the-art algorithms, since
buildings appear in various shapes and colors, they
can be affected by weather conditions and satellite
resolution and they can partially be occluded by other
buildings or tall trees.
Building detection algorithms can be classified
based on the dimensionality and processing method
of the available data. The existence of 3D data can
give rise to 3D building detection algorithms, while
images allow the development of 2D algorithms. 2D
algorithms can be further split to those that deal with
the task of building detection on the pixel level by em-
ploying image segmentation techniques and those that
handle buildings as objects and perform model-based
techniques. The proposed algorithm can be catego-
rized as a model-based technique. It extracts three
types of features from an image and classifies image
blocks to those that describe a building and those that
do not.
This work makes two new significant contribu-
tions to the problem of building detection. Firstly, it
exploits multi-modal data as it takes advantage of all
the available channels of a satellite image. Moreover,
we propose the use of a novel probabilistic frame-
work to fuse the different types of features. As we
will demonstrate, these novelties can give a boost to
our algorithm’s performance in the building detection
task.
The rest of the paper is organized as follows.
In Section 2 we provide a review on state-of-the-art
building detection algorithms, while in Section 3 we
describe our proposed methodology. In Section 4 we
present the datasets used and the experimetal results
obtained. Finally, conclusions are drawn in section 5.
2 RELATED WORK
Building extraction methodologies can be classified
in two major categories, based on the dimensional-
205
Konstantinidis D., Stathaki T., Argyriou V. and Grammalidis N..
A Probabilistic Feature Fusion for Building Detection in Satellite Images.
DOI: 10.5220/0005260502050212
In Proceedings of the 10th International Conference on Computer Vision Theory and Applications (VISAPP-2015), pages 205-212
ISBN: 978-989-758-090-1
Copyright
c
2015 SCITEPRESS (Science and Technology Publications, Lda.)

ity of the data they process. The first category con-
sists of algorithms that process 3D data, in the form
of LiDAR point clouds and Digital Surface Mod-
els (DSMs) that can describe the height of a ter-
rain. In (Hu et al., 2004), 3D planes were identified
and matched to possible building rooftops, while in
(Karantzalos and Paragios, 2010), 3D templates were
utilized as a means to identify building shapes. Un-
fortunately, 3D models can be quite inaccurate due to
sensor limitations and introduce significant errors to
the building detection task.
In the second category of building detection meth-
ods, there are algorithms that process 2D images ei-
ther on the pixel or model/object level. Caselles et
al. was the first to introduce geodesic active contours
as a means to segment an object of interest from an
image (Caselles et al., 1995). His work inspired oth-
ers to detect buildings by developing a circular cast
algorithm to find appropriate initialization contours
(Theng, 2006) or by constructing a suitable energy
function to be used on a level-set segmentation al-
gorithm (Karantzalos and Argialas, 2009). Neverthe-
less, it is hard to construct an energy function that can
characterize every building in an image, due to the
variety in the appearance and shape of buildings. A
spatial k-means clustering algorithm was developed
in (Li et al., 2007) for multi-spectral image segmen-
tation, while super-pixels, i.e. the smallest clusters of
pixels an image can be split, were used for building
detection in (Kluckner and Bischof, 2010). However,
the resulting clusters cannot easily be associated with
buildings due to their irregular shapes.
Model-based algorithms consider buildings as ob-
jects and attempt to extract them by finding distinctive
features. In (Haverkamp, 2004), graph theory is uti-
lized to merge lines into meaningful shapes, while in
(Woo et al., 2008), the authors developed a method
to label and group corners so as to extract buildings.
Nonetheless, noise and aliasing effects can pose prob-
lems to line and corner extraction methods. Tem-
plates, which are parameterized shapes, are employed
as another way to solve the problem of building de-
tection. 2D deformable templates and roof topol-
ogy graphs were used for building detection in (Vin-
son et al., 2001) and (Verma et al., 2006) respec-
tively. However, creating a template for every possi-
ble building shape that can exist in an urban environ-
ment seems impossible, so one has to make certain
assumptions about the shape of the extracted build-
ings.
Building extraction has also been achieved by
fuzzy logic and probabilistic theory. Fuzzy logic was
employed on the spectral and spatial properties of
pixels in (Shackelford and Davis, 2003). Markov
Random Fields (MRFs) were used as an alternative
technique to separate buildings from background in a
probabilistic framework (Chai et al., 2012). Finally,
many techniques take advantage of the multi-spectral
nature of images, and more specifically the NDVI
index to separate man-made objects from vegetation
(Singh et al., 2012). Shadow detection has also been
incorporated in several methodologies, as a way to de-
note the existence of nearby tall structures, which can
be candidate buildings (Benarchid et al., 2013).
Our technique can be classified as a model-based
approach. We employ HOG descriptors as core fea-
tures to describe buildings. A Support Vector Ma-
chine (SVM) classifier is used to discriminate be-
tween building and non-building image patches and
NDVI and FAST features are computed for the iden-
tified building patches to enhance the classification
performance. Our strategy overcomes some of the in-
herent disadvantages of other techniques. Images are
easier to acquire and often yield a more accurate rep-
resentation of the urban environment than 3D models.
What is more, the parameters of the HOG algorithm
can be tuned to work well with several images, with-
out suffering from huge performance degradation. Fi-
nally, a HOG algorithm is robust to shape variations
and can detect a variety of shapes, given that it is
trained with a representative set of possible build-
ing shapes. As we will demonstrate, our proposed
methodology performs better than other state-of-the-
art algorithms that employ HOG features (Ilsever and
Unsalan, 2013) or fuse multiple features (Sirmacek
and Unsalan, 2011).
3 METHODOLOGY
In this paper, we assume that all input images are
already orthorectified, which means that distortions
caused from the sensor and the earth’s terrain have
been geometrically removed before we apply any
methodology. Our approach takes an image as input
and extracts HOG, NDVI and FAST features. After-
wards, it employs a Bayesian method to fuse these
features and outputs a set of image regions that con-
tain buildings.
One of the first problems that needs to be ad-
dressed when dealing with multi-spectral images is
the resolution of the satellite data. A satellite can pro-
duce panchromatic images of much higher resolution
than the resolution of multi-spectral images. To take
advantage of the higher resolution of the panchro-
matic image, a procedure, known as multi-spectral
band sharpening is employed. The goal is to fuse the
two types of images in order to create a multi-spectral
VISAPP2015-InternationalConferenceonComputerVisionTheoryandApplications
206
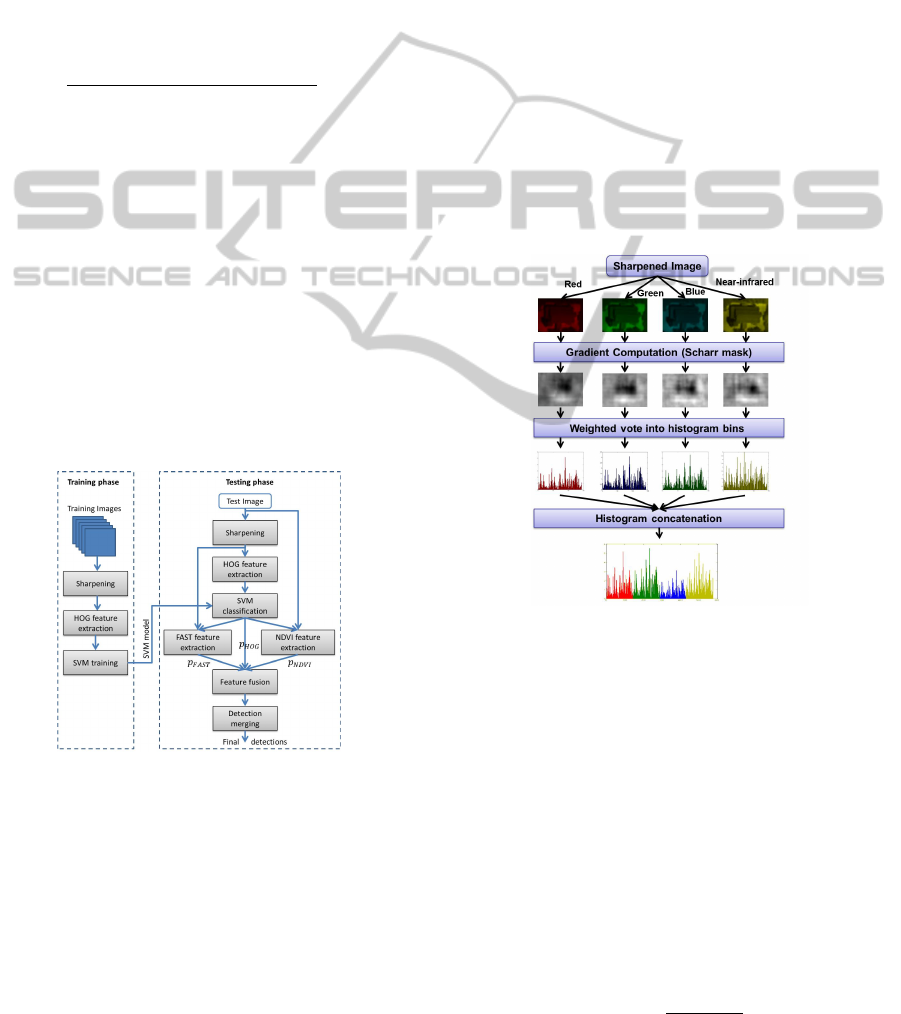
image with the same resolution as the panchromatic
image. Such a sharpened multi-spectral image can
significantly enhance the accuracy of a building de-
tection algorithm. Vrabel tested various sharpening
algorithms to find out that the CN algorithm performs
the best (Vrabel, 2000). According to the CN al-
gorithm (Hallada and Cox, 1983), if MS
i
is the i
th
low-resolution multi-spectral band and PAN is the
panchromatic band, then the following equation pro-
duces the i
th
high-resolution color normalized multi-
spectral band CN
i
CN
i
=
(MS
i
+ 1.0) ∗ (PAN + 1.0) ∗ 3.0
∑
i
MS
i
+ 3.0
− 1.0 (1)
The HOG algorithm was initially introduced as a
means to detect pedestrians in an image (Dalal and
Triggs, 2005). A HOG descriptor is computed in an
image region that is further divided into subregions,
which are called cells. In each cell, a 1D histogram of
the orientations of the gradients of the pixels present
inside the cell is computed. By tuning the parameters
that affect the creation of the histograms, a feature can
be developed that can differentiate image regions that
contain buildings from those that do not. Our method-
ology, illustrated in figure 1, follows the standard ap-
proach for implementing a HOG algorithm, suggested
in (Dalal and Triggs, 2005) and it can be split in two
phases, i.e. a training and a testing phase.
Figure 1: Our building detection implementation.
In the training phase, manually labeled images are
employed and HOG descriptors for the two classes
are extracted. Every image is preprocessed before
the gradient computation. All pixels are initially di-
vided with the maximum discretization value, so that
they are in the range [0,1] and then a sharpening fil-
ter is applied. A sharpened image is the product of
the subtraction of the initial image with the same im-
age convolved with a Gaussian filter. The purpose of
the sharpening procedure is the enhancement of the
edges of an image so that buildings can become more
distinguishable in an urban environment.
After preprocessing, signed gradients are computed
by employing the Scharr operator separately to each
multi-spectral image channel. In each cell, the com-
puted gradients are used to cast votes into histogram
bins, weighted by their magnitude. What is more,
gradient magnitude is trilinearly interpolated in the
neighboring cells and bins to increase the robustness
of the HOG detector in slight rotations or transla-
tions of the object of interest (Dalal, 2006). A sin-
gle block with a rectangular kernel is employed for
the HOG descriptor extraction in an image region.
The computed histograms, one for each channel of a
multi-spectral image, are concatenated into a single
histogram/descriptor. The HOG descriptors remain
unnormalised, since such a strategy produces better
results than any normalization schemes (see Section
4.2). The entire HOG feature extraction procedure is
illustrated in figure 2.
Figure 2: HOG feature extraction procedure.
The extracted HOG descriptors are then introduced to
a SVM classifier with a Radial Basis Function (RBF)
kernel, since such a classifier is considered suitable
for binary classification problems. A SVM model
is trained and is used for classification in the testing
phase.
In the testing phase, each test image is split in over-
lapping regions of multiple sizes (scales) and a HOG
descriptor is extracted for each image region. Then,
the HOG descriptors are classified to the building and
non-building classes, using the SVM model that was
previously trained. The scores x of the SVM classi-
fier are transformed into probabilities p
HOG
using the
sigmoid function
p
HOG
=
1
1 + e
Ax+B
(2)
AProbabilisticFeatureFusionforBuildingDetectioninSatelliteImages
207

The constant terms A and B are determined by mini-
mizing the negative log likelihood of the training data
min(−
∑
i
(t
i
∗log(p
HOG
i
)+(1−t
i
)∗log(1− p
HOG
i
))),
where t
i
is equal to 0 for negative samples and 1 for
positive samples (Platt, 1999). An initial set of can-
didate building regions is formed by keeping only the
image regions that are classified in the building class
by the SVM model (i.e. SVM score x higher than
0), since the seperating hyperplane is found to give
the best discriminative power to our algorithm. After-
wards, the NDVI mask and FAST features are com-
puted for these image regions. The goal is to reduce
the number of false alarms that the HOG algorithm
creates.
The NDVI is a well-known index that can distinguish
vegetated from non-vegetated areas, since vegetation
tend to produce higher values for this index than man-
made structures. NDVI is computed using the near-
infrared and red channels as shown below, where ρ
NIR
and ρ
R
are the near-infrared and red channels respec-
tively.
NDV I =
ρ
NIR
− ρ
R
ρ
NIR
+ ρ
R
(3)
A threshold is automatically chosen using the Otsu’s
method and therefore, a binary NDVI mask can be
formed to identify vegetation pixels in an image re-
gion. A probability p
NDV I
is then computed for each
region and is defined as the number of pixels in the
region that are not identified as vegetation, divided by
the total number of pixels in the region.
Buildings, due to their rectangular shape, usually have
strong corners, which is an important cue for building
segmentation. FAST algorithm is a robust corner de-
tector, which provides a set of corner features (pixels)
along with a corresponding score (i.e. intensity differ-
ence to their neighboring pixels) (Rosten and Drum-
mond, 2006). In this paper, we compute FAST fea-
tures for each sharpened channel of a multi-spectral
image. If two or more features are identified in the
same position(pixel), the one with the largest score is
preserved.
For each candidate building region, a probability
p
FAST
is computed based on the FAST features by em-
ploying the following strategy, which is based on the
notion that building corners typically point towards
the center of the building, as opposed to irrelevant cor-
ners. For every feature F
i
, a line L
i
is defined, passing
through the feature and having the orientation of the
image gradient at F
i
. Then, a new feature F
′
i
is com-
puted as the point in L
i
closest to the center of the
candidate building region. For every feature F
′
i
, a 2D
Gaussian distribution having as peak the score of F
i
is
defined. A sum of these distributions is computed for
every pixel in a candidate building region k and the
maximum value V
k
is identified, which indicates the
strength of the corners in the region. The probability
p
FAST
for each region k is equal to the value V
k
di-
vided by the maximum value max
k
(V
k
) among all the
candidate regions, assuming that the region with the
highest value represents a true building.
Afterwards, the three probabilities are fused using
the Bayesian method shown in equation (4) to form
an overall probability that a candidate region corre-
sponds to a building.
p(B|O) =
p(B, O)
p(O)
=
p
HOG
∗ p
NDV I
∗ p
FAST
Z
(4)
In equation (4), the posterior probability p(B|O) of
a region describing a building given the observa-
tions depends on the joint probability p(B, O), which,
assuming the independency of the observations, is
equal to the product of probabilities p
HOG
, p
FAST
and
p
NDV I
. The normalization term Z which equals to
p
HOG
∗ p
NDV I
∗ p
FAST
+ (1 − p
HOG
) ∗ (1 − p
NDV I
) ∗
(1 − p
FAST
) ensures that the probabilities of building
and non-building add up to unity.
We accept as candidate building regions only those
with a posterior probability equal or higher than 0.5.
However, the HOG algorithm produces overlapping
building candidate regions, hence a detection merg-
ing procedure is required. For this reason, a mean-
shift algorithm (Dalal, 2006) is employed to reduce
the number of detected regions. More specifically, the
regions can be considered as points (x, y, z) in the 3D
space weighted by their posterior probability p(B|O),
where x and y are the coordinates of the center of the
region and z is the logarithm of the scale where the
region was detected (Dalal, 2006). A set of uncertain-
ties that describe how far points can be in order to be
merged were also defined.
However, there may still be overlapping regions that
cannot be merged because the selected uncertainties
may not sufficiently describe the distribution of re-
gions. To cope with this problem, we developed a
rectangle grouping algorithm that detects overlapping
rectangles (regions). Two rectangles are considered
overlapping, if at least half the area of one rectangle is
enclosed within the other rectangle. In the first phase,
the algorithm discards large rectangles that overlap
with two or more smaller rectangles that do not over-
lap with each other. Such rectangles cannot be consid-
ered as appropriate building regions because they usu-
ally contain two or more buildings that are described
by the enclosed regions. In the second phase, the re-
maining pairs of overlapping regions are compared
and the region with the highest posterior probabil-
ity p(B|O) is preserved, while the other is discarded.
The remaining regions define the final output of our
methodology.
VISAPP2015-InternationalConferenceonComputerVisionTheoryandApplications
208

4 EXPERIMENTS AND RESULTS
In this section, we describe our dataset, present the
experiments for the optimal parameter configuration
and demonstrate the performance of our method on
a test set. Finally, we compare our algorithm with
another HOG implementation that was developed in
(Ilsever and Unsalan, 2013) and another state-of-the-
art methodology that fuses various corner features as
described in (Sirmacek and Unsalan, 2011).
4.1 Dataset
Our training dataset consists of 700 positive and 1000
negative manually segmented and labeled QuickBird
images. The positive samples contain buildings in
arbitrary orientations in order to increase the robust-
ness of the HOG detector in the building orientation.
To further increase the accuracy of the classifier, 400
hard negatives are obtained by executing the HOG al-
gorithm on QuickBird images with no buildings and
are used to re-train the SVM classifier.
Our test set consists of 29 images depicting a subur-
ban area of Athens, Greece, along with their ground
truth data of building locations. All the images depict
6 different areas that are captured on 5 different time
intervals each and more specifically in years 2006,
2007, 2009 for the QuickBird satellite and 2010, 2011
for the WorldView 2 satellite.
The parameter selection for the HOG implementation
is based on a validation set created by automatically
extracting positive and negative samples arbitrarily
from the test images. Our validation set consists of
3000 positive and 6000 negative image patches.
4.2 Parameter Selection
Various filtering techniques, such as Gaussian filter-
ing, bilateral filtering, median filtering and sharpen-
ing were tested. The results show that the sharpen-
ing technique performs better than other preprocess-
ing steps. The size of the filters for every preprocess-
ing technique is selected equal to 5 × 5 pixels. Ex-
periments were also performed to select the optimal
parameter configuration for the HOG algorithm. The
parameter selection is based on the optimization of
the well-known metric of F1-score that the algorithm
achieves on the validation set.
Two alternative methods were tested for merging
channel gradients for the HOG feature extraction pro-
cedure. Given that the terms C
iX
and C
iY
represent the
gradients of a pixel i of a channel C of a multi-spectral
image along the horizontal and vertical directions,
the first method identifies for each pixel the chan-
nel Cmax
i
= argmax
C
√
C
2
iX
+C
2
iY
associated with the
largest gradient magnitude among the channels of a
multi-spectral image. Then, the gradient magnitude
F
i
and orientation θ
i
are computed as follows:
F
i
=
√
Cmax
2
iX
+Cmax
2
iY
(5)
θ
i
= arctan
(
Cmax
iY
Cmax
iX
)
(6)
A second method for merging the channel gradients,
proposed in (Di Zenzo, 1986), was also evaluated. In
this case, the gradient magnitude F
i
and the orienta-
tion θ
i
are computed as follows:
G
ixy
=
∑
C
C
ix
C
iy
, x, y ∈ {X ,Y } (7)
θ
i
=
1
2
arctan(
2G
iXY
G
iXX
− G
iYY
) (8)
F
i
= G
iXX
cos
2
(θ
i
) + 2G
iXY
cos(θ
i
)sin(θ
i
)
+ G
iYY
sin
2
(θ
i
) (9)
If θ
i
is a solution, so is θ
i
±
π
2
. In such cases, the
orientation associated with the largest gradient mag-
nitude F
i
is used for the histogram computation. Fur-
thermore, if G
iXX
= G
iYY
and G
iXY
= 0, θ
i
cannot be
computed from equation (8), so it is not used.
However, both the above alternative methods for
merging channel gradients were found to be inferior
to the approach used in this paper, i.e. the computa-
tion of histogram of oriented gradients for each chan-
nel of a multi-spectral image and the concatenation of
all histograms in a single histogram.
Three masks for gradient computation were
tested. The default mask is a simple centered mask,
which can be expressed as a [-1 0 1] mask. The other
masks are the Sobel and the Scharr mask with sizes
3 × 3 pixels. We selected the Scharr mask as it out-
performs the other gradient masks. Furthermore, both
signed and unsigned gradients as well as histogram
bins of size 10 and 20 degrees were tested. The con-
clusion is that the signed gradients and histogram bins
of 10 degrees perform better.
Three block configurations were tested regarding
their effect on the performance of the algorithm. The
first configuration is a simple block that covers the
whole image patch. The second configuration con-
sists of 4 blocks that each covers a quarter of the area
of the image patch. The third configuration consists
of 5 blocks, each covering a quarter of the area of the
image patch. Four blocks are placed as in the previ-
ous configuration, while the fifth lies in the middle of
the image patch and overlaps with the others. Both
AProbabilisticFeatureFusionforBuildingDetectioninSatelliteImages
209

rectangular and circular HOG kernels were tested. A
rectangular kernel is divided in four smaller rectangu-
lar cells, while a circular kernel consists of 2 radial
cells with the outer cell split in 4 angular cells. Ex-
periments show that a single block with a rectangular
kernel is the optimal choice.
Experiments were also conducted to determine
how normalization of the HOG descriptors affects
the performance of the building detector. Block nor-
malization using the l
1
-norm or l
2
-norm, no normal-
ization and whole feature normalization after block
normalization using the l
1
-norm or l
2
-norm were at-
tempted. The results show that leaving the descriptors
unnormalized increases the classification accuracy of
the proposed algorithm.
Gamma correction, suggested in (Dalal and
Triggs, 2005) for improving the performance of a hu-
man detector, was also tested. Gamma correction
computes the square root of the value of each pixel
as the pixel’s representative value in order to compen-
sate for distortions in the viewing process. The re-
sults discourage the use of gamma correction for the
task of building detection as the maximum F1-score
achieved on the validation set drops by about 1.4%
when gamma correction is employed.
Finally, in order to improve the classification per-
formance of the HOG detector, we introduced hard
negatives in the training phase. Results show that
the maximum F1-score on the validation set increases
by 1.3% when the hard negatives are introduced.
Some of the conducted experiments are presented as
precision-recall curves in figure 3.
The optimal parameter configuration leads to four
histograms, one for each channel of the multi-spectral
image (red, green, blue, near-infrared) and each of
these histograms has 144 features (4 cells × 36 bins
per cell). The total descriptor length is therefore 576.
Figure 3: Precision-recall curves for HOG parameter selec-
tion.
4.3 Results
In order to detect buildings of various sizes in an im-
age, a HOG algorithm should run in multiple scales
(i.e. sizes of image regions), covering a range be-
tween a minimum and a maximum scale. The initial
size in the case of a QuickBird image is 20 ×20 pixels
and in the case of a WorldView 2 image is 22×22 pix-
els, given that the resolutions of the two satellites are
0.6m per pixel for the QuickBird and 0.5m per pixel
for the WorldView 2 satellite. These sizes are found to
be adequate to detect buildings with areas as small as
50m
2
. The displacement between two consecutive ex-
tracted image regions is equal to 5 pixels in the hori-
zontal or the vertical direction. The ratio between two
consecutive scales is selected to be equal to 1.1. The
maximum image region is equal to the largest build-
ing that should be detected. In our case, such a region
was selected equal to 110 × 110 and 130 × 130 pixels
for the Quickbird and WorldView 2 images respec-
tively. Such sizes can make a HOG detector capable
of identifying buildings as large as approx. 3000m
2
.
After experimentation, we choose the uncertain-
ties of the mean-shift algorithm that performs the de-
tection merging to be equal to 3 pixels for both the x
and y direction and log(1.3) for the scale. The final
extracted image regions of our algorithm are checked
whether they detect a building or not. A region is con-
sidered true positive if there is at least one pixel la-
beled as building, according to the ground truth data,
in a rectangle that is located in the middle of the im-
age region and has half the region’s size. This is quite
a strict rule, but we wanted to have a sufficient over-
lap between a region and a building to be considered
true positive.
To evaluate the performance of our algorithm in
the test set, we used the metrics of recall, precision
and F1-score. In our context, recall is the number
of detected buildings divided by the number of total
buildings found in an image. Precision is defined as
the number of regions that are true positives divided
by the total number of the extracted image regions.
Special care was taken so that buildings located at the
edges of an image and are partially seen are removed.
This happens because a HOG algorithm needs to en-
close a sufficiently large part of a building within the
extracted regions to identify it.
We run our algorithm in the 29 test images, con-
taining 6186 buildings to evaluate the improvement
from the use of the NDVI mask and the FAST fea-
tures. Although the introduction of NDVI leads to
a drop in the performance of our algorithm by about
1.3%, the addition of both the NDVI mask and the
FAST features increases the classification accuracy of
our algorithm by a measure of 4.9% with respect to
VISAPP2015-InternationalConferenceonComputerVisionTheoryandApplications
210
using only the HOG features. The experimental re-
sults on the test set are summarized in table 1.
Table 1: Results from the use of different features.
Recall Precision F1-score
HOG 0.857 0.553 0.672
HOG+NDVI 0.858 0.54 0.663
HOG+FAST 0.825 0.613 0.704
HOG+NDVI+FAST 0.85 0.602 0.705
Finally, we would like to compare our results with
two other building detection methodologies. A HOG
algorithm with a different set of parameters, the most
important of which are the gradient computation in
the panchromatic image, the use of unsigned gradi-
ents and the block normalization using the l
1
-norm
was developed in (Ilsever and Unsalan, 2013). We
implemented this algorithm, but without employing
the proposed shadow detection technique, in order to
perform a fair comparison of the algorithms, avoiding
any restrictions on the height of detected buildings.
Another building detection algorithm was devel-
oped by fusing Harris, FAST, GMSR and Gabor fil-
tering local features (Sirmacek and Unsalan, 2011).
The authors perceived these features as observations
of building presence, estimated the probability den-
sity function (pdf) of these features and identified the
modes this pdf as possible buildings. In this case, we
consider as true positive, the case where there is at
least one pixel labeled as building inside a rectangle
of size 11× 11 pixels around each computed building
location.
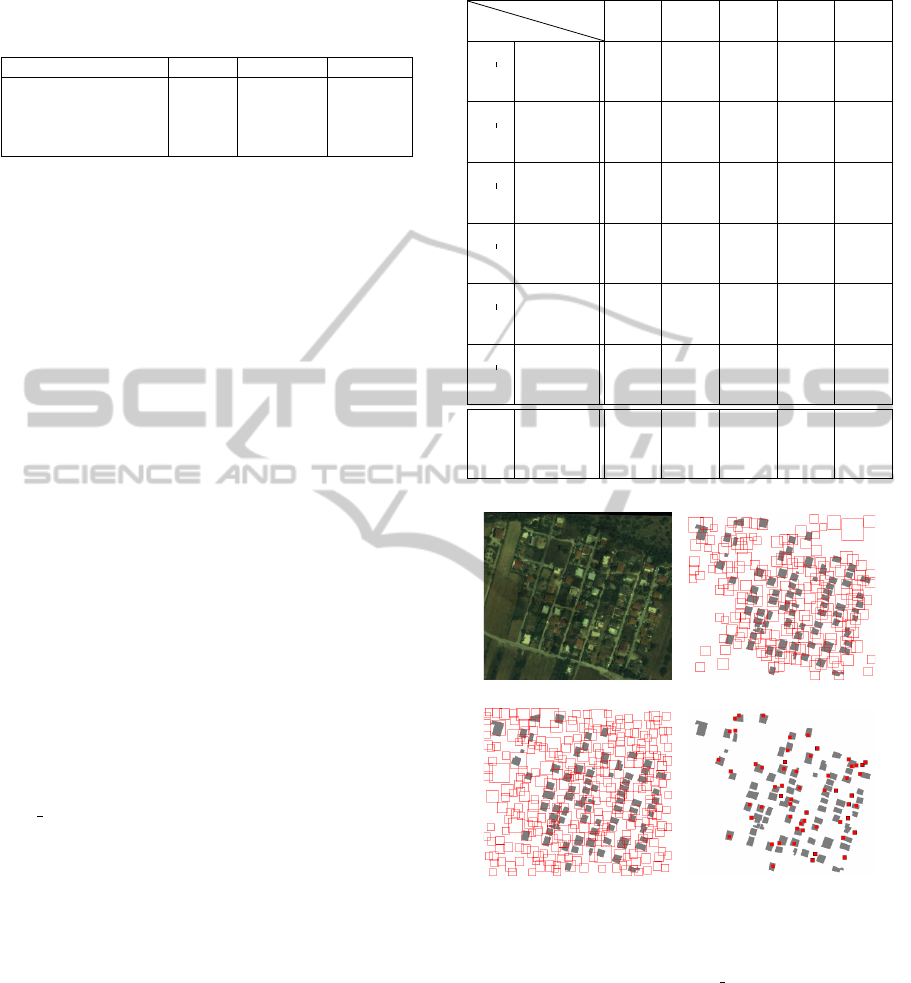
The results of the different methodologies on our
test set are presented in table 2. All values refer to the
metric of F1-score, unless otherwise stated. The best
results for each image are shown in bold. A visual
comparison of the three algorithms in a part of image
(area 1b,2006) of our test set is presented in figure 4.
5 CONCLUSIONS
A novel methodology for building detection was pre-
sented based on the probabilistic fusion of HOG,
NDVI and FAST features. Some conclusions can be
drawn by analyzing the experimental results obtained.
The introduction of both NDVI and FAST features
leads to better results than the use of only the HOG
features. By adding these features, we manage to sig-
nificantly reduce the false alarm rate of our method,
while keeping the detected buildings unaffected.
Furthermore, although the training set of the HOG
part of our algorithm consists of just QuickBird im-
ages, the performance of the algorithm on the World-
View 2 test images is comparable to the performance
Table 2: Comparison of the algorithms on the test images.
Area
Year
2006 2007 2009 2010 2011
area 1a
Proposed 0.645 0.701 0.64 0.681 0.665
Ilsever 0.216 0.218 0.228 0.2 0.22
Sirmacek 0.421 0.568 0.389 0.509 0.395
area 1b
Proposed 0.677 0.789 0.731 0.723
Ilsever 0.389 0.416 — 0.392 0.399
Sirmacek 0.509 0.506 0.487 0.443
area 1c
Proposed 0.757 0.791 0.819 0.823 0.804
Ilsever 0.522 0.547 0.54 0.498 0.545
Sirmacek 0.52 0.442 0.311 0.345 0.317
area 2a
Proposed 0.606 0.754 0.699 0.689 0.709
Ilsever 0.277 0.322 0.309 0.282 0.276
Sirmacek 0.526 0.59 0.376 0.166 0.075
area 2b
Proposed 0.575 0.637 0.674 0.6 0.663
Ilsever 0.187 0.223 0.203 0.188 0.19
Sirmacek 0.367 0.428 0.323 0.427 0.308
area 2c
Proposed 0.616 0.73 0.706 0.676 0.692
Ilsever 0.249 0.29 0.274 0.247 0.229
Sirmacek 0.383 0.489 0.46 0.495 0.403
Total F-
score
Proposed 0.705
Total
Recall
0.85
Total
Precision
0.602
Ilsever 0.303 0.954 0.18
Sirmacek 0.416 0.286 0.762
(a) (b)
(c) (d)
Figure 4: Detections shown in red from our method (b), (Il-
sever and Unsalan, 2013)’s method (c) and (Sirmacek and
Unsalan, 2011)’s method (d) overlaid on ground truth build-
ing locations of part of image (area 1b, 2006) (a).
on the QuickBird images. This fact shows that a HOG
algorithm is quite robust to images taken from differ-
ent satellites, making it a powerful tool for a more
general satellite image processing technique.
Compared to the other algorithms, our methodol-
ogy manages to significantly outperform them on all
the test images with respect to the F1-score. The al-
gorithm of Ilsever et al. identifies more buildings but
the false alarm rate is too high. On the other hand,
AProbabilisticFeatureFusionforBuildingDetectioninSatelliteImages
211

the feature fusion of Sirmacek et al. achieves a really
high precision but it cannot detect many buildings in
the test set. Finally, a comparison of the two HOG
implementations reveals the importance of a correct
parameter configuration for the task at hand.
ACKNOWLEDGEMENTS
We would like to thank Dr. Beril Sirmacek for provid-
ing her code for our evaluation results. This research
has been co-financed by the European Union (Eu-
ropean Social Fund-ESF) and Greek national funds
through the Operational Program ”Education and
Lifelong Learning” of the National Strategic Ref-
erence Framework (NSRF)-Research Funding Pro-
gram: THALIS-NTUA-UrbanMonitor.
REFERENCES
Benarchid, O., Raissouni, N., Adib, S., Abbous, A., Azyat,
A., Achhab, N., Lahraoua, M., and Chahboun, A.
(2013). Building extraction using object-based classi-
fication and shadow information in very high resolu-
tion multispectral images, a case study: Tetuan, Mo-
rocco. Canadian Journal on Image Processing and
Computer Vision, 4(1).
Caselles, V., Kimmel, R., and Sapiro, G. (1995). Geodesic
active contours. In Proceedings of 5th International
Conference on Computer Vision, pages 694–699.
Chai, D., F
¨
orstner, W., and Ying Yang, M. (2012). Combine
markov random fields and marked point processes to
extract building from remotely sensed images. In IS-
PRS Annals of the Photogrammetry, Remote Sensing
and Spatial Information Sciences , pages 1219–1222.
Dalal, N. (2006). Finding People in Images and Videos.
PhD thesis, National Polytechnique de Grenoble.
Dalal, N. and Triggs, B. (2005). Histograms of oriented gra-
dients for human detection. In IEEE Computer Society
Conference on Computer Vision and Pattern Recogni-
tion (CVPR) , volume 1, pages 886–893.
Di Zenzo, S. (1986). A note on the gradient of a multi-
image. Computer Vision Graphics and Image Pro-
cessing, 33(1):116–125.
Hallada, W. and Cox, S. (1983). Image sharpening for
mixed spatial and spectral resolution satellite systems.
International Symposium on Remote Sensing of Envi-
ronment, 3:1023–1032.
Haverkamp, D. (2004). Automatic building extraction from
ikonos imagery. In Proceedings of ASPRS.
Hu, J., You, S., Neumann, U., and Park, K. (2004). Building
modeling from lidar and aerial imagery. In Proceed-
ings of ASPRS.
Ilsever, M. and Unsalan, C. (2013). Building detection us-
ing hog descriptors. In 6th International Conference
on Recent Advances in Space Technologies (RAST),
pages 115–119.
Karantzalos, K. and Argialas, D. (2009). A region-
based level set segmentation for automatic detection
of man-made objects from aerial and satellite images.
Photogrammetric Engineering and Remote Sensing,
75(6):667–677.
Karantzalos, K. and Paragios, N. (2010). Large-scale build-
ing reconstruction through information fusion and 3-d
priors. IEEE Transactions on Geoscience and Remote
Sensing, 48(5):2283–2296.
Kluckner, S. and Bischof, H. (2010). Image-based building
classification and 3d modeling with super-pixels. In
Proceedings of International Society for Photogram-
metry and Remote Sensing, Photogrammetric Com-
puter Vision and Image Analysis.
Li, Q., Mitianoudis, N., and Stathaki, T. (2007). Spa-
tial kernel k-harmonic means clustering for multi-
spectral image segmentation. Image Processing, IET,
1(2):156–167.
Platt, J. (1999). Probabilistic outputs for support vector
machines and comparisons to regularized likelihood
methods. In Advances in Large Margin Classifiers,
pages 61–74. MIT Press.
Rosten, E. and Drummond, T. (2006). Machine learning for
high-speed corner detection. In European Conference
on Computer Vision, pages 430–443.
Shackelford, A. and Davis, C. (2003). A combined fuzzy
pixel-based and object-based approach for classifica-
tion of high-resolution multispectral data over urban
areas. IEEE Transactions on Geoscience and Remote
Sensing, 41(10):2354–2363.
Singh, D., Maurya, R., Shukla, A., Sharma, M., and Gupta,
P. R. (2012). Building extraction from very high reso-
lution multispectral images using ndvi based segmen-
tation and morphological operators. In Students Con-
ference on Engineering and Systems (SCES), pages 1-
5.
Sirmacek, B. and Unsalan, C. (2011). A probabilistic
framework to detect buildings in aerial and satellite
images. IEEE Transactions on Geoscience and Re-
mote Sensing, 49(1):211–221.
Theng, L. (2006). Automatic building extraction from satel-
lite imagery. Engineering Letters, 13(3).
Verma, V., Kumar, R., and Hsu, S. (2006). 3d build-
ing detection and modeling from aerial lidar data.
In IEEE Computer Society Conference on Computer
Vision and Pattern Recognition (CVPR), volume 2,
pages 2213–2220.
Vinson, S., Cohen, L., and Perlant, F. (2001). Extraction
of rectangular buildings in aerial images. In Proceed-
ings of Scandinavian Conference on Image Analysis
(SCIA).
Vrabel, J. (2000). Multispectral imagery advanced band
sharpening study. Photogrammetric Engineering and
Remote Sensing, 66(1):73–79.
Woo, D., Nguyen, Q., Nguyen Tran, Q., Park, D., and Jung,
Y. (2008). Building detection and reconstruction from
aerial images. In ISPRS Congress, Beijing.
VISAPP2015-InternationalConferenceonComputerVisionTheoryandApplications
212
