
Improved Representation of Dependencies in Feature-based
Parametric CAD Models using Acyclic Digraphs
Jorge D. Camba
1
and Manuel Contero
2
1
Dwight Look College of Engineering, Texas A&M University, College Station, TX, U.S.A.
2
I3BH, Universitat Politècnica de València, València, Spain
Keywords: Parametric CAD Modeling, Graph Theory, 3D Model Visualization, Mechanical Design.
Abstract: In an engineering design context, the process of modeling complex 3D parts with feature-based parametric
software systems often produces a large number of dependencies between geometric features that are
difficult to manage. The resulting network of feature interdependencies can be understood as an alternative
representation of the CAD model that can help identify the most important aspects of the geometry, its
critical features, and understand the overall complexity and interconnectedness of the model. Being able to
visualize and process this information efficiently can significantly enhance design activities and facilitate
model reuse, which can ultimately lead to cost and time savings, and better quality models. In this paper, we
identify some of the simplifications and elements that are overlooked by current representation techniques
and describe the negative consequences of not taking these elements into consideration. We describe a new
method and a software solution to generate a simplified, intuitive, and more accurate visualization of a
parametric model as an acyclic digraph. Finally, to validate our approach, the proposed representation is
compared to existing techniques using a group of CAD models.
1 INTRODUCTION
Over the years, feature-based parametric Computer-
Aided Design (CAD) technology has steadily
progressed to become a mature and commonly
deployed technology for the creation of 3D CAD
models and assemblies. In a parametric model, a
series of variable parameters and geometric relations
control the geometry of the object so it can be
modified easily to create different design variants.
These elements can be defined by dimensional,
geometric, and algebraic constraints (Shah, 1991).
Feature-based parametric modeling systems rely
on data structures that maintain geometric
information of specific aspects of the model
(features) in an associative manner, specifically in
the form of parent/child relationships. Therefore, all
individual features in the CAD model are connected
hierarchically, creating a network structure where
every node represents a feature and every connection
represents a dependency between two features
(Hanratty, 1995). This structure is commonly known
as design tree, feature tree, or history tree.
Because of the adaptable nature of the design
tree, parametric 3D CAD systems allow the
incorporation of design semantics to the model,
which facilitates the modification of the geometry by
simply changing the values of the parameters and
dependencies. In this regard, a parametric model can
be considered an intelligent representation of a part.
When dependencies are properly defined,
alterations to a parent node will automatically
propagate downstream to all its child nodes and the
CAD model will adjust and react to changes in a
predictable manner (Bodein, Rose, and Caillaud,
2014). Therefore, from a designer’s perspective, it is
important to plan the modeling procedure
beforehand to determine the most efficient sequence
of features, as poor modeling strategies often result
in parts that take longer to create and are more
difficult or impossible to modify (Hartman, 2005).
Unfortunately, parent/child interdependencies are
also the root of many regeneration problems in
parametric modeling. As the size and complexity of
a parametric model grows, so do the number of
dependencies and the degree of interconnectedness
of its design tree, which can severely impact
maintainability and model reuse (Salehi and
McMahon, 2009).
16
Camba J. and Contero M..
Improved Representation of Dependencies in Feature-based Parametric CAD Models using Acyclic Digraphs.
DOI: 10.5220/0005261500160025
In Proceedings of the 10th International Conference on Computer Graphics Theory and Applications (GRAPP-2015), pages 16-25
ISBN: 978-989-758-087-1
Copyright
c
2015 SCITEPRESS (Science and Technology Publications, Lda.)

From a user’s standpoint, modeling complex
parts requires using and managing large amounts of
parametric information and dependencies efficiently,
which can be overwhelming and confusing, even for
the most experienced designers (Baxter et al., 2007;
Mohammed, May, and Alavi, 2008). For this reason,
many design firms claim they have difficulties
visualizing parametric information, which often has
a negative impact on the documentation of design
knowledge (Myung and Han, 2001).
Although some tools have been developed to
improve the visualization of a CAD model structure
(some of which will be discussed in the next
section), there are currently no tools that can
automatically generate a simple and intuitive
representation of all the dependencies in a
parametric model for visualization and
documentation purposes (Marchenko et al., 2011). In
fact, most commercial CAD tools only provide tree
views to navigate the model features in a linear
manner, which often hinders the understanding of
complex relations. Furthermore, the simplifications
and assumptions made by these representations are
frequently inaccurate and ambiguous, making them
impractical and unreliable in production
environments.
In this paper, the problems with current
representations of parametric model structures are
identified and discussed. An improved
representation method based on directed acyclic
graphs (DAG) is proposed that eliminates ambiguity
and simplifies inherited dependencies between
features at multiple levels. Additionally, a prototype
of our method is presented along with examples of
achieved results.
2 RELEVANT LITERATURE
A general description of the hierarchical structure of
a parametric CAD model was provided by
(Marchenko et al., 2011). According to the authors,
a parametric model can be understood as a mono-
hierarchical, tree-like structure consisting of general
assemblies, subassemblies, parts, features,
dependencies, and parameters, where all elements
stand in relation to exactly one parent.
If individual CAD elements are isolated and
studied independently, additional dependencies can
be added on separate hierarchical layers, resulting in
a directed acyclic graph structure, also called poly-
hierarchy, in which multiple parents are possible for
any given node. Consequently, a more complex
network structure is produced (Marchenko et al.,
2011).
Visualizing the CAD model structure is
problematic, particularly for complex models.
Efforts include the use of modeling languages such
as UML (Wang and Li, 2012) and SysML (Peak et
al., 2007; Wölkl and Shea, 2009) to help designers
define structures that can be implemented in a CAD
model, or the application of entity-relationship
diagrams borrowed from database technologies
(Zhou, 2011). These methods, however, were
developed to describe models during the early stages
of the design process, not as tools to generate
visualizations of existing structures.
The standard method to visualize the model
structure implemented by most commercial systems
such as SolidWorks®, Catia®, or PTC Creo®, is the
design tree (see Figure 1).
Figure 1: Sample design tree in SolidWorks®.
The design tree is not a tool itself, but a
chronological representation of all the steps and
operations performed to create a specific model. As
new features are created, they are sequentially
inserted at the bottom of the model’s design tree.
The design tree allows the user to go back to any
specific point in the design and edit a particular
feature or sketch. Nevertheless, it is difficult to
visualize and analyze feature interdependencies.
Although CAD packages allow designers to select
node from the design tree and query their
dependencies (the result is typically two lists of
nodes with parent and child features), an overall
view of the model’s structure is often not available.
Various methods for modeling dependencies in
engineering processes have been applied to the
visualization of parametric models. For example,
feature dependencies can be represented as design
structure matrices. A Design Structure Matrix, or
Dependency Structure Matrix, (DSM), is a method
originally introduced by Steward (1981) for
representing and analyzing interdependencies
between elements and has become a common
modeling tool in a variety of application areas
(Eppinger, 1991).
ImprovedRepresentationofDependenciesinFeature-basedParametricCADModelsusingAcyclicDigraphs
17
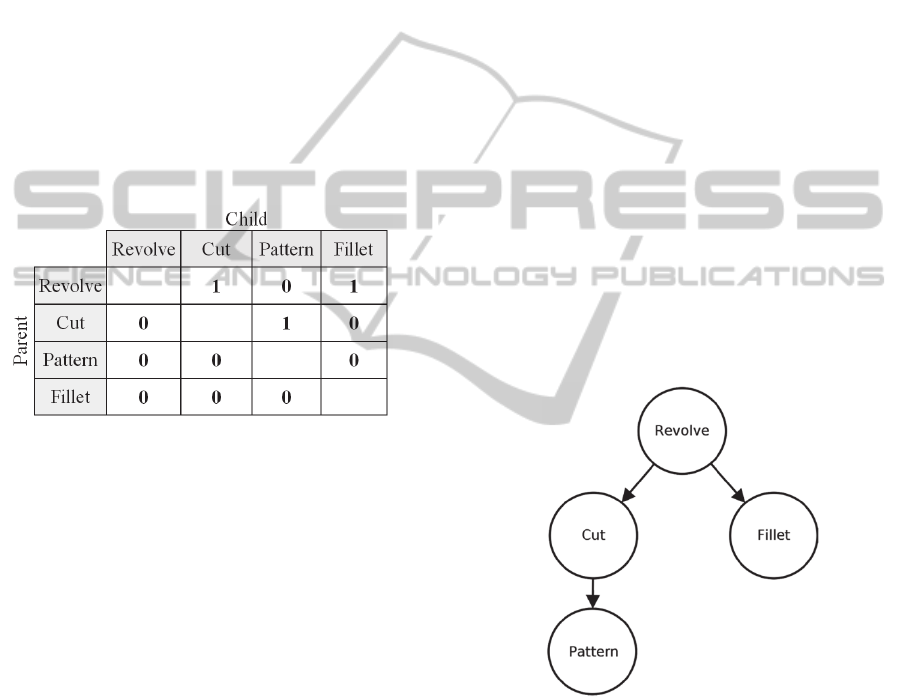
A DSM is a square matrix (i.e., it has an equal
number of rows and columns) that shows
relationships between elements in a system. In the
context of parametric models, a binary matrix is
used because it can represent the presence or
absence of a relationship between pairs of features in
a model. This matrix is described as follows:
Features of the model are placed down the left
side of the matrix as row headings and across
the top as column headings in the same order.
If there exists a parent-child relation from
node i to node j, then the value of element i,j
(row i, column j) is 1. Otherwise, the value of
the element is zero.
The diagonal elements of the matrix do not have
any interpretation in describing the system, so they
are usually either left empty or blacked out. An
example of a DSM is shown in Figure 2.
Figure 2: DSM showing model dependencies.
Authors Tang et al. (2010) used DSM structures to
capture and reuse past design knowledge.
Specifically, they use DSM to record information
such as interaction levels and design parameters.
Researchers Lai and Gershenson (2008) applied
DSM techniques based on design features to the
representation of dependencies for assembly
modularity. Karniel, Belsky, and Reich (2005) used
DSM to decompose complex 3D-surface fitting
reengineering problems from geometry constraints.
In terms of CAD model visualization, Bhaskara
(2011) suggested a novel approach to analyze and
restructure complex CAD models using DSM
techniques. In his work, once all the dependencies
were identified and represented as a DSM, he
applied partitioning and clustering algorithms to
restructure and optimize the final matrix (and, thus,
the original model structure). For instance, heavily
used features and their closely related dependencies
were automatically moved to the bottom of the
DSM, and closely connected features were grouped
together to form clusters. For his study, he
developed the DSMs manually, but he recognized
the need for software systems that can automatically
generate accurate DSMs for large and complex CAD
models. He also acknowledged the need to represent
dependencies from auxiliary features and sketches
(Bhaskara, 2011).
A more visual, intuitive, and common method to
represent dependencies in parametric models is
provided by graph-based tools. Generally speaking,
a graph G can be defined as a pair G = (V, E) where
V is a set of nodes (or vertices) and E, the links (or
edges) between two connected nodes. When the
edges have a direction associated with them, then the
graph is called a directed graph, or digraph.
Graphs have been used to model a variety of
problems in many disciplines such as mathematics
(Bondy and Murty, 1976), engineering and computer
science (Deo, 2004), and economics (Michael and
Battiston, 2009). In the context of parametric CAD,
models can be understood as directed graph
structures where every feature is represented as a
node, and every parent-child relation is represented
with a directed edge from the parent to the child
node, as shown in Figure 3. Furthermore, because
the nature of parent-child relations prevents the
appearance of directed cycles of loops in the
structure, the directed graph is always acyclic.
Figure 3: Directed graph showing model dependencies.
Graph-based tools have been used to define the
relationships and dependencies among the geometric
features of parts in mechanical assemblies (Srikanth
and Turner, 1990) and more recently, to check
tolerance specifications assigned to a CAD model
(Franciosa, Patalano, and Riviere, 2010).
Researchers Marchenko et al. (2011) proposed a
method that uses graphs to visualize and document
parametric information of 3D CAD models. Their
system is limited to assemblies in the area of sheet
metal forming tools, although the authors claim that
GRAPP2015-InternationalConferenceonComputerGraphicsTheoryandApplications
18

their visualizations and tools can be generalized for
design tasks in other branches.
More recently, Patalano, Vitolo, and Lanzotti
(2013) presented a software tool that uses graph
theory to generate the geometric modeling of
mechanical assemblies. Similarly to the previous
authors, Patalano, Vitolo, and Lanzotti (2013) also
limited their study to assemblies and did not
consider the representation of individual parts.
Graphs are also used by Owensby and Summers
(2014) to estimate assembly times of products. In
their work, the authors generate the connectivity
graph of an assembly from assembly constraint
information and analyze the structural complexity of
the graph using a variety of metrics. Once again,
only assemblies are considered.
Some high-end commercial CAD packages such
as Catia® and UG-NX® provide tools to explore the
structure of CAD models and the links between
assembled parts in the form of graphs (Tickoo,
2014).
In the next section, some of the visualization
problems with current representation tools are
discussed, focusing on the ambiguity of the
representations when certain simplifications are
made.
3 PROBLEMS WITH CURRENT
GRAPH-BASED
VISUALIZATION METHODS
Some of the problems with current graph
visualization techniques in the area of parametric
modeling were identified by Marchenko et al.
(2011). The problems described by the authors,
however, are mainly concerned with the
descriptiveness, readability, and clarity of the graph,
i.e., the challenges that need to be overcome to make
the graph representation more expressive and
understandable. The problems they identified as well
as some of their recommendations can be
summarized as the following:
In many models, especially those with a large
number of relations, some dependencies
cannot be drawn without intersections, which
can result in a confusing visualization. Objects
and lines in the graph should be drawn
without overlapping.
In large graphs, it is often difficult to track
down the hierarchy of individual CAD
elements, particularly if the graph is not
clearly organized by levels. Connections
should be easy to follow, with minimum
crossings and bends.
The designation of certain parameters is not
unique. In some cases, to reduce the number
of intersections, some graph representations
show the same feature as multiple nodes.
The representation of specific input and output
parameters related to a dependency is not
shown, which hinders the tracking of
information flows. In fact, these specific
elements cannot be efficiently displayed by a
static visualization, as the large number of
dependencies would overwhelm the viewer.
Instead, an interactive approach is needed to
control the number of elements that are
displayed at any given time.
There is a lack of standardization in terms of
the graphical language (icons) used to
represent individual CAD elements, which can
be confusing due to the abundance of CAD
elements and the variety of CAD systems.
Although the previous recommendations can
certainly improve the graph representation of the
parametric CAD model, they do not consider some
of the specific relations that may result in ambiguous
representations or incorrect graphs. In the following
subsections, two of these specific problems are
described.
3.1 Multi-level Relations
An ambiguous graph can be generated if multi-level
relations (grandparent-parent-child) are ignored,
simplified, or not carefully analyzed. As part of this
research, the authors of this paper evaluated this
situation using two popular parametric modeling
packages, SolidWorks® and Autodesk Inventor®.
To illustrate the problem, two versions (A and B)
of a CAD model were used. Both versions are
identical in terms of geometry, but different in terms
of the parameters used to control the features. The
geometry of the models is shown in Figure 4.
The two models differ slightly in the way step 6
(“cut hole”) was performed. This 3D operation takes
the two-dimensional profile of the circle as input and
removes material up to a specified depth, which can
be parameterized. Since the design of the part
requires the hole to pierce through the top horizontal
block, which is 0.5” thick, the depth of the hole must
also be 0.5” deep.
In version A of the model, the depth of the cut
operation was indicated as a fixed value of 0.5”
which goes through the entire top block. In version
B, however, the depth of the cut was indicated by
ImprovedRepresentationofDependenciesinFeature-basedParametricCADModelsusingAcyclicDigraphs
19
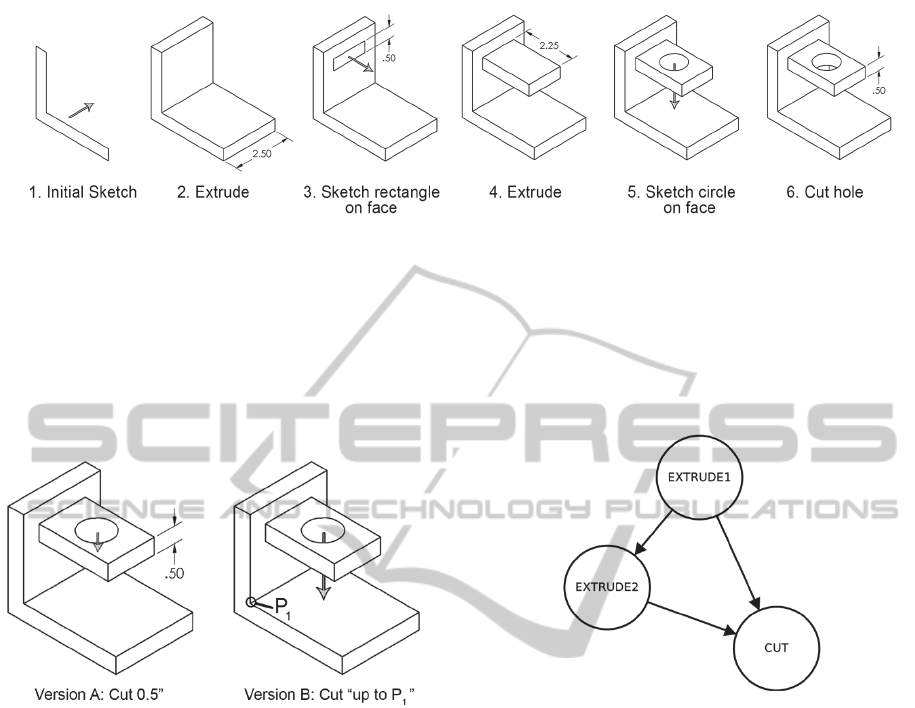
Figure 4. Modeling steps to create sample part.
using an existing point as a reference (one of the
corners on the base block). This way, if the thickness
of the horizontal block needs to be increased, the
depth of the cut does not have to be manually
adjusted. The two approaches are shown in Figure 5.
Both of them will successfully perform the cut and
deliver the desired result.
Figure 5. Versions of CAD model based on different
parameters for the depth of the cut.
When asked to display the feature dependencies for
both models, the CAD packages return the exact
same information. The dependency graph for both
versions of the model is shown in Figure 6. The
node “Extrude1” represents the first extrusion of the
original sketch (step 2), node “Extrude2” represents
the extrusion of the horizontal block (step 4), and
node “Cut” represents the circular hole (step 6).
The dependency between the first node
(“Extrude1”) and the third (“Cut”) is problematic.
Even though the dependency is displayed in the
graph in both versions of the model, its meaning
differs greatly.
In the first case (version A), the link between
“Extrude1” and “Cut” represents an inherited
dependency. “Cut” depends on “Extrude2” and
“Extrude2” depends on “Extrude1”, therefore “Cut”
depends on “Extrude 1.” In other words, “Extrude1”
is the grandparent node of “Cut.” This relation
indicates that the node “Cut” will be affected by
changes in either “Extrude1” or “Extrude2.”
In the second case (version B), the same link
represents a direct dependency between “Extrude1”
and “Cut.” The geometry of the cut is partially
dictated by a geometric element (point P
1
) that
belongs to the feature “Extrude1.”
Figure 6: Dependency graph for both versions of the CAD
model according to the parent/child relationships
displayed by SolidWorks®.
This inherited dependency occurs naturally in single
body parts as a by-product of the Boolean operations
that are performed internally to manipulate
geometric bodies. As new features are created and
added to the model, they are automatically merged
or combined with existing features to create one
single block of geometry. As a result, all new
features will depend, one way or another, on
previous geometry. However, from a practical
modeling standpoint, these dependencies do not add
value to the visualization. The fact that all features
are merged together in one single body implies that
these types of dependencies exist and that the chain
of dependencies always flows from the feature that
is created first to the feature that is created last.
To illustrate the situations discussed earlier, we
can analyze how the two models react to changes
when the geometry is modified by adding a new
feature (a third extrusion that passes through point
P
1
) before the hole is cut. While version A will
GRAPP2015-InternationalConferenceonComputerGraphicsTheoryandApplications
20
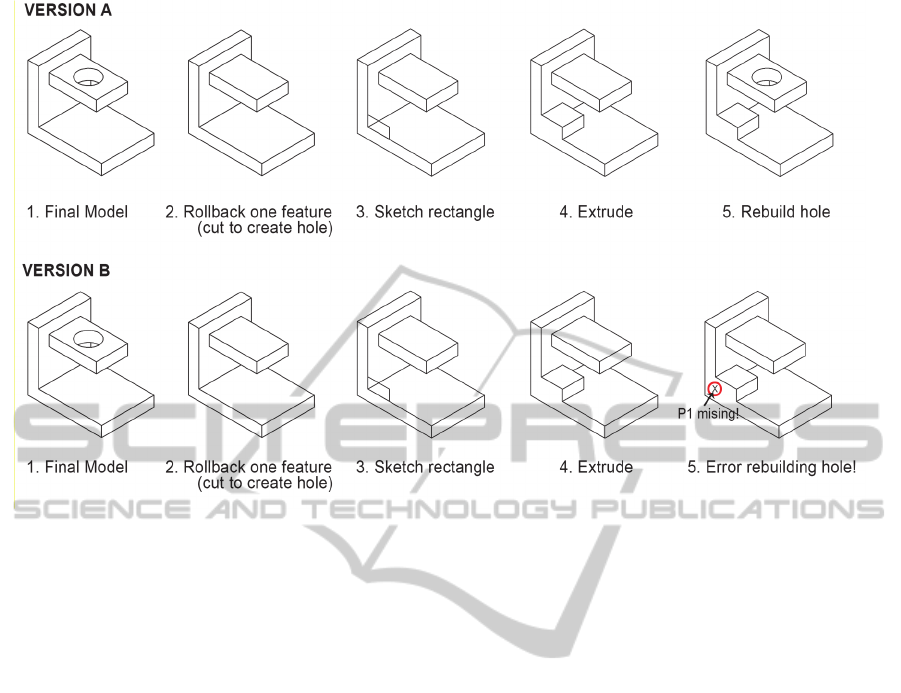
Figure 7: Model behavior after geometry modifications.
update correctly, version B will return a rebuild error
because point P
1
will no longer available after the
third extrusion is created. The sequences of changes
are shown in Figure 7.
This example demonstrates how current graph-
based representation methods for parametric models,
even those implemented by commercial systems, are
imprecise when dealing with multi-level or inherited
dependencies in single body parts. When such
relations are displayed, the resulting graph becomes
ambiguous, as it allows for multiple interpretations,
each of which represents a different CAD model.
As a solution to this problem, we suggest
labelling or marking the inherited dependencies, or
using a different color, line type, or symbol for the
connector. In certain cases, inherited dependencies
can even be eliminated, especially in multi-level
relations (such as great-grandparent, grandparent,
parent, child) that involve single-body parts with
features that already share a different type of
dependency. These simplifications can significantly
reduce the visual complexity of the graph and help
users easily determine the most relevant parametric
constraints. This statement reinforces the position of
authors Marchenko et al. (2011), whose research
pointed out the problem of visually overwhelming
users with unnecessary dependencies.
3.2 The Role of Sketches
Although certain 3D features do not require the use
of two-dimensional sketches (fillets and chamfers,
for example, only consume existing 3D edges, and
mirror creates a symmetrical copy of a set of
features about a face or a plane), most 3D operations
that are used to define the building blocks of a
feature-based parametric 3D model require prior
definition of one or more sketches as input to
generate the desired volume. From a purely
functional point of view, however, the vast majority
of 2D sketches are used only once (and almost
exclusively by one feature). Only occasionally are
sketches shared among multiple features to define
different geometric elements (a situation that
translates into a graph with one parent sketch node
and multiple child feature nodes) or used as
connecting nodes of a sketch-to-sketch dependency
(which is represented as a parent sketch node with a
child sketch node).
In this regard, most sketches are shown as
intermediate elements in the dependency graph
linking two feature nodes, which results in an extra
level of connectors that add unnecessary clutter to
the graph but no added value in terms of
visualization of the parametric relations. To simplify
the overall graph, these sketch nodes can be
represented with distinctive styles or even
eliminated from the graph.
ImprovedRepresentationofDependenciesinFeature-basedParametricCADModelsusingAcyclicDigraphs
21
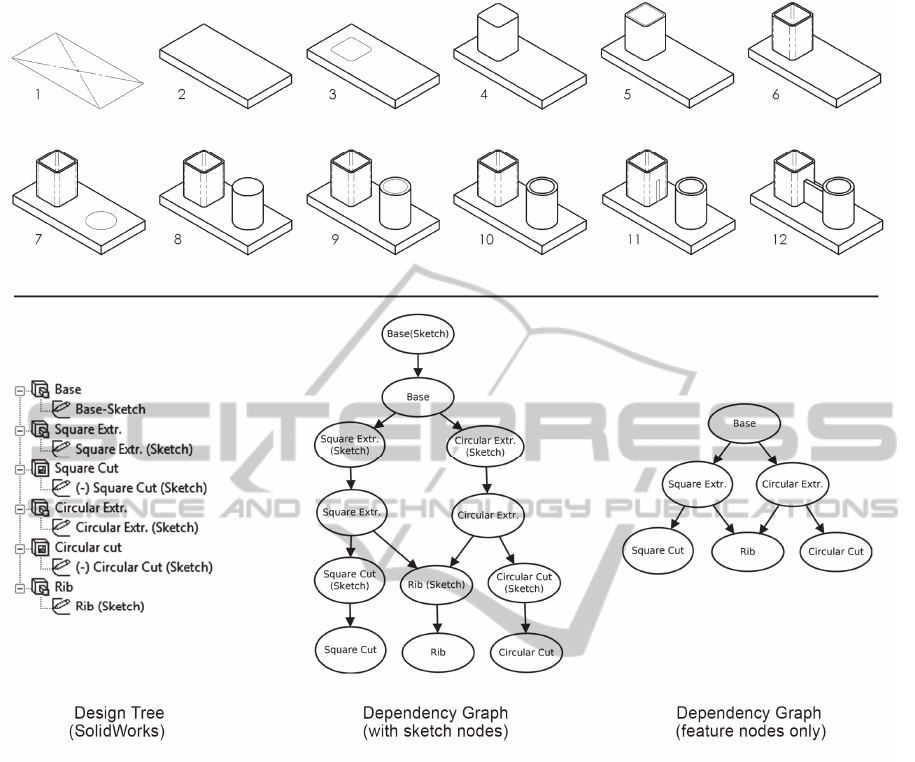
Figure 8: Modeling steps (top) and three visualizations of the model structure (bottom). The classic design tree
representation (bottom left) does not provide information on interdependencies. Notice the reduction of nodes in the
simplified graph (bottom right) when compared to the full graph (middle) when connecting sketches in single body parts are
not shown.
An example of a CAD model (displayed as the
sequence of sketching and modeling steps require to
build the geometry) along with its corresponding full
graph (including all sketch nodes) and the simplified
version of the graph according to the criteria
discussed in this section are shown in Figure 8.
4 IMPROVED GRAPH
VISUALIZATION
Based on the discussion from previous sections, we
propose a simplified representation of a dependency
graph for parametric CAD models that is more
readable, less cluttered, and reduces ambiguity. Our
representation is built by reducing the number of
nodes in the graph according to the following
criteria:
Connecting sketches used to create a feature
that will be merged with previous geometry do
not provide value to the user in terms of
visualizing and understanding the graph
complexity. Therefore, sketch nodes are not
displayed, unless they are explicitly used as
part of a constraint. Connecting sketch nodes
can be identified easily as sketch elements
with only one child node (the 3D feature they
generate).
Inherited dependencies are not displayed.
Multi-level relations (grandparent-parent-
child) are only displayed if there is a specific
GRAPP2015-InternationalConferenceonComputerGraphicsTheoryandApplications
22
constraint that relates the grandparent node to
the child node. Otherwise, the dependencies
can be implied and therefore, there is no need
to make them visible.
The pseudo code for a simplification algorithm
to reduce the node and dependency count in the
model graph can be written as:
TraverseModel()
For each node n
{
If n is a Sketch and has
only one child node then
{
//Reconnect dependencies
For each Parent(n)
Reconnect to Child(n);
Remove(n);
}
Else If n is a Feature then
{
For each Child(n)
Check constraints;
If there is only one
constraint and constraint is
‘Merge geometry’ then
//multi-level
delete dependency;
}
}
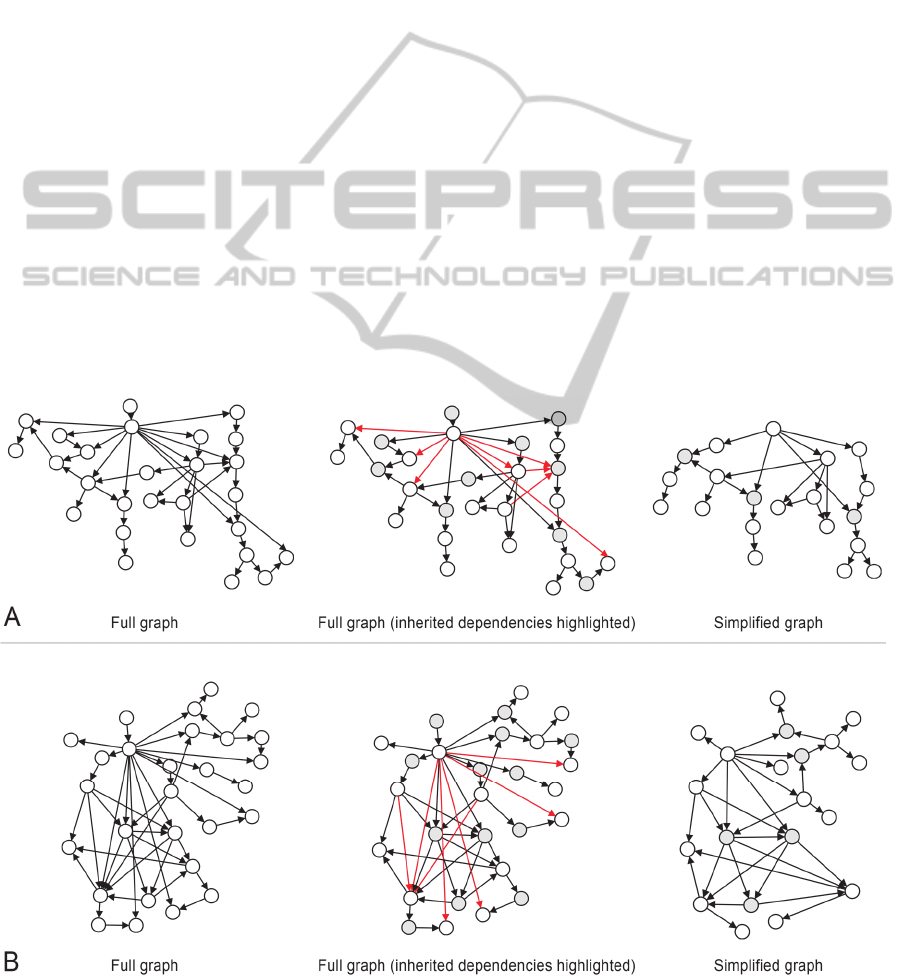
Using two CAD models, a side-by-side
comparison of the full graph and our simplified
version of the graph according to the criteria
discussed in this paper is provided in Figure 9. Node
names have been omitted for clarity.
5 CONCLUSIONS
The constant need for tools and methods to support
design activities and reuse increasingly complex
CAD models naturally demands the development of
efficient visualization systems to manage parametric
model geometry.
In this paper, we have reviewed some of the most
common representation and visualization methods
for parametric 3D CAD models, particularly
focusing on dependency graphs. Our work describes
a series of problems with current graph
representation techniques and analyzes the
consequences of certain dependencies and CAD
elements, and the effects of representing relations
that have not been rigorously examined. In both
cases, a considerable level of ambiguity is
introduced to the graph, resulting in an imprecise or
cluttered representation of the model.
Figure 9: Comparison of the full graph and simplified version for two CAD models (A and B). Node names have been
omitted for clarity.
ImprovedRepresentationofDependenciesinFeature-basedParametricCADModelsusingAcyclicDigraphs
23

We have proposed a simplified representation of
the dependency graph by eliminating sketch nodes
that do not add value to the overall visualization and
only showing the multilevel dependencies
(grandparent-child) that are explicitly defined by
geometric and dimensional constraints. The result is
a clearer and more intuitive representation of the
internal structure of the parametric model. While the
system need to be tested on a large, "real-world"
example with a more extensive group of models, in
many cases the number of nodes can be reduced by
at least half, which contributes to a more effective
visualization.
Although the algorithm presented in this paper
was implemented as an add-in for the CAD package
SolidWorks, further developments are planned for
the near future. At the present time, the software
prototype can extract model information and export
it to a graph structure (which is visualized by an
external application), but a complete interactive
solution that is fully integrated within the CAD
environment would be beneficial. In addition, the
simplified model representation can be analyzed,
restructured, and optimized by applying clustering
and partitioning algorithms, which have the potential
to make models more flexible and reusable.
Furthermore, comparative studies of the graph
structures can be performed and assessed using
complexity metrics.
ACKNOWLEDGEMENTS
The Spanish Ministry of Economy and
Competitiveness and the FEDER Funds, through the
ANNOTA project (Ref. TIN2013-46036-C3-1-R)
supported this work.
REFERENCES
Baxter, D, Gao, J, Case, K., Harding, J, Young, B,
Cochrane, S & Dani, S, 2007. An engineering design
knowledge reuse methodology using process
modelling. Research in engineering design, vol. 18,
no. 1, pp. 37-48.
Bhaskara, S, 2011. Analysis and Visualization of Complex
Computer Aided Design Models as a Design Structure
Matrix. Proceedings of the 13th International DSM
Conference. Cambridge, MA, USA.
Bodein, Y, Rose, B & Caillaud, E, 2014. Explicit
Reference Modeling Methodology in Parametric CAD
System. Computers in Industry, vol. 65, no. 1, pp.
136-147.
Bondy, JA & Murty, USR, 1976. Graph theory with
applications. Vol. 6. Macmillan, London.
Deo, N, 2004. Graph theory with applications to
engineering and computer science, PHI Learning.
New Delphi.
Eppinger SD, 1991. Model-based approaches to managing
concurrent engineering. Journal of Engineering
Design, vol. 2, pp. 283–290.
Franciosa, P, Patalano, S & Riviere, A, 2010. 3D tolerance
specification: an approach for the analysis of the
global consistency based on graphs. International
Journal on Interactive Design and Manufacturing,
vol. 4, no. 1, pp. 1-10.
Hanratty, PJ, 1995. Parametric/relational solid modelling.
In D.E. LaCourse (Ed.), Handbook of solid modeling,
pp. 8.1-8.25. New York: McGraw-Hill.
Hartman, NW, 2005. Defining Expertise in the Use of
Constraint-Based CAD Tools by Examining Practicing
Professionals. Engineering Design Graphics Journal,
vol. 69, no. 1, pp. 6-15.
Karniel, A, Belsky, Y & Reich, Y, 2005. Decomposing the
problem of constrained surface fitting in reverse
engineering. Computer-Aided Design, vol. 37, no. 4,
pp. 399-417.
Lai, X & Gershenson, JK, 2008. Representation of
similarity and dependency for assembly modularity.
International Journal of Advanced Manufacturing
Technology, vol. 37, no. 7-8, pp. 803-827.
Marchenko, M, Behrens, BA, Wrobel, G, Scheffler, R &
Pleßow, M, 2011. A New Method of Visualization and
Documentation of Parametric Information of 3D CAD
Models. Computer-Aided Design and Applications,
vol. 8, no. 3, pp. 435-448.
Michael, DK & Battiston, S, 2009. From Graph Theory to
Models of Economic Networks. A Tutorial. Networks,
Topology and Dynamics, pp. 23-63. Springer Berlin
Heidelberg.
Mohammed, J, May, J & Alavi, A, 2008. Application of
Computer Aided Design (CAD) In Knowledge Based
Engineering. Proceedings of The 2008 IAJC-IJME
International Conference. Nashville, TN, USA.
Myung, S & Han, S, 2001. Knowledge-based parametric
design of mechanical products based on configuration
design method. Expert Systems with Applications, vol.
21, Elsevier Science Ltd., pp. 99-107.
Owensby, JE & Summers, JD, 2014. Assembly Time
Estimation: Assembly Mate Based Structural
Complexity Metric Predictive Modeling. Journal of
Computing and Information Science in Engineering,
vol. 14, no. 1, 011004.
Patalano, S, Vitolo, F & Lanzotti, A, 2013. A Graph-based
Software Tool for the CAD Modeling of Mechanical
Assemblies. International Conference on Computer
Graphics Theory and Applications GRAPP/IVAPP,
pp. 60-69. Barcelona, Spain.
Peak, RS, Burkhart, RM, Friedenthal, SA, Wilson, MW,
Bajaj, M & Kim, I, 2007. Simulation-Based Design
Using SysML Part 1: A Parametrics Primer. INCOSE
International Symposium. San Diego, California,
USA.
Salehi, V & McMahon, C, 2009. Action Research into the
GRAPP2015-InternationalConferenceonComputerGraphicsTheoryandApplications
24

Use of Parametric Associative CAD Systems in an
Industrial Context. DS 58-5: Proceedings of ICED 09,
the 17th International Conference on Engineering
Design, Vol. 5, Design Methods and Tools (pt. 1) 24.-
27.08, Palo Alto, CA, USA.
Shah, JJ, 1991. Assessment of Features Technology.
Computer-Aided Design, vol. 23, no. 5, pp. 331–343.
Srikanth, S & Turner, JU, 1990. Toward a unified
representation of mechanical assemblies. Engineering
with Computers, vol. 6, no. 2, pp. 103-112.
Steward, DV, 1981. The design structure system: A
method for managing the design of complex systems.
IEEE Transactions on Engineering Management, vol.
28, no. 3, pp. 71-74.
Tang, D, Zhu, R, Tang, J, Xu, R & He, R, 2010. Product
design knowledge management based on design
structure matrix. Advanced Engineering Informatics,
vol. 24, pp. 159-166.
Tickoo, S, 2014. NX9 for designers, CADCIM
Technologies.
Wang, Y & Li, J., 2012. UML Modeling and Parametric
Design for Cross Shaft Universal Coupling CAD
System. Journal of Software, vol. 7, no. 9, pp. 2069-
2075.
Wölkl, S & Shea, K, 2009. A Computational Product for
Conceptual Design Using SysML. Proceedings of the
ASME 2009 International Design Engineering
Technical Conferences & Computers and Information
in Engineering Conference (IDETC/CIE 2009),
DETC2009-87239, San Diego, California, USA.
Zhou, HL, 2011. Development of parametric CAD system
based on pro/toolkit and database technology. Applied
Mechanics and Materials, vol. 55, pp. 2235-2241.
ImprovedRepresentationofDependenciesinFeature-basedParametricCADModelsusingAcyclicDigraphs
25
