
On-line Hand Gesture Recognition to Control Digital TV
using a Boosted and Randomized Clustering Forest
Ken Yano, Takeshi Ogawa, Motoaki Kawanabe and Takayuki Suyama
Advanced Telecommunications Research Institute International, Seika-cho, Soraku-gun, Kyoto, Japan
Keywords:
Behavior Analysis, Gesture Recognition, Randomized Clustering Forests, Human Machine Interface.
Abstract:
Behavior recognition has been one of the hot topics in the field of computer vision and its application. The
popular appearance-based behavior classification methods often utilize sparse spatio-temporal features that
capture the salient features and then use a visual word dictionary to construct visual words. Visual word as-
signments based on K-means clustering are very effective and behave well for general behavior classification.
However, these pipelines often demand high computational power for the stages for low visual feature extrac-
tion and visual word assignment, and thus they are not suitable for real-time recognition tasks. To overcome
the inefficient processing of K-means and the nearest neighbor approach, an ensemble approach is used for fast
processing. For real-time recognition, an ensemble of random trees seems particularly suitable for visual dic-
tionaries owing to its simplicity, speed, and performance. In this paper, we focus on the real-time recognition
by utilizing a random clustering forest and verifying its effectiveness by classifying various hand gestures. In
addition, we proposed a boosted random clustering forest so that training time can be successfully shortened
with minimal negative impact on its recognition rate. For an application, we demonstrated a possible use of
real-time gesture recognition by controlling a digital TV using hand gestures.
1 INTRODUCTION
In the context of human behavior recognition, most
of the popular methods utilize sparse spatio-temporal
features to capture local motions, then character them
according to vectors of local visual descriptors, and
lastly code the vectors using the learned visual dictio-
nary; that is, the process assigns discrete labels to de-
scriptors, with similar descriptors having a high prob-
ability of being the same label. The occurrences of
each visual word are counted to build global content.
Finally, the histogram is fed to a classifier to estimate
the behavior category label. These methods are col-
lectively known as a ‘bag-of-words’ approach, and
it has been proved to produce state-of-the-art results
on content-based image and video retrieval bench-
marks, such as the Pascal VOC challenge (Evering-
ham et al., 2014) and the TRECvid Video Retrieval
task (Smeaton et al., 2006). When analyzing the con-
tents of movies, computational efficiency become an
issue because a typical local spatio-temporal feature
detection algorithm demands high computation power
and typically yields 10
3
− 10
4
local descriptors in the
vicinity of actions. Some recent studies have investi-
gated various faster alternatives to the standard ’bag-
of-words’ pipeline for all of its components (Moos-
mann et al., 2008; Uijlings et al., 2010). A sum-
mary of the structure of the pipeline is as follows: (i)
for descriptor extraction, a dense sampling method is
used to reduce computation time for calculating the
region descriptors; (ii) for descriptor projection, ran-
dom forests are utilized to decrease projection time;
and (iii) for classification, non-linear Support Vec-
tor Machines (SVM) is employed to classify bag-of-
words histograms. Based on the results of these in-
vestigations, we implement and investigate the real-
time behavior recognition pipeline by classifying var-
ious hand gestures in real-time. In the following dis-
cussion, we use the terms real-time and on-line in-
terchangeably to denote that a classification result is
returned within a few seconds.
In this paper, we take the approach proposed by
Moosmann et al. (2008) as a starting point and fur-
ther improve its discriminative power with proposed
boosted random clustering forests to construct a vi-
sual word dictionary. From our analysis, our proposed
method achieves a better recognition rate than the Ex-
tremely Randomized Clustering Forests (ERCF) in
Moosmann et al. (2008). One drawback of our ap-
proach is the increase in time at the learning stage, but
220
Yano K., Ogawa T., Kawanabe M. and Suyama T..
On-line Hand Gesture Recognition to Control Digital TV using a Boosted and Randomized Clustering Forest.
DOI: 10.5220/0005263502200227
In Proceedings of the 10th International Conference on Computer Vision Theory and Applications (VISAPP-2015), pages 220-227
ISBN: 978-989-758-090-1
Copyright
c
2015 SCITEPRESS (Science and Technology Publications, Lda.)

this is effectively decreased by the proposed boosted
random clustering forests. The details of the algo-
rithm are described in Section 5. As an applica-
tion of real-time hand gesture recognition, we control
home appliances, such as digital TVs, as an alterna-
tive method of smart interface.
This paper is organized as follows. In Section
2, we discuss related work. We describe our feature
extraction algorithm in Section 3. In Section 4, we
present a novel boosted random clustering forest with
results. In Section 5, we demonstrate an application
of real-time hand gesture recognition. We offer our
conclusions in Section 6.
2 RELATED WORK
When classifying objects in images, salient feature
detection is of primal importance. Thus, points with
a significant local variation in image intensity have
been extensively investigated in the past (Laptev and
Lindeberg, 2003; Dollar et al., 2005). Such image
points are frequently referred to as “interest points”
and are attractive due to their high information con-
tent and relative stability with respect to perspec-
tive transformations of the data. To extend the no-
tion of interest points into the spatio-temporal do-
main, Laptev and Lindeberg (2003) extended the Har-
ris corner detection from static images to the spatio-
temporal domain to detect interest points in movies.
Dollar et al. (2005) proposed a response function
formed by a filter bank from the convolution of a 2D
Gaussian smoothing kernel in the spatial dimension
and a quadrature pair of 1D Gabor filters applied in
the temporal dimension. Then the detector is tuned to
fire at any region with spatially distinguishing charac-
teristics undergoing a complex motion. The interest-
point detector based on these filters, however, re-
quires a lot of computational time. Instead of sparsely
sampling interest points, there are many works that
use dense sampling (Shotton et al., 2008; Dalal and
Triggs, 2005). Jurie and Triggs (2005) showed that
sampling patches on a regular dense grid outperforms
the use of interest points, as used in the evaluation of
Zhang et al. (2006) .
Several tree-based algorithms have been proposed
to speed up the assignment of visual words, allowing
for a logarithmic rather than a linear time in the num-
ber of visual words (Moosmann et al., 2008; Shotton
et al., 2008). Lazebnik et al. (2006) proposed the spa-
tial pyramid, introducing a weak form of spatial infor-
mation by increasingly subdividing the image and ob-
taining a codebook frequency histogram for each re-
gion separately. However, the resulting codebook his-
togram seems to have a negative impact on the speed
of classification, and we do not include this method in
our experiments.
3 DENSE SAMPLING OF VISUAL
DESCRIPTORS
In this section, we describe a dense sampling of vi-
sual descriptors from video clips. We use the His-
togram of Orientation Gradient (HOG) (Dalal and
Triggs, 2005) and Histogram of Optical Flow (HOF)
(Chaudhry et al., 2009) as descriptors for extracting
visual features. HOG computes the gradient orien-
tation magnitude in the horizontal and vertical di-
rections for each frame, and HOF computes the ori-
entation magnitude of the optical flow displacement
vectors in the horizontal and vertical directions be-
tween adjacent frames. Before computing the HOG
and HOF descriptors, we apply a Gaussian filter in
the spatial and temporal directions to reduce noise.
We use a Sobel operator with a kernel size of 3 to
calculate the gradient magnitude responses, and we
use a dense optical flow, using Farneb¨ack’s algorithm,
to compute HOF. We use the version implemented
by OpenCV
1
to compute a dense optical flow. Both
descriptors are represented in a 2-dimensional vector
field per frame. The vectors are aggregated both in
spatial and temporal direction. We use a 4× 4 pixel
area in spatial direction and a half of sliding window
length in temporal direction. The magnitudes of ag-
gregated vectors are quantized in o orientations, usu-
ally o = 8. To generate block or low level features,
the cell-level features are concatenated by using 4× 3
cell area. After the concatenation, the low level fea-
tures are normalized by performing L2-normalization.
An overview of these processes is shown in Fig. 1.
In our experiments, the video is taken from a com-
modity webcam. The original frame is resized to
160 × 120 for computational reason and each frame
is generated at 30 FPS. We accumulate frames un-
til the length of frames reaches the specified sliding
window size, which is equal to 100 for our cases. The
size of sliding window is empirically determined so
that it is long enough to capture the intended hand
gestures. The accumulated frames are processed by
using the pipeline described above. In total, we gen-
erate 40×30× 2 cell level features. The low or block
level features are generated by concatenating 4×3×2
cell level features. Correspondingly they are repre-
sented as 10 × 10 features. Of all the components
of the pipeline described, the feature extraction and
1
http://opencv.org
On-lineHandGestureRecognitiontoControlDigitalTVusingaBoostedandRandomizedClusteringForest
221

generation are the most time-consuming component,
as explained in Section 5. So, the handling of these
components plays a key role in speeding up on-line
hand gestures recognition tasks. Uijlings et al. (2010)
suggested that the matrix multiplication is an efficient
way to aggregate the responses within each subregion
. To summarize the method, two matrix multiplica-
tions are used: one to sum in the row direction and the
other to sum over the column direction. If we were to
let R be the pixel-wise responses from an image, in or-
der to sum the responses over subregions of size 3×3,
one would employ matrix multiplication ARB, where
A sums over elements in the row direction and has the
form of,
1 1 1 0 0 0 ··· 0 0 0
0 0 0 1 1 1 ··· 0 0 0
.
.
.
.
.
.
.
.
.
.
.
.
.
.
.
.
.
.
.
.
.
.
.
.
.
.
.
.
.
.
0 0 0 0 0 0 ··· 1 1 1
Matrix B sums over the column direction and is
similar to A
T
but has a size adapted to R.
4 BOOSTED AND RANDOMIZED
CLUSTERING FOREST
Motivated by the Extremely Randomized Clustering
Forests (ERCF) proposed in Moosmann et al. (2008)
, we use randomized clustering forests (RCF) for gen-
erating visual code books. In this work, low level fea-
ture data d = ( f
1
, · ·· , f
d
), where f
i
, i = 1, ··· , d are
scalar features, are clustered using RCF, as shown in
Fig. 2.
We propose Boosted and Random Clustering
Forests (BRCF) to generate random forests. BRCF
is different from ERCF in some respects. Whenever
growing a random tree, we select the node among all
leaf nodes that produces the highest score, which is
explained afterward. This approach requires a much
longer training time than the greedy depth-first ap-
proach in ERCF, but the random trees generated are
confirmed to be more balanced and superior in dis-
criminative capability. It is trivial to control the num-
ber of leaf nodes generated, but nodes must be pruned
one by one in a bottom-up manner in BRCF. More-
over, in order to compute a score at the node, we use
the mutual information gain of entropy rather than the
Shannon entropy used in ERCF, as it is seemingly
more intuitive. In our experiments, there were no sig-
nificant differences in the results when choosing our
scoring method. We also extend the algorithm by con-
sidering the weights of samples assigned at the nodes.
When growing a tree, we updated the weights of sam-
ples incident at the node, so that implicitly enforcing
to split examples of different classes. The weighting
has the attractive effect of shortening training time
in comparison with BRCF without weighting. The
definition of the weighting is provided later in this
section. The comparison of these different clustering
methods is described in Section 5.
In the following, we describe the details of the
proposed BRCF. The overall structure of the method
is described in Algorithm 1. In the algorithm, let
L = (d
n
, c
n
), n = 1, ··· , N as a labeled training set, and
I specify the index of training sample. N
leaf
and
N
decision
are the variables for managing all the node
ids currently marked as leaf and decision nodes, re-
spectively. To start with, one creates a root node and
assigns all the samples to the node. The weights, a
i
,
of the training samples are initially set as
1
N
. Learning
proceeds recursively by growing a tree until the num-
ber of leaf nodes reaches the specified number. To
select a leaf node to split, we verify which produces
the maximum gain of mutual information. The tree-
growing algorithm is illustrated in Algorithm 2. At
leaf node r, we divide the training data, I
r
, into left
and right subsets I
r
L
and I
r
R
according to a threshold
θ
i
of some split function ψ of the feature vector f as
follows:
I
r
L
= {i ∈ I
r
| ψ( f
i
) < θ
i
}, (1)
I
r
R
= I
r
\I
r
L
. (2)
For the split function, ψ, we define it to randomly
select the attribute number, i, and the threshold, θ
i
,
is randomly selected from uniform distribution. Of
all the examined (node
r
, i, θ
i
), the one that maximizes
the expected gain in mutual formation is chosen. In
Algorithm 2, the expected information gain at node r
is defined as follows:
G
r
= E(I
r
) − P
r
L
E(I
r
L
) − P
r
R
E(I
r
R
) (3)
where E(I) is the entropy of the classes in the set of
examples I,and defined as follows:
E(I) = −
∑
y∈C
P(y|I)log
2
P(y|I) (4)
where P(y|I) is the ratio of the examples whose class
is y and is defined as follows:
P(y|I) =
∑
i∈I|c
i
≡y
a
i
∑
i
a
i
(5)
Similarly, Pr
L
and Pr
R
are defined as follows:
P(r
L
) =
∑
i∈I
r
L
| f
i
r
<θ
r
a
i
∑
i
a
i
, (6)
P(r
R
) =
∑
i∈I
r
R
| f
i
r
≥θ
r
a
i
∑
i
a
i
(7)
VISAPP2015-InternationalConferenceonComputerVisionTheoryandApplications
222
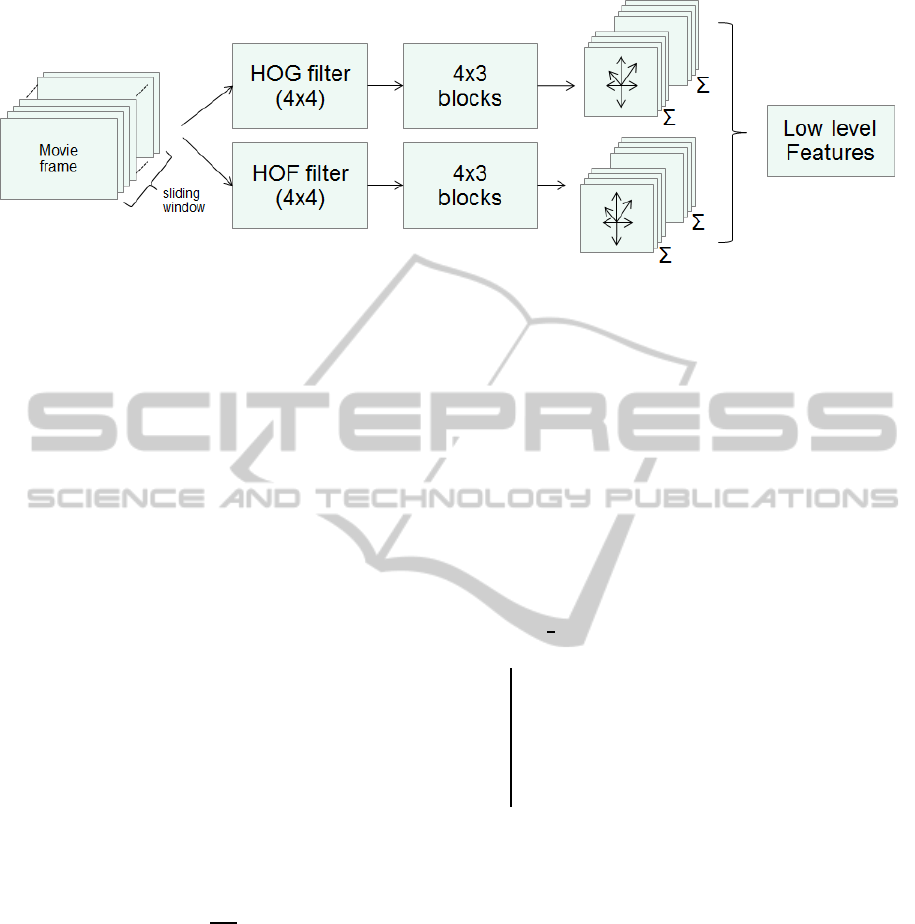
Figure 1: Movie clips extracted from an input video stream using a sliding window are processed to generate HOG and HOF
descriptors. First, the two vector fields of intensity gradient and optical flow are densely sampled. Then, the dense vector
features are aggreated to generate cell level features. To generate cell-level local features, a 4×4 pixel area in spatial direction
and a half of sliding window length in temporal direction are used for aggregation by quantizing using 8 bins for the vector
direction. To generate low or block level features, 4 × 3× 2 cell level features are concatenated. Finally, each block level
feature is normalized by using L2 norm.
At node r, the weights for the set of examples are
updated as follows. The weights of the sample are
inversely changed according to its class probability.
The class distributions P(c|I
r
) are estimated empiri-
cally as a histogram of the class label distribution of
the training example I
r
at node r.
a
(t+1)
i
= a
(t)
i
exp{−wP(c
i
|I
r
)}, (8)
i = 1, · ·· , n
r
This substantially favors splitting examples so that
the classes are well separated. For instance, sup-
pose that if ten samples are allocated at a node with
class labels as {1, 1, 1, 1, 1, 1, 1, 1, 2, 2}, the node then
more likely be split to left and right child nodes so
that the examples with different classes are separated
into {1, 1, 1, 1, 1, 1, 1, 1} and {2, 2} by the tree grow-
ing method mentioned above. The score of node r
is computed by considering the number of examples
allocated:
F
r
=
|I
r
|
|I
1
|
G
r
(9)
5 EXPERIMENTS
We evaluated our method by recognizing different
hand gestures taken from a webcam (Logicool HD
Webcam C270). We defined six different hand ges-
tures, as shown in Fig. 3. We generate 100 features
for HOG and HOF and the size of feature was cal-
culated as 192 = (4× 3× 8× 2). Then, generated de-
scriptors were clustered by BRCF. In the experiments,
in order to generate BRCF, we use four random trees
and each tree consists of 512 leaf nodes. In total, 2048
Data: index of all training example,
I = {1, · ·· , n}
Result: random tree N
decision
, N
leaf
1 set root node number as 1 ;
2 N
leaf
= {1} ;
3 N
decision
= {∅} ;
4 I
1
= {1, 2, ·· · , n} ;
5 K ← 1 ;
6 a
i
←
1
n
(i = 1, · ·· , n) ;
7 while |N
leaf
| < max
N
do
8 r
L
, r
R
← treeGrow(N
decision
, N
leaf
, K) (in
Algorithm 2);
9 K ← K + 2 ;
10 N
leaf
← N
leaf
S
{r
L
, r
R
}\{r};
11 updateWeights({a
i
|i ∈ I
r
L
});
12 updateWeights({a
i
|i ∈ I
r
R
});
13 end
Algorithm 1: Random tree generation algorithm.
bins were used for the visual words histogram. To
classify the visual words, we used a non-linear SVM
with an RBF kernel. We used the version imple-
mented by OpenCV. Before testing, we collected five
samples of each hand gesture from five subjects. To
obtain recognition results, we randomly divide the
data set into training and testing data. After learning
the classifier with training data, we classify the test-
ing data and obtain the recognition rate. We repeat
this process 100 times and obtain the final results by
averaging the results. For comparison, we compare
our results with a K-means clustering and the nearest
neighbor approach for a baseline case. The confusion
matrixes of the results are shown in Tables 1 and 2.
We use only HOG as the descriptors for the results
in Table 1 and fused HOG and HOF descriptors are
On-lineHandGestureRecognitiontoControlDigitalTVusingaBoostedandRandomizedClusteringForest
223
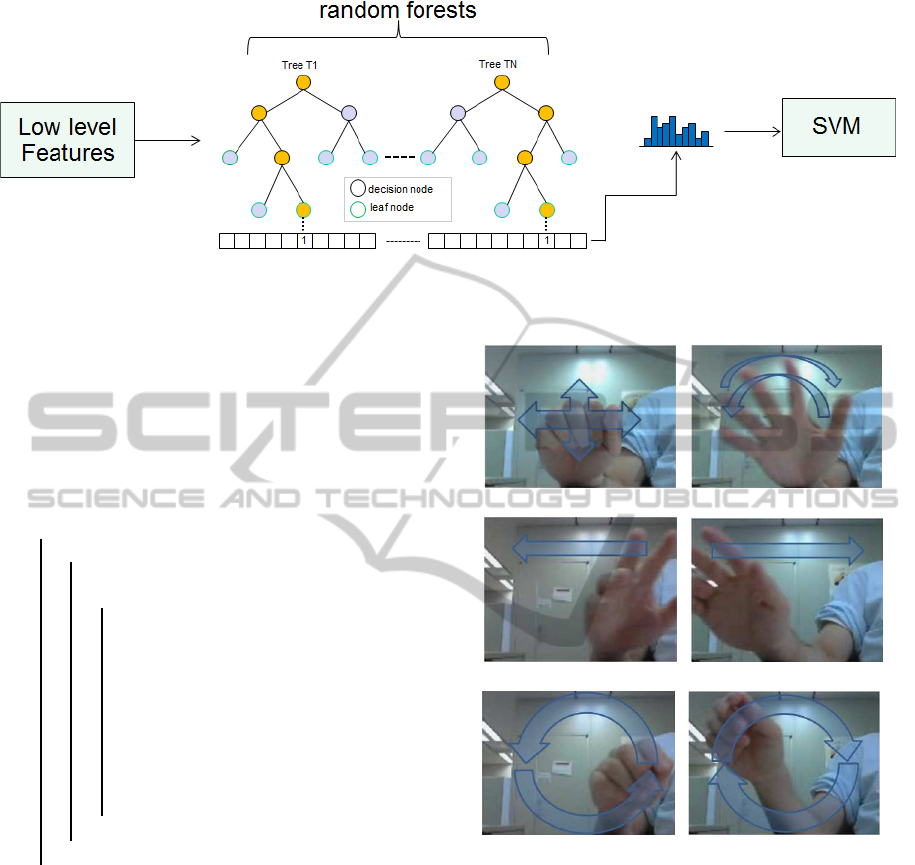
Figure 2: Random forests are used as a clusterer for clustering low level features to the leaf nodes of each tree. Each leaf node
has a unique id that corresponds to the index bin of the histogram, as shown in the figure. Each histogram from each tree is
first normalized and then concatenated to generate a feature vector for a classifier such as SVM.
used for the results in Table 2. Apparently, when we
use a fusion of HOF and HOG, the recognition rate
greatly improves, which implicitly suggests that mo-
tion information is significant in discriminating dif-
ferent hand gestures.
Data: N
decision
, N
leaf
, K
Result: new leaf node r
L
, r
R
1 for c ∈ N
leaf
do
2 if stopsplitting(c) = No then
3 tries ← 0 ;
4 repeat
5 tries ← tries+ 1 ;
6 select an attribute number i
c
randomly;
7 select a threshold θ
c
randomly;
8 split leaf node c to child node c
R
and c
L
such that;
9 I
c
L
← {i ∈ I
c
| f
i
c
< θ
t
} ;
10 I
c
R
← {i ∈ I
c
| f
i
c
≥ θ
t
} ;
11 score
c
← F
c
(c, c
R
, c
L
) ;
12 until (score
c
≥ S
min
) or (tries ≥ T
max
);
13 end
14 end
15 r = argmax
c
(score
c
) ;
16 createDecisionNode(r, i
r
, θ
r
, r
L
, r
R
) ;
17 N
decision
← N
decision
S
{r} ;
18 N
leaf
← N
leaf
\{r} ;
19 r
L
← K + 1 ;
20 r
R
← K + 2 ;
Algorithm 2: Tree growing algorithm.
Since the feature vector is very sparse, the clas-
sification results greatly depend on the parameters of
the RBF kernel, C and γ. Intuitively, the γ parame-
ter defines how far the influence of a single training
example reaches and the C parameter trades off the
misclassification of training samples against the sim-
plicity of the decision surface. We set C = 50.0 and
(a) grasp (b) wave
(c) right (d) left
(e) circle-cw (f) circle-ccw
Figure 3: Hand gestures: (a) a hand grasping repeatedly, (b)
a hand waving, (c) a hand moving once from left to right, (d)
a hand moving once from right to left, (e) a hand moving in
a clockwise circle, and (f) a hand moving in a counterclock-
wise circle.
γ = 6.0 for all results.
The results from the analysis of training times
among the different clustering methods is shown in
Fig. 4. We used one-way ANOVA to analyze the data.
The p-value was under 1e− 10. The y-axis describes
the training time in seconds. There were no signif-
icant differences between K-means and ERCF. The
training time for BRCF was about ten times longer
than for ERCF. When BRCF is used without weight-
ing of samples, which is termed BRCF-NW in the
following discussion, it was a little more than 40
VISAPP2015-InternationalConferenceonComputerVisionTheoryandApplications
224
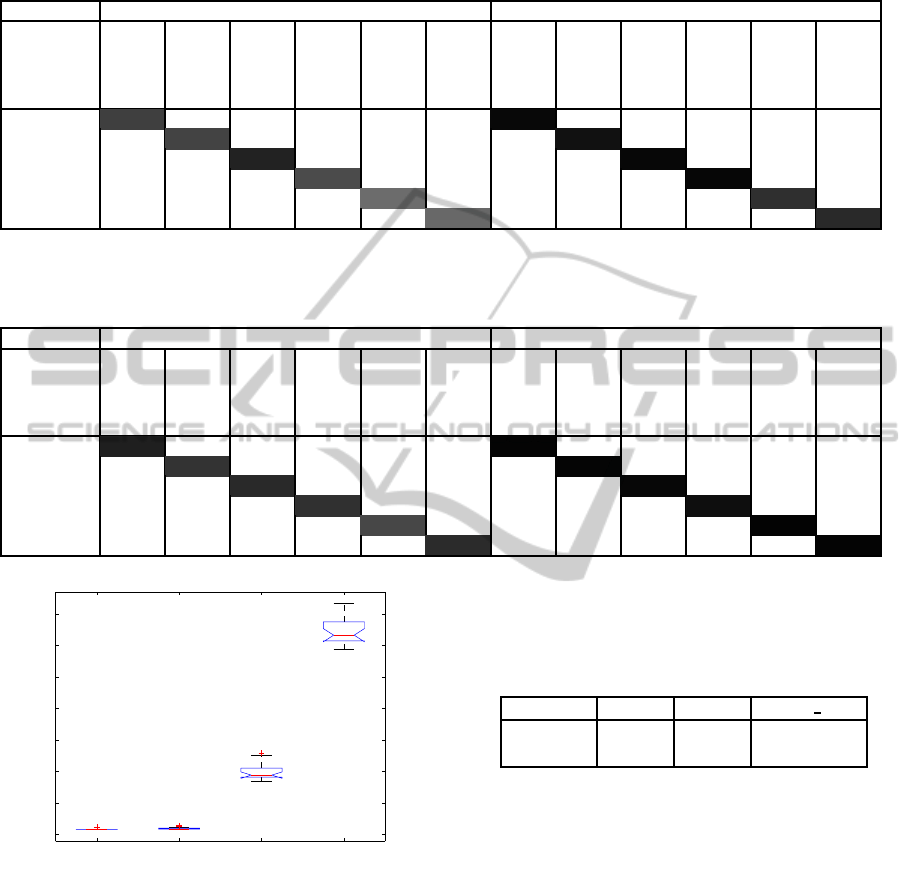
Table 1: Confusion matrix: Only HOG is used for descriptors. Left: K-means is used for clustering and the nearest neighbor
approach is used for the classifier. Right: BRCF is used for clustering and non-linear SVM (RBF) is used for the classifier.
Clustering size is 2048 for both cases. Random forests consist of four trees with 512 leaf nodes each.
HOG, K-means, NN HOG, BRCF, SVM(RBF)
grasp
wave
right
left
circle-cw
circle-ccw
grasp
wave
right
left
circle-cw
circle-ccw
grasp 75.5 18.2 0.0 2.6 0.7 0.0 96.9 2.5 0.0 0.0 0.3 0.2
wave 22.4 73.7 0.8 2.2 0.7 0.2 5.0 93.4 0.0 0.0 1.0 0.6
right 1.7 4.2 86.7 7.4 0.0 0.0 0.0 0.0 97.3 2.7 0.0 0.0
left 7.3 7.5 7.5 70.4 6.3 1.0 0.0 0.0 2.3 97.7 0.0 0.0
circle-cw 1.7 4.0 0.0 0.4 57.5 36.4 0.2 0.0 0.0 0.0 81.6 18.2
circle-ccw 0.4 2.2 0.1 0.9 37.3 59.1 0.0 0.0 0.0 0.0 15.9 84.1
Table 2: Confusion matrix: Both HOG and HOF are used for descriptors. Left: K-means is used for clustering and the nearest
neighbor approach is used for the classifier. Right: BRCF is used for clustering and non-linear SVM (RBF) is used for the
classifier. Clustering size is 2048 for both cases. Random forests consist of four trees with 512 leaf nodes each.
HOG-HOF, K-means, NN HOG-HOF, BRCF, SVM(RBF)
grasp
wave
right
left
circle-cw
circle-ccw
grasp
wave
right
left
circle-cw
circle-ccw
grasp 87.7 11.8 0.0 0.2 0.4 0.0 98.4 1.4 0.0 0.1 0.0 0.1
wave 16.2 80.0 0.2 1.3 2.3 0.1 2.0 98.0 0.0 0.0 0.0 0.0
right 1.2 7.1 83.9 3.9 0.0 3.9 0.0 0.0 97.3 2.7 0.0 0.0
left 5.6 8.0 3.4 81.0 1.8 0.3 0.5 0.0 4.7 94.4 0.1 0.2
circle-cw 1.9 5.9 0.0 0.9 72.0 19.3 0.0 0.1 0.0 0.0 99.0 0.9
circle-ccw 0.1 1.6 0.0 0.6 14.6 83.0 0.7 0.0 0.0 0.0 0.8 98.5
K−means ERCF BRCF BRCF_NW
0
500
1000
1500
2000
2500
3000
3500
Training Time [sec]
Figure 4: Comparison of training time among different clus-
tering methods. The time data were analyzed using one-way
ANOVA (p-value < 1.0e− 10).
times longer than ERCF. The results elucidate that
the weighting can effectively boost the training time
of BRCF. In Table 3, the Average Precision (AP) of
four different methods is shown. We obtain 2.0%
and 4.1% absolute performance gains compared with
ERCF when using BRCF and BRCF-NW, respec-
tively. It is confirmed that BRCF generates random
forests that are more balanced in terms of the number
of samples assigned at nodes and that it clusterizes
Table 3: Comparison of recognition rates among different
clustering algorithms. Result of K-means with the nearest
neighbor approach is shown as a base case. Accuracy is
measured in terms of Average Precision (AP). (1st row:AP,
2nd row: std. dev. of AP).
K-means ERCF BRCF BRCF NW
82.5% 95.4% 97.4% 99.5%
±0.6 ±0.9 ±0.5 ±0.2
better in categories. As for the analysis of elapsed
time, it took about 2.8 sec to generate HOG and HOF
features. The classification time taken by K-means
and NN was 5.8 sec and 2.8 sec by BRCF and SVM
on average.
6 APPLICATION
As an example of a possible application using the
on-line hand gesture recognition, we implement an
application to control a digital TV using hand ges-
tures. Controlling home appliances, such as a digi-
tal TV, using mobile terminals, such as smartphones
and tablets, via Internet Protocol(IP) has been attract-
ing attention due to the prevalence of Wireless Fi-
delity (WiFi) technology,as it takes advantage of their
On-lineHandGestureRecognitiontoControlDigitalTVusingaBoostedandRandomizedClusteringForest
225
graphical and interactive user interface. However, the
cost of implanting programs for IP remote controllers
on various home appliances is a serious issue, which
has hindered dissemination. To cope with this issue,
the standardization of home networks, including vari-
ous home appliances, is important. ECHONET
2
is
one of such standardizations proposed by Japanese
manufactures such as TOSHIBA, Hitachi, Panasonic,
etc. A system overview of digital TV control using
hand gestures is shown in Fig. 5. Hand gestures
are recorded on a webcam and then decoded using
the hand gesture recognition PC. Classified hand ges-
tures are mapped to TV commands, and they are then
converted to the corresponding web-CGI Application
Programing Interface (API) recognized by the TV
control gateway PC. The TV control commands are
converted to the ECHONET protocol and sent to the
digital TV using an infrared (IR) transmitter. Before
the experiments, six hand gestures, corresponding to
different TV commands, were learned according to
the proposed learning method. We conducted experi-
ments in the BMI house, as shown in Fig. 6. The ex-
periments consisted of three sessions. In each session,
the subject sat in front of a digital TV and performed
the hand gestures by randomly selecting his or her in-
tended TV control following the cue signal shown on
the PC monitor. The experiments were repeated ten
times in each session. The average recognition rate
was about 70.0%. The result is not as good as we ex-
pected. Possible factors for this include a change of
background in the camera frame and a slight dissimi-
larity in hand postures between the training and test-
ing sessions. However, the recognition rate was still
quite high, considering that the subject was not given
enough training time for these experiments. We ex-
pect that the recognition rate will increase if the sub-
ject receives sufficient training beforehand and if we
collect training data from the same environmentas the
testing session.
Table 4: Mapping between hand gestures and TV control
commands.
Hand gesture TV control
grasp power on TV
wave power off TV
move right change channel up
move left change channel down
circle cw volume up
circle ccw volume down
In the BMI house, it is not only the digital TV
but also the air-conditioners and housing installation
apparatus, including the doors, curtains, and lighting,
2
http://www.echonet.gr.jp/english/index.htm
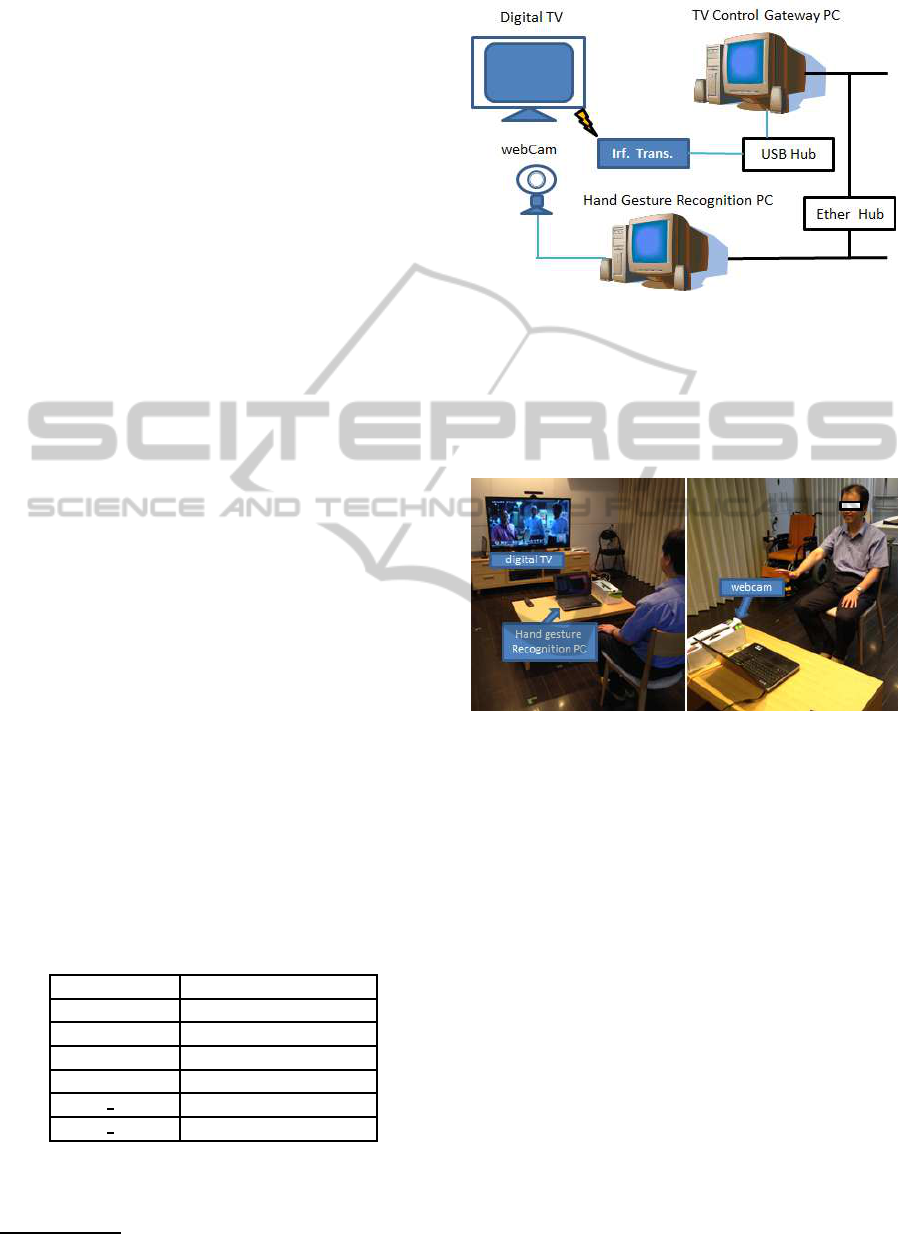
Figure 5: System overview of digital TV control using hand
gestures. A hand gesture is recorded by a webcam and then
decoded by the hand gesture recognition PC. The classified
hand gesture is mapped to a TV command, and then it is
converted to the corresponding TV control web-CGI API
recognized by the TV control gateway PC. The TV control
command is converted to the ECHONET protocol and sent
to a digital TV using an IR transmitter.
Figure 6: Hand gesture recognition experiments in the BMI
house.
that can be controlled using a centralized home au-
tomation system. The results indicate that hand ges-
tures could be used as smart interfaces for controlling
a home apparatus and home appliances and could be
substituted for existing controllers.
7 CONCLUSION
In this paper, we present the structure of a fast
online hand gesture recognition pipeline and verify
that it is reliable and fast enough for use in real-
time application, such as to provide a digital TV
control. In particular, we propose a Boosted and
Randomized Clustering Forest (BRCF) method. It
has a higher training time, but this method provides
increased discriminative ability over the previously
proposed Extremely Randomized Clustering Forest
(ERCF) method (Moosmann et al., 2008). From our
results, it is confirmed that BRCF has a better recog-
VISAPP2015-InternationalConferenceonComputerVisionTheoryandApplications
226

nition rate. The higher training time in BRCF can be
effectively reduced by adopting the proposed weight-
ing method, in which the weights of the sample allo-
cated at the nodes are adaptively controlled. When-
ever growing a tree, it implicitly separate examples of
different classes into left and right child nodes. As an
application, we utilize hand-gesture recognition for
controlling a digital TV. Low-level feature extraction
and decoding can be done quickly by adopting dense
sampling of HOG and HOF descriptors followed by
the clustering of these descriptors using BRCF. We
can successfully decode and classify various hand
gestures and control the digital TV without a signif-
icant time delay. However we admit that user evalu-
ation of the proposed natural user interface by hand
gestures is open to argument.
There are some future works for the proposed
hand gestures recognition method. Firstly, since our
method does not detect hand region, the recognition
rate is highly affected by the changes of position and
scale of the hand. Second, the generated feature vec-
tors are very sparse, hence non-linear classifier is re-
quired to discriminate them. For the first issue, there
are many methods to segment hand region from RBG
or RGB-D images that can be integrated in our recog-
nition pipeline (Kurakin et al., 2012). For the feature
vectors, we could augment it by using Fisher Vector
method (Perronnin and Dance, 2007).
ACKNOWLEDGEMENTS
This work was supported through the sponsored re-
search project Network-type Brain Machine Interface
by the Ministry of Internal Affairs and Communica-
tions, Japan.
REFERENCES
Chaudhry, R., Ravichandran, A., Hager, G., and Vidal, R.
(2009). Histograms of oriented optical flow and binet-
cauchy kernels on nonlinear dynamical systems for
the recognition of human actions. In Computer Vision
and Pattern Recognition, 2009. CVPR 2009. IEEE
Conference on, pages 1932–1939.
Dalal, N. and Triggs, B. (2005). Histograms of oriented gra-
dients for human detection. In Computer Vision and
Pattern Recognition, 2005. CVPR 2005. IEEE Com-
puter Society Conference on, volume 1, pages 886–
893 vol. 1.
Dollar, P., Rabaud, V., Cotrell, G., and Belongie, S. (2005).
Behavior recognition via sparse spatio-temporal fea-
tures. In Visual Surveillance and Performance Eval-
uation of Tracking and Surveillance, 2005. 2nd Joint
IEEE International Workshop on, pages 65–72.
Everingham, M., Ali Eslami, S. M., Gool, L. V., Christo-
pher Williams, K. I., Winn, J., and Zisserman, A.
(2014). The pascal visual object classes challenge:
A retrospective. International Journal of Computer
Vision.
Jurie, F. and Triggs, B. (2005). Creating efficient code-
books for visual recognition. In Computer Vision,
2005. ICCV 2005. Tenth IEEE International Confer-
ence on, volume 1, pages 604–610 Vol. 1.
Kurakin, A., Zhang, Z., and Liu, Z. (2012). A real time sys-
tem for dynamic hand gesture recognition with a depth
sensor. In Signal Processing Conference (EUSIPCO),
2012 Proceedings of the 20th European, pages 1975–
1979.
Laptev, I. and Lindeberg, T. (2003). Space-time inter-
est points. In Computer Vision, 2003. Proceedings.
Ninth IEEE International Conference on, pages 432–
439 vol.1.
Lazebnik, S., Schmid, C., and Ponce, J. (2006). Beyond
bags of features: Spatial pyramid matching for recog-
nizing natural scene categories. In Computer Vision
and Pattern Recognition, 2006 IEEE Computer Soci-
ety Conference on, volume 2, pages 2169–2178.
Moosmann, F., Nowak, E., and Jurie, F. (2008). Random-
ized clustering forests for image classification. Pat-
tern Analysis and Machine Intelligence, IEEE Trans-
actions on, 30(9):1632–1646.
Perronnin, F. and Dance, C. (2007). Fisher kernels on vi-
sual vocabularies for image categorization. In Com-
puter Vision and Pattern Recognition, 2007. CVPR
’07. IEEE Conference on, pages 1–8.
Shotton, J., Johnson, M., and Cipolla, R. (2008). Semantic
texton forests for image categorization and segmen-
tation. In Computer Vision and Pattern Recognition,
2008. CVPR 2008. IEEE Conference on, pages 1–8.
Smeaton, A. F., Over, P., and Kraaij, W. (2006). Evaluation
campaigns and trecvid. In In Multimedia Information
Retrieval, pages 321–330.
Uijlings, J., Smeulders, A. W. M., and Scha, R. (2010).
Real-time visual concept classification. Multimedia,
IEEE Transactions on, 12(7):665–681.
Zhang, J., Marszalek, M., Lazebnik, S., and Schmid, C.
(2006). Local features and kernels for classification
of texture and object categories: A comprehensive
study. In Computer Vision and Pattern Recognition
Workshop, 2006. CVPRW ’06. Conference on, pages
13–13.
On-lineHandGestureRecognitiontoControlDigitalTVusingaBoostedandRandomizedClusteringForest
227
