
Color Restoration for Infrared Cutoff Filter Removed RGBN
Multispectral Filter Array Image Sensor
Chul Hee Park, Hyun Mook Oh and Moon Gi Kang
Institute of BioMed-IT, Energy-IT and Smart-IT, Technology (BEST), Yonsei University,
50 Yonsei-Ro, Seodaemun-Gu, Seoul, South Korea
Keywords:
Multi Spectral Image, Color Restoration, Spectral Estimation, Low Light Condition, Spectral Decomposition,
Multi Filter Array, Infrared Cut Off Filter Removal.
Abstract:
Imaging systems based on multispectral filter arrays(MSFA) can simultaneously acquire wide spectral infor-
mation. A MSFA image sensor with R, G, B, and near-infrared(NIR) filters can obtain the mixed spectral
information of visible bands and that of the NIR bands. Since the color filter materials used in MSFA sensors
were almost transparent in the NIR range, the observed colors of multispectral images were degraded by the
additional NIR spectral band information. To overcome this color degradation, a new signal processing ap-
proach is needed to separate the spectral information of visible bands from the mixed spectral information. In
this paper, a color restoration method for imaging systems based on MSFA sensors is proposed. The proposed
method restores the received image by removing NIR band spectral information from the mixed wide spec-
tral information. To remove additional spectral information of the NIR band, spectral estimation and spectral
decomposition were performed based on the spectral characteristics of the MSFA sensor. The experimental
results show that the proposed method restored color information by removing unwanted NIR contributions to
the RGB color channels.
1 INTRODUCTION
In most digital cameras, CCD or CMOS image sen-
sors are used to acquire the light reflected by ob-
jects. Unlike human eyes, sensors based on sili-
con (SiO2) are sensitive to near-infrared(NIR) up to
1100nm, limited by the cut-off of silicon. To prevent
unnatural looking images, digital cameras are usually
equipped with infrared cut-off (IRCF) filter. This fil-
ter, sometimes called IR filter or hot mirror, reflect or
block near infrared wavelengths from about 700nm to
1100nm while allowing visible light to enter.
However, because of this characteristic of IRCF,
image sensors cannot receive much valuable informa-
tion outside of the visible spectrum. For instance,
most dyes and pigments used for material coloriza-
tion are somewhat transparent to NIR. Therfore, the
difference in the NIR intensities is not only due to the
particular color of the material, butalso the absorption
and reflectance characteristics of the dyes. Therefore,
the NIR intensity gives the information pertinent to
material classes rather than the color of that object
(Salamati and Susstrunk, 2010).
Recently, there have been several attempts to use
NIR band information. In remote sensing applications
(J. Choi and Kim, 2011), the multi-spectral images
observed in a variety of the spectrum bands are used
where both visible and NIR bands are included. As
each spectral band provides different information, the
spectral bands are selectively used in the observation
of the multi-spectral images.
In surveillance cameras (X. Hao and Wang, 2010),
the NIR band is used especially in low light condi-
tions or invisible NIR light conditions. The NIR band
is also used in biometric (Kumar and Prathyusha,
2009), face matching (D. Yi and Li, 2007), and face
recognition (S. Z. Li and Lun, 2007) applications,
which have been studied based on the intrinsic re-
flectivity of the skin or eyes under NIR illumination.
Since the reflection in NIR is material dependent, it
is also used in material classification (Salamati and
Susstrunk, 2010) and illuminant estimation (Fredem-
bach and Susstrunk, 2009). NIR images can be used
in image enhancement applications such like image
dehazing (L. Schaul and Susstrunk, 2009).
Kise et al. designed a three-band spectral imaging
system composed of multiple cameras with a beam
splitter (M. Kise and Windham, 2010). This imaging
system has been used to acquire multispectral images
in user-selected spectral bands simultaneously by uti-
30
Park C., Oh H. and Kang M..
Color Restoration for Infrared Cutoff Filter Removed RGBN Multispectral Filter Array Image Sensor.
DOI: 10.5220/0005263600300037
In Proceedings of the 10th International Conference on Computer Vision Theory and Applications (VISAPP-2015), pages 30-37
ISBN: 978-989-758-089-5
Copyright
c
2015 SCITEPRESS (Science and Technology Publications, Lda.)
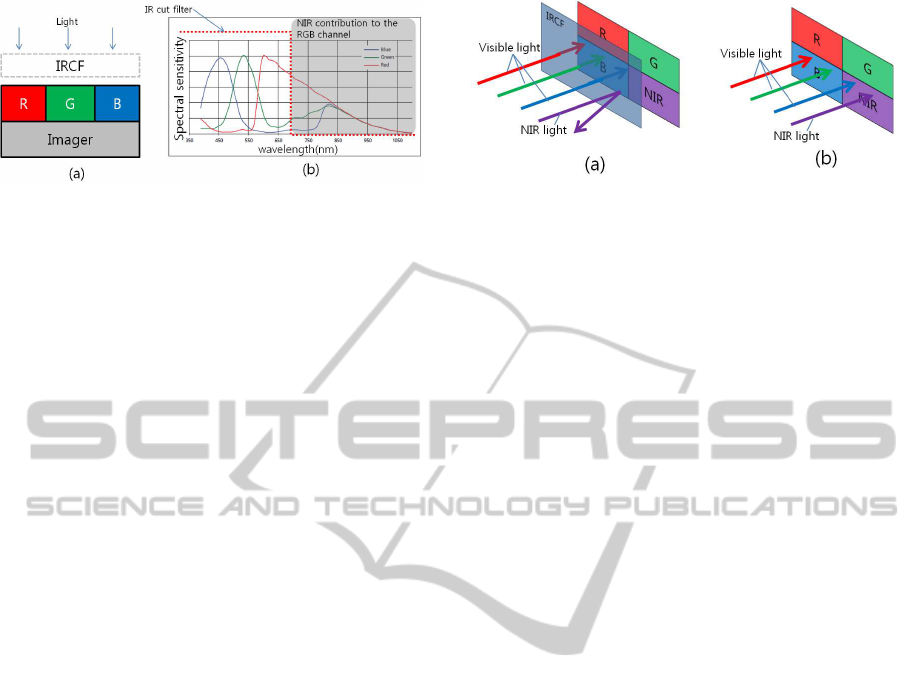
Figure 1: (a) Conventional camera system based on CFA
image sensor with IR-cut filter. (b) Spectral sensitivity of
the camera system.
lizing three interchangeable optical filters and various
optical components. Similarly, Matsui et al. imple-
mented a multispectral imaging system, where two
IRCF removed cameras were used to capture the color
and NIR images, independently (S. Matsui and Sato,
2010). In this system, the IRCF removed cameras are
perpendicularly aligned and the IRCF was used as a
light splitter for visible and NIR bands. By managing
the shutter of two cameras with a single controller,
each spectral band image pair was acquired, simul-
taneously. However, this imaging system requires a
large place to fix two or more cameras and an align-
ment process. Due to the lack of portability of the
devices, multi-camera based imaging systems are not
suitable for outdoor environments.
As an alternative approach, an IRCF removed
color filter array (CFA) image sensor like a Bayer
image sensor without an IRCF can be used (Fredem-
bach and Susstrunk, 2008). By using a single digi-
tal camera without IRCF, the spectral information of
the visible band and that of the NIR band can be ac-
quired at the same time. Fig. 1 shows a conventional
camera system approach with an IRCF and a spec-
tral sensitivity of a MOS imager integrated with tra-
ditional organic on-chip RGB Bayer filters. By re-
moving the IRCF, the NIR contribution to the RGB
channel reaches the MOS imager.
On the other hand, mixing color and NIR sig-
nals on the pixel level can result in extreme color de-
saturation if the illumination contains high amounts
of NIR. Although it may be possible to overcome the
unwanted NIR contribution to the RGB color channel
through the signal processing technique, it is hard to
estimate the NIR spectral energy in each RGB color
channel because there is no way to detect the NIR
band spectral characteristics.
As an improved system based on the single im-
age sensor, an imaging system based on a multispec-
tral filter array (MSFA) which simultaneously ob-
tains visible and NIR band images can be considered
(S. Koyama and Murata, 2008). A pixel configuration
of the RGB filters and another NIR pass filter, which
transmits NIR light only, is shown in Fig.2. With the
Figure 2: The Infrared cut off filter. (a) Typical imaging
system using IRCF. (b) IRCF removed imaging system.
use of this filter configuration, RGB signals can be
calculated by subtracting a NIR signal from RGB sig-
nals that have deteriorated with the NIR components.
As a result, the IRCF can be removed even during
the day. Because of this advantage, imaging systems
based on MSFA sensors can be applied to a wide vari-
ety of applications. Furthermore, if fusion technology
that uses NIR band information is applied, it is possi-
ble to gain additional sensitivity to color which does
not deviate significantly from the human visual sys-
tem.
This paper proposes a color restoration method
that removes the NIR component in each RGB color
channel with an imaging system based on the IRCF
removed MSFA image sensor. Since the color degra-
dation caused by the IRCF removal is a huge limita-
tion, the NIR contribution to each RGB color chan-
nel needs to be eliminated. To remove unwanted NIR
components in each RGB channel, the color restora-
tion model is subdivided into two parts : spectral es-
timation and spectral decomposition.
2 PROBLEM STATEMENT
2.1 Color Model of an IRCF removed
MSFA Image Sensor
The color image observed by an IRCF removed
MSFA image sensor can be modeled as a spectral
combination of three major components: illuminant
spectra E(λ), sensor function R
(k)
(λ), and surface
spectra S(λ). The color image formation model for
channel k, C
(k)
, is defined as (K. Barnard and Funt,
2002):
C
(k)
=
Z
w
expand
E(λ)R
(k)
(λ)S(λ)dλ (1)
=
Z
w
vis
E(λ)R
(k)
(λ)S(λ)dλ
+
Z
w
nir
E(λ)R
(k)
(λ)S(λ)dλ
= C
(k)
vis
+C
(k)
nir
,
ColorRestorationforInfraredCutoffFilterRemovedRGBNMultispectralFilterArrayImageSensor
31
where w
expand
, w
vis
and w
nir
represent the spectral
range of the IRCF removed MSFA image sensor, the
visible band between 400nm to 650nm, and the NIR
band up to 650nm, respectively. Since the IRCF re-
moved MSFA image sensor acquires the additional
NIR band spectral energy up to 650nm wavelength,
the range of these three major components should be
expanded to the NIR band. C
(k)
vis
, C
(k)
nir
represents the
camera response for channel k by using the IRCF re-
moved MSFA image sensor in the visible band, and
the NIR band, respectively. For image sensors with
RGBN filters, the intensities at each pixel position can
be represented as,
R(i, j) = R
vis
(i, j) + R
nir
(i, j) (2)
G(i, j) = G
vis
(i, j) + G
nir
(i, j)
B(i, j) = B
vis
(i, j) + B
nir
(i, j)
N(i, j) = N
vis
(i, j) + N
nir
(i, j).
In Eq. (2), each pixel contains additional NIR band
information. Since this information help to gain the
sensitivity of the sensor, this feature can be useful un-
der low light conditions. However, mixing color and
NIR intensities can result in color degradation if the
illumination contains high amounts of NIR.
2.2 Color Degradation
To correct the de-saturated color from the images
acquired by MSFA image sensors, several conven-
tional methods can be considered as described in
(K. Barnard and Funt, 2002). Given the observed
color vector Y and the visible band color vector with
canonical illuminance X, the color correction ob-
tained by a color constancy method can be repre-
sented in matrix form:
X = Φ
T
Y (3)
where Φ is a diagonal matrix whose component
corresponds to the ratio between the canonical and
the current illuminance of each channel. The illumi-
nant color estimation was performed under unknown
lighting conditions where pre-knowledge based ap-
proaches, such as gamut mapping (G. D. Finlayson,
2000) or the color correlation framework (G. D. Fin-
layson and Hubel, 2001) were used. However, the
conventional color constancy method which does not
consider the NIR contribution to the RGB channels is
limited when it comes to restoring natural color. As a
result, the color degradation caused by additive NIR
band intensity cannot be corrected by the conven-
tional color constancy method. Although each color
is obtained under the same illuminant conditions
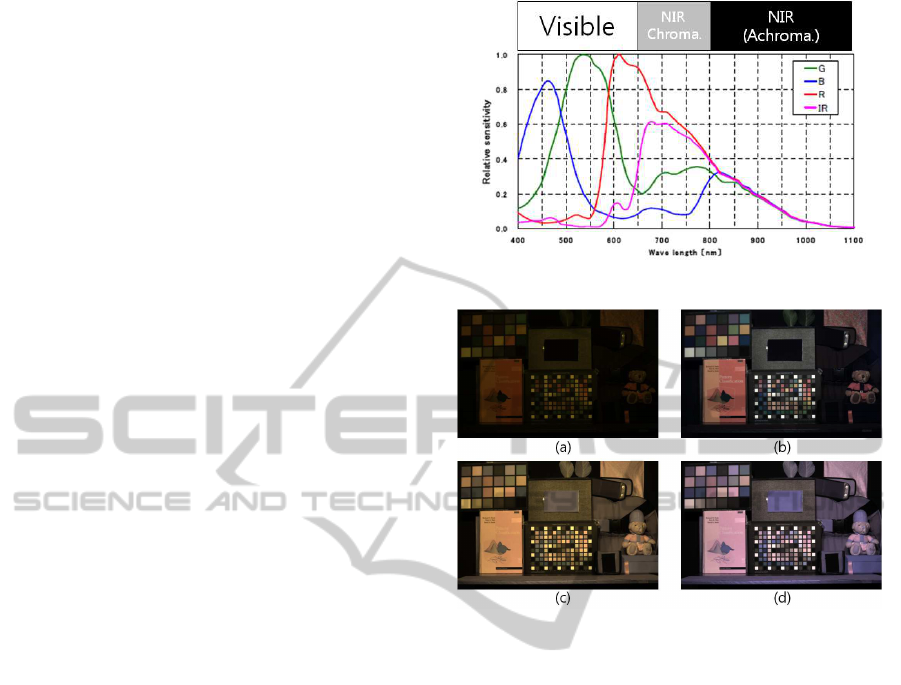
Figure 3: The spectral response of the MSFA image sensor.
Figure 4: The color observation of the MSFA image sensor
under incandescent light. (a) Image captured with IRCF.
(b)(a) with color constancy. (c) Image captured with IRCF
removal MSFA image sensor. (d) (c) with color constancy.
with and without an IRCF, respectively, the mixture
of the exclusive NIR band intensity to the visible
band intensity results in severe color distortion which
alters the original color observation in the visible
band.
Figure 4 describes the effect of the NIR band
intensity in the color image. When objects were
illuminated by an incandescent lamp, the image
sensor with IRCF obtained a yellowish image due to
the low color temperature of the illuminance. After
performing the white balance technique from a grey
color patch, a natural color image was obtained as
shown in Fig. 4(b). On the other hand, when the
IRCF was removed, the entire band of the image
sensor was utilized and a broad spectral band image
was observed. Due to additive NIR intensity in the
RGB channels, Fig. 4(c) appears more brighter than
Fig. 4(a) but shows low color saturation despite
applying white balance in Fig. 4(d).
To analyze the change of the chromaticity feature
obtained by the additional NIR, the RGB color space
was converted into a HSI color space as follows,
VISAPP2015-InternationalConferenceonComputerVisionTheoryandApplications
32

Figure 5: RGBN channel correlation in the NIR band above
800nm. (a) N
nir
vs R
nir
. (b)N
nir
vs G
nir
. (c) N
nir
vs B
nir
.
H = cos
−1
{
1
2
[(R− G) + (R− B)]
[(R− G)
2
+ (R− B)(G− B)]
1/2
}(4)
S =
I − a
I
where a = min[(R, G,B)],
I =
R+ G+ B
3
,
where min(·) represents the minimum value
among the three values. In Fig. 3, the NIR band
is divided into two sub bands: we defined these sub
bands as a chromatic NIR band (650nm 800nm) and
an achromatic NIR band (800nm 1100nm), respec-
tively. Figure 5 shows that the responses of the achro-
matic NIR bands were identical to each other. Based
on this characteristic of the CMOS sensor in the NIR
achromatic band, we defined these responses as con-
stant at each pixel, such as R
nir(achr)
= G
nir(achr)
=
B
nir(achr)
= δ. As a result, the RGB intensities at a
pixel position in Eq. (2) were represented as:
R(i, j) = R
chr
(i, j) + δ(i, j) (5)
G(i, j) = G
chr
(i, j) + δ(i, j)
B(i, j) = B
chr
(i, j) + δ(i, j)
where R
chr
,G
chr
,B
chr
represent the chromatic col-
ors of the image sensor under 800nm wavelength.
With the RGB color values with offset δ, the inten-
sity of the observed color was defined as follows:
I =
[(R
chr
+ δ) + (G
chr
+ δ) + (G
chr
+ δ)]
3
(6)
= I
chr
+ δ,
where I
chr
= (R
chr
+ G
chr
+ B
chr
)/3 is the intensity of
the chromatic spectral band of the image sensor. The
intensity of the IRCF removed MSFA image sensor is
changed by the amount of the offset value. The hue
value in Eq. (4) was redefined as:
H = cos
−1
{
1
2
[(R−G)+(R−B)]
[(R−G)
2
+(R−B)(G−B)]
1/2
}, (7)
= cos
−1
{
1
2
[(R
chr
−G
chr
)+(R
chr
−B
chr
)]
[(R
chr
−G
chr
)
2
+(R
chr
−B
chr
)(G
chr
−B
chr
)]
1/2
}.
Because the achromatic offset value δ was re-
moved during subtraction, the identical offset on the
RGB channels did not change the hue value. Finally,
the saturation value became:
S =
I− a
I
=
I
chr
− a
chr
I
=
I
chr
I
· S
chr
,
where S
chr
= (I
chr
− a
chr
)/I
chr
represents the satu-
ration of the chromatic spectral band of the image sen-
sor and a
chr
= min(R
chr
,G
chr
,B
chr
). Since the range
of
I
chr
I
was 0≤
I
chr
I
≤ 1, the saturation of the image ob-
tained by the IRCF removed MSFA image sensor was
degraded and became smaller than the image obtained
by the chromatic spectral band of the image sensor.
3 PROPOSED METHODS
The purpose of the proposed method is to restore
the original color in the visible band from the mixed
wide band signal. However, color restoration in the
spectral domain is an under-determined problem, as
described in Eq. (2). Since MSFA image sen-
sors have additional pixels whose intensity was rep-
resented in Eq. (2), this under-determined problem
can be redefined with eight unknown spectral values.
From Eq.(1), the observed intensity vectors of the
multi-spectral images can be represented as C(i,j) =
[R(i,j),G(i, j), B(i,j),N(i,j)]
T
. To focus on the color
restoration at each pixel position, we assumed the spa-
tially sub-sampled MSFA image was already interpo-
lated. As a result, there were four different intensities
at each RGBN pixel position.
In Fig. 3, the spectral response of each channel
is described with the corresponding RGB and N val-
ues. The energy of the NIR band was obtained by the
RGB color filters as well as the N filter. Similarly, the
large amount of the energy in the visible band was ob-
tained by the N channel. By considering the observed
multi-spectral intensity vector C(i,j), the spectral cor-
relation between the channels in the visible band and
the NIR band resulted in a mixture of exclusive re-
sponses in each channel as represented in Eq. (2).
From the sub-spectral band intensity mixture
model, the color restoration problem was defined
to find the unknown visible band intensity values
R
vis
,G
vis
,B
vis
from the observed intensity values R, G,
ColorRestorationforInfraredCutoffFilterRemovedRGBNMultispectralFilterArrayImageSensor
33

B, N which contained the unknown NIR band inten-
sity values and the unknown visible intensity values.
3.1 Sensor Spectral Response Function
Modeling
To restore the RGB channels corrupted by NIR
band spectral energy, the additional NIR band
components(R
nir
, G
nir
, B
nir
) in the RGB channels had
to be removed:
R
vis
= R− R
nir
(8)
G
vis
= G− G
nir
B
vis
= B− B
nir
N
vis
= N− N
nir
Since the spectral response function of the RGBN
filter was not defined only in the NIR band, we used a
signal processing approach to estimates the NIR band
response. To decompose the spectral information of
the RGBN channel, the unknown value N
vis
or N
nir
had to be estimated. To cope with the different char-
acteristics of the correlation in the visible band as
well as the NIR band, we set the correlation model
in each subband, separately. In the visible band, the
RGB channel filters showed different peak spectral re-
sponses while the N channel filter covered all spectral
ranges without an outstanding peak. As a result, the
N channel filter response function was modeled as a
linear combination of the others:
N
vis
=
Z
700
400
ω
r
(λ)E(λ)R
(r)
(λ)S(λ)dλ (9)
+
Z
700
400
ω
g
(λ)E(λ)R
(g)
(λ)S(λ)dλ
+
Z
700
400
ω
b
(λ)E(λ)R
(b)
(λ)S(λ)dλ
where ω
r
(λ), ω
g
(λ), and ω
b
(λ) represent the coeffi-
cients that show cross-correlations in the visible band.
Since the spectral response of the N channel in the
visible band covered a wide spectral range without an
outstanding peak, those coefficients were constrained
to be constant in terms of the wavelength (Park and
Kang, 2004). Using the constrained weights, the in-
tensities of the N channel in the visible band were ap-
proximated as follows:
N
vis
(i,j) ≈ ω
r
· R
vis
(i,j) (10)
+ω
g
· G
vis
(i,j) + ω
b
· B
vis
(i,j),
where ω
r
,ω
g
, and ω
b
represent the visible band cross-
correlation coefficients obtained by the linear trans-
formation model: x
′
= Mx, where M represents a 1
by 3 matrix describing the mapping between the RGB
to N channel values. The transformation M was ob-
tained by a least square solution. The weight function
was of any arbitrary form caused by the illuminance
change and the spectral response of the sensor. As a
result, the function ω depended not on the spectrum λ
itself but on the spectral response of the illuminance
and the sensor.
In the NIR band where the spectral correlations
between the RGBN filters were high, there were num-
bers of coefficient sets in the application of the spec-
tral decimation model. For instance, consider an ex-
treme case of a single weight for one channel and
zeros for the others or evenly distributed weights.
Among a variety of solutions, we used visible band
weights where the selection was a key to the relation
between the exclusive two spectral bands. To cope
with the different energy ratio in the visible and the
NIR bands, the response of the N channel in the NIR
band was:
N
nir
(i,j) ≈ β
v,n
· (ω
r
· R
nir
(i,j) (11)
+ω
g
· G
nir
(i,j) + ω
b
· B
nir
(i,j))
where β
v,n
is the inter-spectral correlation coefficient
that considers the energy balance between the visible
band and the NIR band. When we decomposed the
spectrally decomposed N channel in the visible and
NIR bands, the given N channel was represented by
the RGB channel intensities in the visible and NIR
bands from Eq. (10) and Eq. (11).
N = N
vis
+ N
nir
(12)
= ω
r
· (R
vis
+ β
v,n
· R
nir
) + ω
g
· (G
vis
+β
v,n
· G
nir
) + ω
b
· (B
vis
+ β
v,n
· B
nir
)
In Eq. (12), the observed N channel is described
with unknown RGB values in the visible band and the
NIR band. Therefore, we obtained the decomposed
N channel indirectly from Eq. (12). Corresponding
to the spectral response of the N channel, we defined
the artificial N channel which was made by using the
observed RGB channels and the inter-channel coeffi-
cients in Eq. (10).
ˆ
N = ω
r
· R+ ω
g
· G+ ω
b
· B (13)
= ω
r
· (R
vis
+ R
nir
) + ω
g
· (G
vis
+ G
nir
)
+ω
b
· (B
vis
+ B
nir
)
Since the coefficients were designed to fit the N
channel in the visible band, the estimated luminance
resembled the N channel model in the visible band
but not in the NIR band. Therefore, the N channel
was decomposed into the visible and NIR bands by
subtracting the original N channel in Eq. (12) and the
artificial N channels
ˆ
N in Eq. (13):
VISAPP2015-InternationalConferenceonComputerVisionTheoryandApplications
34

Figure 6: RGBN channel correlation in the NIR band. (a)
N
nir
vs R
nir
. (b)N
nir
vs G
nir
. (c) N
nir
vs B
nir
.
N−
ˆ
N = ω
r
· (β
v,n
− 1) · R+ ω
g
· (β
v,n
− 1) · G (14)
+ω
b
· (β
v,n
− 1) · B
= (β
v,n
− 1) · (ω
r
· R
nir
+ ω
g
· G
nir
+ ω
b
· B
nir
)
=
β
v,n
− 1
β
v,n
·
ˆ
N
nir
= K·
ˆ
N
nir
where K =
β
v,n
−1
β
v,n
is a scaling factor ,and
ˆ
N
nir
rep-
resents the artificial N channel of NIR band from Eq.
(11). Based on Eq. (14), we decomposed the spec-
tral response of the N channel into the two different
channels, the visible band and the NIR band. The N
channel information in NIR band was recovered from
the N channel that contained the energy of the entire
spectrum of the image sensor. As a result, the decom-
posed N channel intensities in the NIR band and the
RGB channel intensities in the NIR band were esti-
mated from the result of Eq. (14). In Fig. 6, the
relationship of the RGB channel intensities and the
N channel intensity of 96 color patches of the Gretag
color checker SG in the NIR band is represented. As
described in the figure, they are asymptotically linear
in the NIR band. From this correlation, the decom-
posed NIR band value of the RGB channel in the NIR
band is defined as follows:
ˆ
R
nir
= α
r
·
ˆ
N
nir
(15)
ˆ
G
nir
= α
g
·
ˆ
N
nir
ˆ
B
nir
= α
b
·
ˆ
N
nir
where α
r
, α
g
, and α
b
represent the coefficients that
show the linear correlation between the RGB chan-
nels and the N channel in the NIR band. From the
equation, the intensities of the RGB channel in the
NIR band were estimated and this color restoration
model was processed with a single matrix transfor-
mation of:
(
ˆ
R
vis
,
ˆ
G
vis
,
ˆ
B
vis
)
T
= M · (R, G, B,N)
T
, (16)
where M is
M = E+
1
K
AW, (17)
where W is the N channel decomposition matrix,
A is the RGB channel decomposition matrix, and E is
a 3 by 4 matrix of zeros, with 1s along the leading di-
agonal. The N channel decomposition matrix W was
defined as:
W =
ω
r
ω
g
ω
b
−1
ω
r
ω
g
ω
b
−1
ω
r
ω
g
ω
b
−1
ω
r
ω
g
ω
b
−1
, (18)
and the RGB channel decomposition matrix was de-
fined as:
A =
α
r
0 0 0
0 α
g
0 0
0 0 α
b
0
. (19)
Based on Eq. (17), the unified matrix M was:
M =
α
r
·ω
r
+K
K
α
r
·ω
g
K
α
r
·ω
b
K
−
α
r
K
α
g
·ω
r
K
α
g
·ω
g
+K
K
α
g
·ω
b
K
−
α
g
K
α
b
·ω
r
K
α
b
·ω
g
K
α
b
·ω
b
+K
K
−
α
b
K
(20)
where K =
β
v,n
−1
β
v,n
is a scaling factor in Eq. (14),
ω
r
(λ),ω
g
(λ),ω
b
(λ) are the coefficients for the linear
combination in Eq. (9) and α
r
, α
g
, and α
b
are the co-
efficients that represent the linear correlation between
the RGB channels and the N channel in the NIR band
in Eq. (15). The color restoration matrix restored the
visible band intensity values from the observed cross-
correlated RGBN valueswhere the matrix coefficients
were given by the visible band cross-correlation coef-
ficients and the spectral cross-correlation coefficient.
4 EXPERIMENTAL RESULTS
We tested the method with several images captured
under various lighting conditions: sunlight, incandes-
cent lamp, and fluorescent lamp. For the training set
for the correlation coefficients, we used the standard
colors in the Macbeth SG color checkerboard.
In Figs. 8 (a) and (b), the visible band images
observed by the MSFA sensor without and with the
IRCF are depicted, respectively. In the figures, the
effect of the NIR band energy on the color hue and
saturation in all colors in color patches can be shown.
Moreover, color degradation was highly distinctive in
some materials such as fabrics since the NIR band
energy had more effect on these materials. In Fig.
8(c), the result of the conventional method (G. D. Fin-
layson and Hubel, 2001) is described where the color
saturation is far better than in Fig. 8(a). However,
ColorRestorationforInfraredCutoffFilterRemovedRGBNMultispectralFilterArrayImageSensor
35
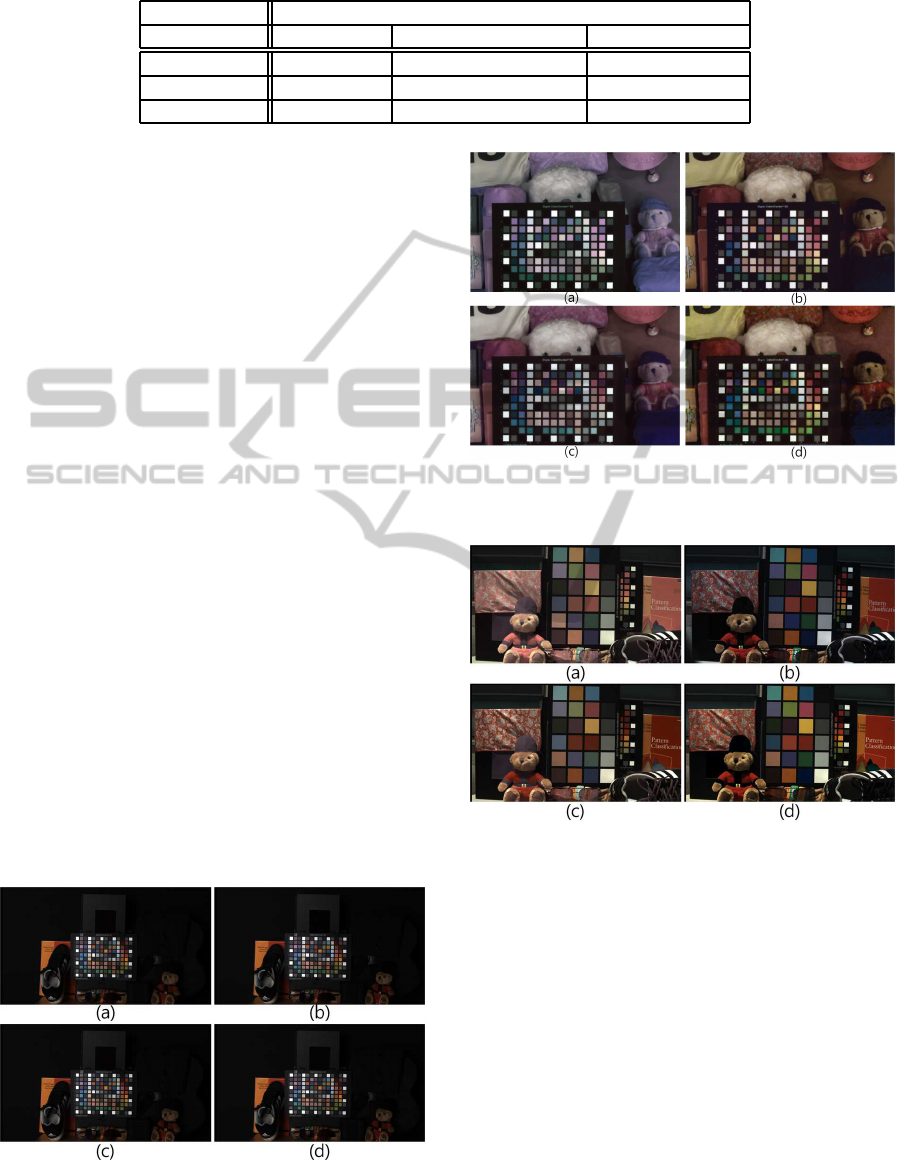
Table 1: Average angular error.
Average angular error (x10
−
2)
Input image Conventional method Proposed method
Fluorescent 0.7651 0.7996 0.7716
Sunlight 6.9688 2.9261 1.5253
Incandescent 28.7329 7.7961 4.2263
the color saturation is still low with the high NIR
reflectance materials, such as the yellow T-shirt and
the black hat of the doll. In Fig. 8(d), the proposed
method shows greater improvementsthan the conven-
tional method with the vivid colors in the SG color
chart and in the NIR sensitive materials. When com-
pared with the visible band image in Fig. 8(b), the
proposed method produces colors much more simi-
lar to the visible band color in both color patches and
other materials.
In Fig. 7, the experimental results obtained un-
der fluorescent lamp with 350lx illumination are de-
picted. Since the fluorescent lamp did not emit NIR
band energy, the input image in Fig. 7 (a) and the
optical filtered image in Fig. 7 (b) were almost the
same. Because there was no distortion caused by the
NIR band spectral energy in the input image, the pro-
posed method in Fig. 7 (d) preserved the color of the
input image. Figure 9 shows the experimental results
in sunlight. Sunlight contains a wide range of spectral
distribution and plenty of visible band information. In
this case, we restored color with the proposed method
in Eq. (20). When comparing figures 9 (c) to (d),
the resulting image of the proposed method restored
the distorted color well, especially the materials with
high reflectance in the NIR band.
To demonstrate the similarity of the restored col-
ors to the original visible band colors, the well known
matric called angular error was used (K. Barnard and
Funt, 2002). In this measurement, the color difference
was calculated by the angle between the two color
Figure 7: Experimental results under fluorescent lamp. (a)
Input image. (b) Optical filtered visible band image. (c) LS
based conventional method. (d) Proposed method.
Figure 8: Experimental results under incandescent lamp. (a)
Input image. (b) Optical filtered visible band image. (c) LS
based conventional method. (d) Proposed method.
Figure 9: Experimental results under sunlight. (a) Input
image. (b) Optical filtered visible band image. (c) LS based
conventional method. (d) Proposed method.
vectors. In this estimation, the standard color patches
and the colors in the fabric and in the leather were
used as representatives.
In table 1, the average angular error of the stan-
dard color patches with a variety of light sources is
described. The performance of the proposed method
is well confirmed visually for materials with a large
reflectance in the NIR band.
VISAPP2015-InternationalConferenceonComputerVisionTheoryandApplications
36

5 CONCLUSIONS
In this paper, a color restoration algorithm for an
IRCF removed MSFA image sensor was proposed.
For the spectrally degraded color information with
RGB channels, the spectral estimation and spectral
decomposition methods were used to the remove ad-
ditional NIR band spectral information. Based on the
filter correlation, the inter-channel correlations on the
visible and NIR bands were assumed, respectively.
When the N channel was decomposed into the visible
and the NIR band information, the RGB channel in
the visible band was finally restored with spectral de-
composition. The experimental results show that the
proposed method effectively restored the visible color
from the color degraded images caused by IRCF re-
moval.
ACKNOWLEDGEMENTS
This work was supported by the National
Research Foundation of Korea (NRF) grant
funded by the Korea government (MSIP) (No.
2012R1A2A4A01003732).
REFERENCES
D. Yi, R. Liu, R. C. Z. L. and Li, S. Z. (2007). Face match-
ing between near infrared and visible light images.
In Proc. IAPR/IEEE International Conference on Bio-
metrics on.
Fredembach, C. and Susstrunk, S. (2008). Colouring the
near-infrared. In IS&T/SID 16th Color Imaging Con-
ference. SPIE.
Fredembach, C. and Susstrunk, S. (2009). Illumination
estimation and detection using near infrared. In
SPIE/IS&T Electronic Imaging, Digital Photography.
SPIE.
G. D. Finlayson, S. D. H. (2000). Improving gamut map-
ping color constancy. IEEE Transactions on Image
Processing, 9(10).
G. D. Finlayson, S. D. H. and Hubel, P. M. (2001). Color
by correlation: a simple, unifying framework for color
constancy. IEEE Transactions on Pattern Anal. and
Machine Intell, 23(11).
J. Choi, K. Y. and Kim, Y. (2011). A new adaptive
component-substitution-based satellite image fusion
by using partial replacement. IEEE Transaction on
Geoscience and Remote Sensing on, 49(1).
K. Barnard, V. C. and Funt, B. (2002). A comparison
of computational color constancy algorithms - part i:
methodology and experiments with synthesized data.
IEEE Transactions on Image Processing, 11(9).
Kumar, A. and Prathyusha, K. V. (2009). Personal au-
thenticatoin using hand vein triangulation and knuckle
shape. IEEE Transactions on Image Processing on,
18(9).
L. Schaul, C. F. and Susstrunk, S. (2009). Color image de-
hazing using the near-infrared. In IEEE International
Conference on Image Processing. IEEE.
M. Kise, B. Park, G. W. H. K. C. L. and Windham, W. R.
(2010). Multispectral imaging system with inter-
changeable filter design. Computers and Eloctronics
in Agriculture, 72(2).
Park, J. H. and Kang, M. G. (2004). Spatially adaptive
multi-resolution multispectral image fusion. Interna-
tional Journal of Remote Sensing on, 25(23):5491–
5508.
S. Koyama, Y. Inaba, M. K. and Murata, T. (2008). A day
and night visoin mos imager with robust pphotonic-
crystal-based rgb-and-ir. IEEE Transactions on Elec-
tron Devices, 55(3).
S. Matsui, T. Okabe, M. S. and Sato, Y. (2010). Image en-
hancement of low-light scenes with near-infrared flash
images. In Lecture Notes in computer Science: Com-
puter Vision. SPIE.
S. Z. Li, C. RuFeng Chu, L. S. and Lun, Z. (2007). Illumi-
nation invariant face recognition using near-infrared
images. IEEE Transactions on Pattern Analysis and
Machine Intelligence on, 29(4).
Salamati, N. and Susstrunk, S. (2010). Material-based ob-
ject segmentation using nir information. In IS& T/SID
18th Color Imaging Conference on. SPIE.
X. Hao, H. Chen, C. Y. N. Y. H. B. and Wang, C. (2010).
A near-infrared imaging method for capturing the in-
terior of a vehicle through windshield. In 2010 IEEE
Southwest Symposium on Image Analysis & Interpre-
tatioin on. IEEE.
ColorRestorationforInfraredCutoffFilterRemovedRGBNMultispectralFilterArrayImageSensor
37
