
Classification of the Heart Auscultation Signals
Primož Kocuvan
1
and Drago Torkar
2
1
Faculty of computer and information science, University of Ljubljana, Tržaška cesta 25, 1000 Ljubljana, Slovenia
2
Jožef Stefan Institute, Jamova cesta 39, 1000 Ljubljana, Slovenia
Keywords: Heart Auscultation, Digital Stethoscope, Pattern Recognition, Machine Learning, Classification.
Abstract: Listening to the internal body sounds (auscultation) is one of the oldest techniques in medicine to diagnose
heart and lung diseases. The digital heart auscultation signals are obtained with digital electronic
stethoscope and can be processed automatically to obtain some coarse indications about the heart or lung
condition. There are many ways of how to process the auscultation signals and quite some were published in
the last years. In this paper we present one possible set of methods to reach the goal of heart murmur
recognition up to the level to distinguish between the pathological murmurs from the physiological ones.
The special attention was devoted to signal feature selection and extraction where we used the distribution
of signal power over frequencies as the key difference between the normal and the pathological murmurs.
The whole procedure including the signal processing, the feature extraction and the comparison of four
machine learning classification methods is adequately described. It was tested on a balanced and on an
unbalanced dataset with the best achieved classification accuracy of 87.5%.
1 INTRODUCTION
A heart is a muscular organ which pumps blood with
oxygen and vital minerals to the various cells of the
body. One heart beat consists of the first heart sound
(S1) followed by systolic interval when the heart is
in the contraction mode, followed by the second
heart sound (S2) and the last diastolic interval when
the heart fills with blood. The first heart sound and
the second heart sound are produced when the
atrioventricular and semilunar valves snap shut
(Walker et al, 1990).
In this research we focus on a task to separate the
pathological heart murmur possibly caused by a
heart disease from a physiological murmur caused
by other internal organs. This is the first step toward
detection of various valvular heart diseases,
particularly the aortic stenosis which is the common
diagnosis by physicians. Valvular heart diseases can
occur throughout the human life because of the
stress, eating habits or smoking. In some small
amount they can develop even before birth. The
physicians can detect these abnormal heart sounds or
heart murmurs with a stethoscope but only a trained
physician with many years of experience can
diagnose more complex heart diseases correctly.
There exist much more reliable but also more
expensive tests such as echocardiography, x-ray or
electrocardiography for diagnosis of the heart
disorders which are used as the last resources in the
hierarchy of tests. Clinical practice shows that
family doctors on the primary level often lacks the
necessary training and experience and send patients
to further examinations to hospitals even when this
is not needed (Haney et al, 1999).
In our country, we have long waiting queues in
healthcare caused also by wrong decisions on the
primary level. It could be useful for the family
doctors to have an intelligent device or a system able
to correctly classify the sound signals from a
stethoscope and thus assisting the physicians in
making the right decisions. Such an instrument
could serve also as a domestic appliance for first
indication that something is wrong with the heart.
In this paper we present preliminary results
achieved by using a previously not used (up to our
knowledge) method for feature extraction and four
different machine learning classification methods for
pathological murmur detection in pre-processed
auscultation signals from a digital stethoscope.
534
Kocuvan P. and Torkar D..
Classification of the Heart Auscultation Signals.
DOI: 10.5220/0005264005340539
In Proceedings of the International Conference on Health Informatics (HEALTHINF-2015), pages 534-539
ISBN: 978-989-758-068-0
Copyright
c
2015 SCITEPRESS (Science and Technology Publications, Lda.)
2 PRE-PROCESSING AND
FILTERING
The heart auscultation signals should be pre-
processed in order to filter out the unwanted noise
caused by other internal organs in the body
(Ahlström, 2006).
2.1 Normalization
Normalization is a basic statistical operation. It's
used to scale heterogeneous sets of data to the same
interval, so that they could be compared relevantly.
The normalization is necessary for the consistency
of data. This is important when we determine the
threshold.
In the case of the sound signals from an
electronic stethoscope, we normalized the amplitude
of each digital signal using the normalization
equation (1).
n
yi
yi=
max y i
(1)
Where
is a normalized signal amplitude of an
i-th sample, is a digital signal amplitude of a i-
th sample and max
|
|
is the absolute maximal
value of the signal y.
2.2 Filtering
In the filtering step, we have used the Butterworth
low pass filter, one of the widely used filters in
signal processing. The cut-off frequency has been
set to 100 Hz because most of the heart murmurs are
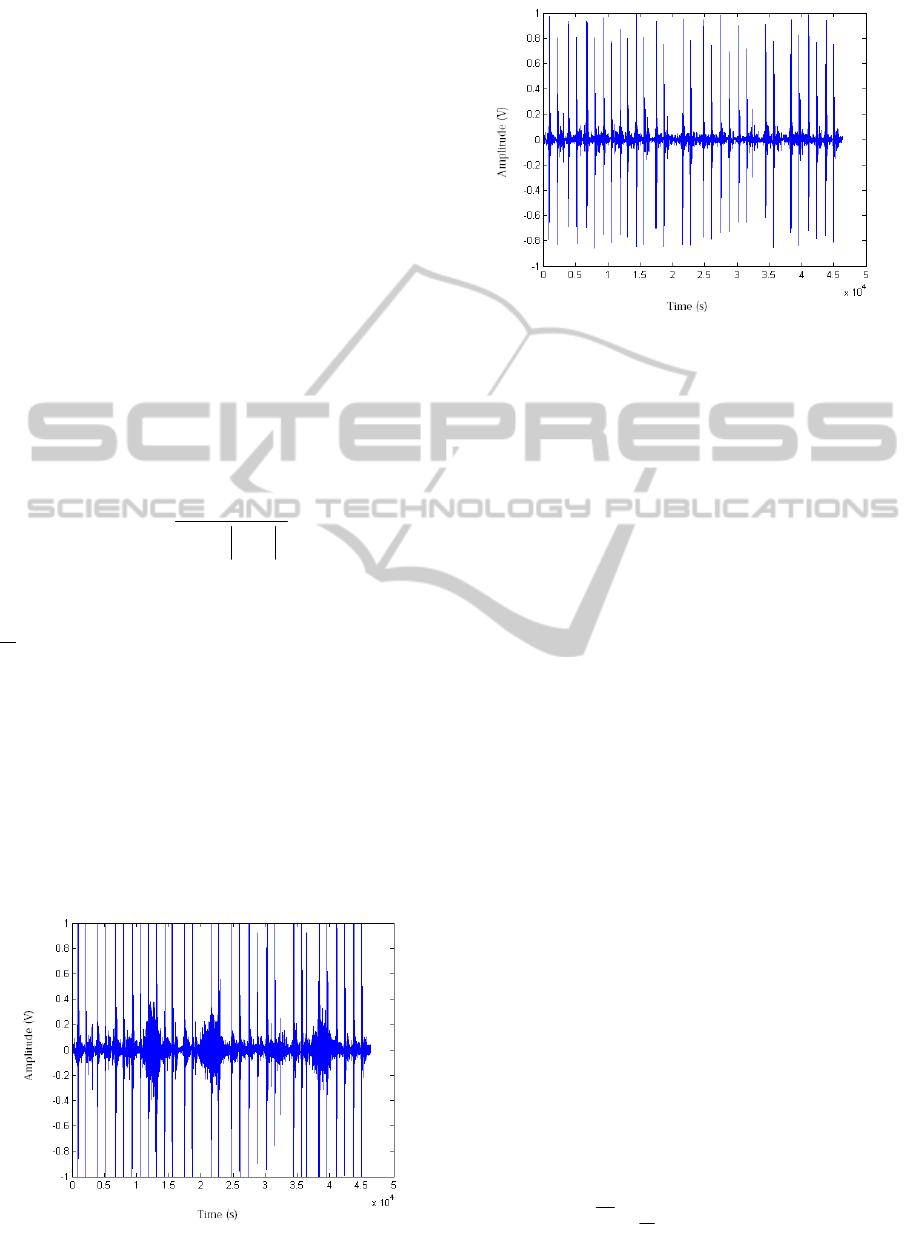
above 100 Hz. With this process step the murmurs
should be removed from the signal, as shown on the
two graphs in Figure 1 and Figure 2.
Figure 1: Original heart auscultation signal.
Figure 2: Filtered heart auscultation signal by Butterworth
low pass filter.
We have removed the heart murmurs only because
the extraction of S1 and S2 heart sounds is much
more efficient this way.
3 FEATURE EXTRACTION
Before the classification can take place we must
extract the appropriate features from the signal.
During the auscultation a physician tries to identify
the main constituents of a cardiac cycle, like systolic
and diastolic period together with S1 and S2 heart
sounds and then he/she tries to analyse related
features such as rhythm, timing instants, intensity of
heart sound components, splitting of S2, etc. This
analysis allows him/her to search for murmurs and
sound abnormalities that might correspond to
specific cardiac pathologies (Hedayioglu, 2009).
Similarly, the automatic feature extraction procedure
must do the same. We locate the S1 and the S2
sounds (and consequently the systolic and the
diastolic period) in the original signal by first
computing the normalized average Shannon energy
of the signal (Liang et al, 1997). Then we employ
the Burg's power spectral density method to extract
power spectral density estimates from the systolic
and diastolic periods of the original signal, and to
use them in classification algorithms.
3.1 Average Shannon Energy
First we compute the average and the standard
deviation of the phonocardiogram with n samples
which is needed to standardize the signal [5].
1
1
n
i
i=
y= yi
n
(2)
ClassificationoftheHeartAuscultationSignals
535
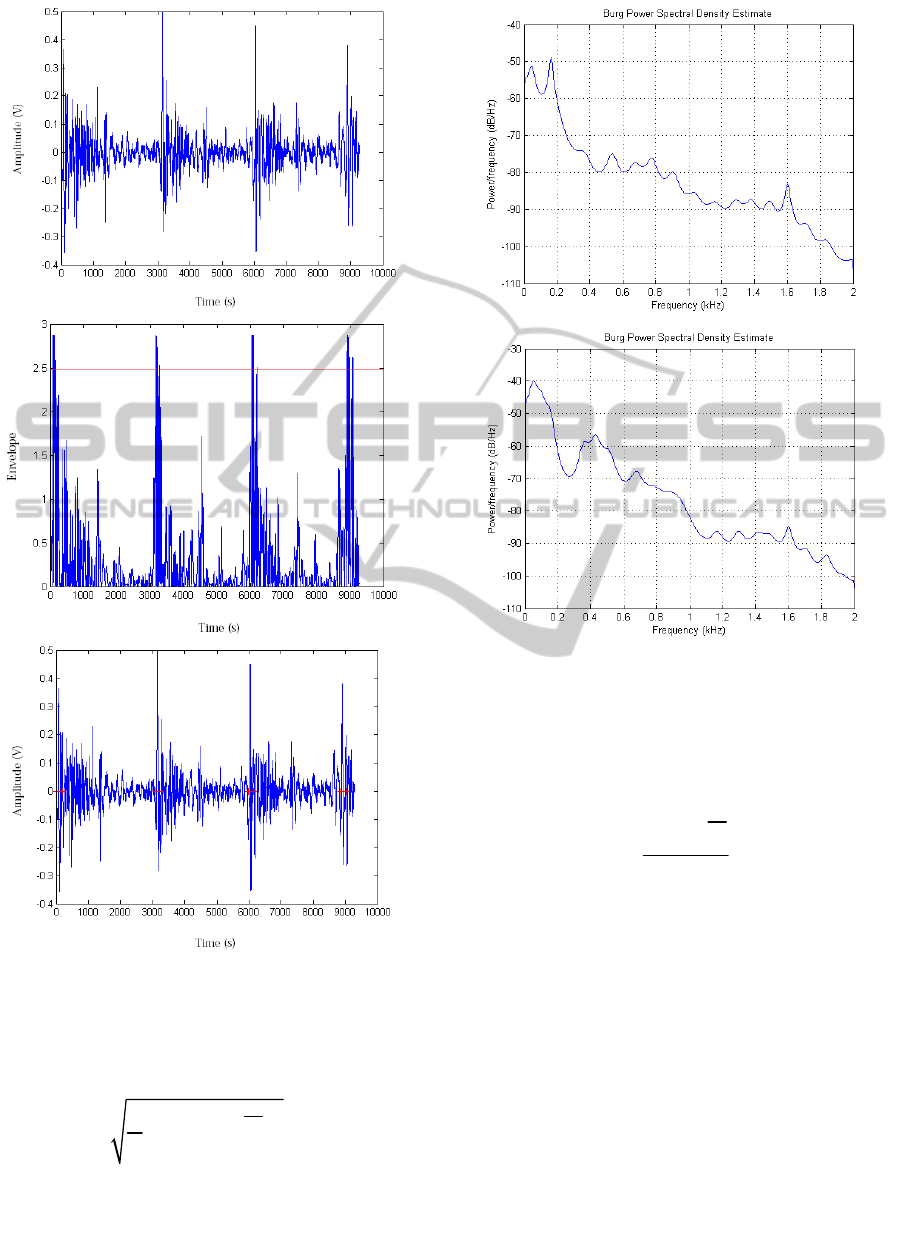
Figure 3: The original heart auscultation signal (top), its
average Shannon energy with an appropriate threshold line
(middle), and the detected locations of S1 and S2 sounds
(red crosses) defining the systolic and diastolic periods in
the original signal (bottom).
2
1
1
n
i
i=
=yiy
n
(3)
Shannon energy is defined by the equation (4).
2
2
logEi= yi yi
(4)
Figure 4: The Burg power spectral density of a heart
auscultation signal between S1 and S2 in the case of
pathological murmur (top) and in the case of physiologic
murmur (bottom).
The last step is to standardize the whole signal using
(Atbi and Debbal, 2013).
i
n
Ei y
Ei=
(5)
Now we get an average Shannon energy. If we plot
the signal (Figure 3), we can clearly see the S1 and
the S2 heart sounds which also correspond to the
peaks in the original signal. Setting the threshold is
done manually by experimenting for each set of
signals. It depends on particular stethoscope
involved and its settings.
3.2 Power Spectral Density
The nature is full of non-deterministic (stochastic)
processes like the weather, the stock market, speech
sound waves etc. Biomedical signals such as ECG,
EEG are also of stochastic nature indicating that an
appropriate method for analysis should be used. It
HEALTHINF2015-InternationalConferenceonHealthInformatics
536

turns out that the signal power is distributed
differently over frequencies in the case of the
pathological murmur than in the case of the
physiological murmur (Figure 4). We used this fact
to define the features used for classification.
For feature extraction we have chosen the Burg's
parametric method for power spectral density
estimation which is also used in geographical data
processing, radio astronomy and biomedicine
(Shradhanjali, 2013). It is a generalisation of the
Fourier analysis. It returns a vector of different size
for even and for odd number of frequency domain
parameters (nfft): (nfft/2)+1 for even and (nfft+1)/2
for odd. We have set nfft to 512 which is used in
speech recognition. Every parameter represents a
power per unit frequency. We applied the Burg's
method on extracted systolic and diastolic intervals
of the original signal y. Although it is possible to
diagnose different heart diseases within these
intervals such as aortic stenosis, mitral stenosis,
aortic regurgitation and mitral regurgitation, we
limited our research at this stage only to distinct
abnormal (pathological) murmur from normal
(physiological) murmur. The upper graph in Figure
4 represents an interval between S1 and S2 of a
patient with pathologic murmur while the lower one
represents an interval with physiologic murmur. The
graphs show the slight variation of power
distribution over frequencies which must be detected
by a classification algorithm.
4 CLASSIFICATION METHODS
The heart auscultation signals were taken from the
web accessible database (Bentley et al, 2011). We
used the dataset B (normal, murmur) consisting of
266 samples (100 normal, 166 murmur). Pre-
processing, filtering and feature extraction was done
in Matlab. For testing the classification algorithms
we used the Orange open source platform
(http://orange.biolab.si).
We tested four machine learning algorithms
belonging to supervised learning methods in order to
find the most suitable one for classification of the
heart auscultation signals. We performed two
experiments for each method: with a balanced set
(100 – 100) and with an unbalanced set (100 – 166).
In all cases the available data was firstly
randomized and then divided into training set (70%)
and test set (30%).
4.1 K-NN
K-nearest neighbour algorithm is the simplest
machine learning algorithm used for classification
and regression. An object represented by selected
features is classified by a majority vote of its
neighbours in feature space, with the object being
assigned to the class most common among its k
nearest neighbours (k > 0). In our case, the euclidian
distance was used to measure the distance of an
object to its neighbours.
4.2 Support Vector Machine
SVM algorithm searches for a hyper-plane which
optimally separates the data classes. Each object is
represented by a feature vector in high-dimensional
vector space. The location of the hyper-plane is
mainly defined by the closest training vectors called
support vectors while the faraway vectors are
neglected. SVM can be used for classification,
regression, or other tasks. It is relatively new ML
algorithm invented by Vladimir N. Vapnik in 1993.
This method has wide variety of applications in hand
writing recognition and also in medical data.
4.3 Artificial Neural Networks
ANN is a black box computational model composed
of neurons as in nerve cells, and synapses as the
connections between the neurons. There exist a lot
of different architectures of artificial neuron
networks, but we used one of the simplest topology
called multi-layered perceptron which has an input
layer, a hidden layer and an output layer. The
connections among the neurons are weighted.
During the training process these weights are
automatically adjusted by a backpropagation
algorithm so that the difference between the actual
and the desired output is minimal. We say that ANN
is a black box since it can be viewed in terms of its
input, output and transfer characteristics without any
knowledge of its internal workings.
4.4 Logistic Regression
In spite of the misleading name this technique is
used for classification and not for regression. It is a
probabilistic statistical classification model relying
heavily on the logistic (sigmoid) function. Logistic
regression is used in various fields including social
sciences and medicine.
ClassificationoftheHeartAuscultationSignals
537

5 RESULTS
5.1 Parameters Setup
The parameters of the tested classification
algorithms were optimized experimentally by trial
and error and are thus not strictly optimal but due to
experimental results no significant improvement can
be expected by computational optimization.
For the K-NN algorithm the parameters were set
to:
- number of neighbours: 5,
- metrics: euclidian,
- normalize continuous attributes.
For the SVM the parameters were:
- SVM type: C-SVM,
- kernel : polynomial,
- numerical tolerance: 0,0020.
In the case of the neural network the parameters
were:
- hidden layer neurons : 150,
- regularization factor: 0.5,
- max iterations: 5000.
For logistic regression we used:
- regularization: L2 squared weights,
- training error cost: 1.30.
5.2 Classification Results
For each method we calculated standard
classification measures: the classification accuracy
(CA), sensitivity (Sens), specificity (Spec) and area-
under-curve (AUC). Each method was tested two
times: on an unbalanced 266 samples dataset (166
positives and 100 negatives), and on a balanced, 200
samples dataset (100 positives and 100 negatives).
Each method was run 10 times and the best results
are presented in Table 1 and in Table 2.
Table 1: Comparison of the classification methods
performance on an unbalanced set of heart auscultation
signals (266 samples).
Method CA Sens Spec AUC
K-NN 0.8625 0.9500
0.60 0.8550
SVM 0.8375 0.9833 0.40 0.4367
Neural network 0.8375 0.9833 0.40 0.6450
Logistic regression
0.8750 1.0000
0.40 0.4367
Table 2: Comparison of the classification methods
performance on a balanced set of the heart auscultation
signals (200 samples).
Method CA Sens Spec AUC
K-NN
0.7679
0.8947
0.63
0.7833
SVM 0.6200 0.8167 0.63 0.5083
Neural network 0.7225
0.9333
0.45
0.8917
Logistic regression 0.6825 0.9333 0.45 0.6750
In the case of the unbalanced set the results are close
together in the sense of CA (within 4%) and
sensitivity (within 5%) but differ more in specificity
and AUC. The best performance showed LR which
detected all signals with murmur (Sens=1.00) and K-
NN which outperformed others in Spec and AUC,
thus is able to correctly classify an auscultation
signal with highest probability. Small AUC values
(in the case of SVM even below 0.5) indicate the
imbalance in data.
In the case of the balanced set the results are
much more dispersed for all measures and worse in
accuracy and sensitivity, but better in specificity and
AUC. The K-NN showed the best performance
regarding the accuracy and specificity while the
neural networks performed best regarding sensibility
and AUC.
Logistic regression and K-NN can be
implemented relatively easily and are suitable to be
integrated into digital stethoscope add-on device
while artificial neural networks are more demanding
and would probably need a server support.
6 CONCLUSIONS
We used digital signal processing, power spectral
density functions and machine learning techniques
to classify heart murmurs. The initial results are
promising and will definitely be improved in the
future. For instance, in the related field of speech
recognition it took many years of research to reach
the accuracy to about 90% (Kim and Stern, 2012).
Biomedical signals are patient dependent, same
as human speech, therefore the use of algorithms
from speech recognition area, like Hidden Markov
Model (HMM), seems to make sense. The recently
reported research on the topic (Zhong et al, 2013)
shows very promising accuracy (94, 2%).
In the future, we intend to test our approach more
extensively on more data recorded from different
types of patients (children, adults, elder) leading to
more reliable results. We will investigate also the
HEALTHINF2015-InternationalConferenceonHealthInformatics
538

direction towards HMM beginning with simpler
Markov models like Markov chain.
Furthermore, we want to investigate automatic
classification of various most common valvular
heart diseases, like aortic, mitral, tricuspid and
pulmonary valve stenosis and insufficiencies. We
see the main problem here to obtain the necessary
amount of medical data (phonocardiograms) with
attributes, like heartbeat rate, blood pressure and
sampling locations.
Besides the testing of different classification
algorithms, the future goal is also to find a
compromise between the classification accuracy and
the computational complexity in order to find the
most suitable method for implementation within the
device with the limited processing power (digital
stethoscope itself or mobile phone for example).
The current results suggest logistic regression or K-
NN method.
REFERENCES
Ahlström, C., 2006. Processing of the Phonocardiographic
Signal − Methods for the Intelligent Stethoscope.
Doctoral Thesis, Linkoping University, Institute of
techonology, Available at: http://www.diva-
portal.org/smash/get/diva2%3A22548/FULLTEXT01.
pdf.
Atbi, A., Debbal, S. M., 2013. Segmentation of
Pathological Signals Phonocardiogram by Using the
Shannon Energy Envelogram. AJCM, 2(1,2), 1-14.
Bentley, P., Nordehn, G., Coimbra, M., Mannor, S., 2011.
The PASCAL Classifying Heart Sounds Challenge
2011 (CHSC2011). Available at:
http://www.peterjbentley.com/heartchallenge/index.ht
ml.
Haney, I., Ipp, M., Feldman, W., McCrindle, B.W., 1999.
Accuracy of clinical assessment of heart murmurs by
office based (general practice) paediatricians, Archives
of Desease in Childhood, 81, 409-412.
Hedayioglu, F. L., Coimbra, M.T., Mattos S.S., 2009. A
survey of audio processing algorithms for digital
Stethoscopes. HEALTHINF, INSTICC Press, 425-429.
Kim, C., Stern, R. M., 2012. Power-Normalized Cepstral
Coefficients (PNCC) for robust speech recognition.
Proceedings of the 2012 IEEE International
Conference on Acoustics, Speech and Signal
Processing (ICASSP), Kyoto, 4101-4104.
Liang, H., Lukkarinen, S., Hartimo, I., 1997. Heart Sound
Segmentation Algorithm Based on Heart Sound
Envelolgram, Computers in Cardiology 1997, 7 – 10,
Available at:
http://ee.ucd.ie/~amoni/DARIUSPaperWarehouse/Lia
ng97Heart.pdf.
Shradhanjali, A., Chowdhury, S., Kumar, N., 2013. Power
Spectral Density Estimation of EMG Signals Using
Parametric and Non-Parametric Approach, Global
Advanced Research Journal of Engineering,
Technology and Innovation, 2(4), 111-117.
Walker, H. K., Hall, W. D., Hurst, J. W., 1990. Clinical
Methods, The History, Physical, and Laboratory
Examinations. Butterworths, 3
rd
edition, Emory
University School of Medicine, Atlanta, Georgia,
Boston.
Zhong L., Wan, J.,Huang, Z.,Cao, G., Xiao, B., 2013.
Heart Murmur Recognition Based on Hidden Markov
Model. Journal of Signal and Information Processing,
4, 140-144.
ClassificationoftheHeartAuscultationSignals
539
