
Quadriceps Muscle Fatigue and Comfort Generated by
Neuromuscular Electrical Stimulation with Current Modulated
Waveforms
Tiago Araújo
1
, Ana Anjos
2
, Neuza Nunes
3
, Pedro Rebelo
2
and Hugo Gamboa
1
1
Department of Physics, Faculty of Sciences and Technology, New University of Lisbon, Lisbon, Portugal
2
Schientific Area of Physiotherapy, Lisbon School of Health Tecnology, Polytecnic Institute of Lisbon, Lisbon Portugal
3
PLUX - Wireless Biosignals S.A., Lisbon, Portugal
Keywords: Fatigue, Neuromuscular Electrical Stimulation, Waveform.
Abstract: Introduction: Neuromuscular electrical stimulation (NMES) is used by physical therapists in the clinic. The
efficacy of NMES is limited by the rapid onset muscle fatigue. The role of NMES parameters is muscle
fatigue is not clear. Objective: To determine the effects of shape waveform on muscle fatigue, during
NMES. Methods: Twelve healthy subjects participated in the study. Subjects were assigned to 1 of 3 groups,
randomly. Group assignment determined the order in which they were tested using 3 different shape
waveforms. Maximal voluntary isometric contraction (MVIC) was measured during the first session.
Fatigue test was applied with amplitude required to elicit 50% of the MVIC. In each 3 testing sessions
torque of contraction and level comfort were measured, and percent fatigue was calculated. Analysis of
variance tests for dependent samples was used to determine the effect of shape waveform on muscle fatigue
and comfort scores Results: The results showed no one shape waveform was most fatigable and that SQ
wave induced more uncomfortable stimulus.
1 INTRODUCTION
Neuromuscular electrical stimulation is a commonly
used tool by physical therapists in sports and clinical
conditions characterized by motor impairments such
as stroke, cerebral palsy, and spinal cord injury
(Glinsky, Harvey and Van, 2007; Maffiuletti et al.,
2000; Newsam and Baker, 2004; Stackhouse et al.,
2007; Snyder-Mackler, Delitto and Stralka, 1994).
The common neuromuscular adaptations that
characterize the aforementioned conditions are
muscle weakness and atrophy resulting from disuse
or neurological injury (Maffiuletti, 2010; Snyder-
Mackler et al., 1994).
However, during electrical stimulation, skeletal
muscles fatigue more rapidly during repetitive
stimulation than during voluntary contractions
(Riener, 1999; Vanderthommen et al., 2003)
.
Muscle fatigue is defined as a reduction in the peak
force, with continuous and repeated activation
(Mulla, Sepulveda and Colley, 2011)
.
Rapid fatigue
during NMES is thought to result from the
differences in motor unit recruitment order, higher
activation frequencies and imprecise control of
muscle force comparing voluntary contractions
(Peckham and Knutson, 2005). The problem of
muscle fatigue is aggravated by the fact that
paralyzed muscle show greater fatigability than
healthy muscle. Muscle fatigue is an important
factor limiting the clinical use of NMES (Gerrits et
al., 2003).
New commercial stimulators provide many
different waveforms and pulse settings (Snyder-
Mackler et al., 1994; Kantor, Alon and Ho, 1994).
Researchers have attempted to identify preferred
stimulation settings in terms of force contraction
(Doucet, Lam and Griffin, 2012; Laufer, Ries and
Leninger, 2000), fatigue (Binder-Macleod and
Snyder- Mackler, 1993; Gorgey, Black, Elder and
Dudley, 2009; Kesar and Binder-Macleod, 2006)
and comfort (Kantor et al., 1994). The stimulation
variables that are thought to have the greatest impact
on muscle fatigue include pulse amplitude and
duration and pulse train frequency (Binder-Macleod
and Snyder Mackler, 1993; Doucet et al., 2012).
However, because the number of factors considered
in the different studies is extremely variable, is it
difficult to take definitive conclusions concerning
the optimal settings that can elicit the strongest
contractions with minimal fatigue.
92
Araújo T., Anjos A., Nunes N., Rebelo P. and Gamboa H..
Quadriceps Muscle Fatigue and Comfort Generated by Neuromuscular Electrical Stimulation with Current Modulated Waveforms.
DOI: 10.5220/0005267400920098
In Proceedings of the International Conference on Bio-inspired Systems and Signal Processing (BIOSIGNALS-2015), pages 92-98
ISBN: 978-989-758-069-7
Copyright
c
2015 SCITEPRESS (Science and Technology Publications, Lda.)

The independent effects of these 3 parameters on
muscle fatigue are still controversial. Conflicting
results exist on the role of current amplitude on
muscle fatigue: for instance while one study
demonstrates fatigue increasing with amplitude
(Binder-Macleod, Halden and Jungles, 1995), others
show no change in fatigue with increasing current
amplitude (Slade, Bickel, Warren and Dudley,
2003). In certain cases the frequency of pulses has
been shown to accelerate muscle fatigue (Gorgey et
al., 2009; Lieber and Kelly, 1993). Nonetheless, a
full understanding of the role of pulse duration on
muscle fatigue has not been reached.
Gorgey et al. (2009) concluded that altering the
pulse duration does not appear to influence fatigue
in NMES. Compared to the influence of current
amplitude, frequency and pulse duration, the role of
shape waveform on muscle fatigue is even less well
established.
According to the literature, the most efficient
stimulation of the nerve fiber is carried out using
square shape waveform (Robertson, Ward, Low and
Reed, 2006)
.
However, if pulse duration is
sufficiently short (250 µs or less) triangular shape
waveforms are functionally equivalent to square
waves (Robertson et al., 2006). Laufer et al. (2000)
showed stimulation with sinusoidal polyphasic
waveform resulted in more rapid muscle fatigue than
stimulation with square monophasic and biphasic
waveforms, both tested on quadriceps muscle in
individuals without impairment. In addition,
stimulation with polyphasic waveform elicited
weaker electrically induced contractions.
Another factor to take into consideration during
NMES, is the subjective comfort of stimulation.
Many previous studies attempted to determine
waveform parameters or combination of parameters
which caused the least subjective discomfort. In one
study, there was no simple answer, individuals
having their own preference for sinusoidal,
triangular, or square waveform (Delitto and Rose,
1986). A symmetric biphasic square waveform was
generally preferred for the large quadriceps muscle
group, whereas an asymmetric biphasic square
waveform was preferred for the smaller forearm
musculature when compared to a monophasic paired
spike and three medium frequency waveforms
(Baker, Bowman and McNeal, 1988).
The main aim of our study was to investigate the
effect of shape waveform on quadriceps muscle
fatigue with three different shape waveforms, in
individuals without impairments. . A second purpose
was to determine whether changing the shape
waveform (square, triangular and quadratic) could
improve the comfort level of subjects.
2 METHODS
2.1 Subjects
The subjects who volunteered to participate in the
study were the following: six female averaging 25
years old (SD=2,7); six male averaging 24 years old
(SD=2,8) All subjects reported having no known
neuromuscular, skeletal, vascular or dermatological
impairment. Each one received a detailed
explanation of the study and gave informed consent
prior to participation. The Scientific Committee of
Health School of Technology of Lisbon approved
the present study.
2.2 Instrumentation
A portable electrical stimulator with wireless data
communication was used to elicit muscle contraction
(Bio Signals Plux). This device allows the
modulation of different shape waveforms. Table 1
presents a characteristics summary of the electrical
stimulation settings used. The current charge
difference from each waveform was taken into
account in the data analysis. The stimulation charge
was computed accordingly to the stimulation
intensity and waveform, based on the following
formula:
Q= ∫t1I dt (1)
Where I represent the current intensity and t1 to t2 is
the stimulus time range, being considered in this
case constant. The charge of the different waveform
types have been equalized, for each current intensity,
maintaining the amplitude and varying the pulse-
duration time.
Table 1: Summary of stimulation characteristics for 3
waveforms.
Stimulation
p
arameters
SQ TR QU
Type of
wavefor
m
Monophasic Monophasic Monophasic
Pulse
duration (µs)
175 375 500
Frequency
(Hz)
50 50 50
Maximal
peak intensity
(mA)
100 100 100
Abbreviations: SQ - Square waveform TR - Triangular waveform
QU - Quadratic waveform
QuadricepsMuscleFatigueandComfortGeneratedbyNeuromuscularElectricalStimulationwithCurrentModulated
Waveforms
93
Two 10 x 5 cm rectangular, reusable, self-adhering
electrodes were used in each participant; a isokinetic
dynamometer (Biodex)
[25]
was used to assess torque
generated by right quadriceps muscle group during
MVIC and during all electrically induced isometric
quadriceps muscle contractions. The reliability of
the Biodex system dynamometers for knee extensors
and knee flexors peak torque measurements in
isometric, concentric and eccentric tests has been
studied. Interclass correlation coefficients indicated
high to very high reproducibility for isometric,
concentric and eccentric peak torques (0,88-0,92),
and moderate to high reliability for agonist-
antagonist strength ratios (0,62-0,73) (Araújo et al.,
2014).
2.3 Protocol
Each subject participated in 3 sessions, separated by
at least a 48 hours period. Subjects were assigned to
1 of 3 groups, determining the order in which they
were tested using 3 different electrical stimulation
shape waveforms. Group assignment was random.
Participants were not informed of the shape
waveform being used during each testing session.
The right quadriceps muscle was used for all
tests.
During the initial session, MVIC of the right
quadriceps muscle was measured. This measurement
was followed by determination of the current
amplitude required to elicit 50% of the MVIC test
and by a fatigue test using 1 of the 3 shape
waveforms. The procedure for each the ensuing
sessions was similar to the initial procedure, with the
following exceptions: MVIC was determined at the
initial session only; the type of shape waveform
being used for the electrical stimulation component
of the protocol differed and was determined by
group assignment. Testing was carried out in the
FMH Exercise Physiology Laboratory.
MVIC test. Biodex was used to measure MVIC at a
60 degree knee flexion. Subjects’ leg, thigh, and
pelvis were stabilized by seating system pads and
belts. Backrest was set at 110 degree posterior
incline. The fulcrum of the lever arm was aligned
with the most inferior aspect of the lateral
epicondyle of the right femur. The inferior portion of
the shin pad was adjusted superior to the medial
malleolus. Before the test, participants warmed up
and then stretched the major muscle groups of the
lower extremity, holding each stretch for 15 seconds.
Subjects did 3 consecutive 5-second MVIC trials of
the right quadriceps muscle group, with 60 seconds
of rest between trials. They were asked to keep their
arms crossed over their chest and to contract knee
extensors as fast and forcefully as possible, while
verbal encouragement was provided.
Participants were not allowed to view the
measurements on the computer screen. The highest
measured torque was used to calculate 50% of the
MVIC level.
Determination amplitude required to elicit 50% of
the MVIC. A 5 minute rest period was allowed
between the MVIC test and the determination
current amplitude required to elicit 50% of the
MVIC. Each subject’s right thigh was cleaned with
alcohol. The distal electrode was placed on the
vastus medialis approximately 5 to 7 inches from the
top margin of the patella; the proximal electrode was
placed on the lateral border of the femoral rectus
muscle approximately 2/3 of its length above the top
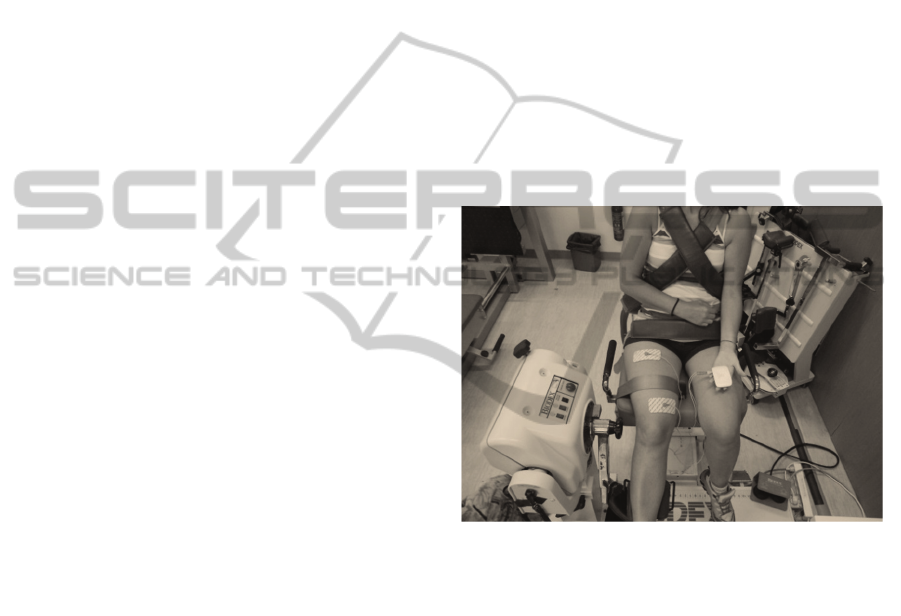
edge of the patella (Figure 1).
Figure 1: Frontal view: Two electrodes are positioned over
vastus medialis and on the lateral border of the femoral
rectus. The stimulated limb is maintained in isometric
conditions.
The electrodes being set, subjects were placed in the
Biodex in the same position used for the MVIC
testing. The current amplitude was determined by
delivering 3-second trains of progressively greater
amplitude. At least 1 minute separated each train.
Three to four trials per participant were performed to
determine the amplitude of the current in milliamps
(mA).
Fatigue test. After a 15-minute rest period, to ensure
muscle fatigue recovery, the fatigue component othe
protocol was performed, using the current amplitude
previously identified and an identical positioning in
the Biodex. The fatigue test consisted in nineteen 3-
second contractions were evoked 2-minute period
(work-to-rest cycle of 3 seconds on and 3 seconds
off) As in other portions of the study, subjects were
BIOSIGNALS2015-InternationalConferenceonBio-inspiredSystemsandSignalProcessing
94
instructed to keep their arms crossed over their chest
and to try to relax during the electrically stimulated
muscle contractions. They were not able to view the
torque measurements displayed on the computer
screen. After the three first contractions, the subjects
were asked to express their perceived discomfort on
a visual analogue scale (VAS) 10 cm long labeled at
the left extreme “maximum discomfort” and at the
right “no discomfort”.
The fatigue index was measured and reflects the
difference between the torques of the initial and final
contractions divided by the torque of the initial
contraction.
2.4 Data Analysis
The mean value of each contraction was extracted
for all subjects and for all the signals resulting from
the different waveforms. For that, we computed the
mean and standard deviation (SD) value of the
contraction above 90% of its maximum value. The
results were extracted automatically and visually
validated manually by two experts.
Descriptive analysis was performed. Frequency
or means and standard deviations were calculated for
each of the demographic variables.
To check if the variables approached a normal
distribution we used Shapiro-Wilk test. The level of
significance used was α = 0,01.
Data was analyzed using ONE-WAY ANOVA,
comparing groups in age and Body Mass Index
(BMI), discomfort and fatigue percent or Kruskal-
Wallis test if the assumption of normality or
homogeneity was not verified.
To examine the effects of the 3 shape waveforms
on muscle fatigue and discomfort we used ANOVA
for 3 dependents samples or ANOVA Friedman test.
The independent variables were the shape
waveforms (SQ, TR and QU), the contraction
number were 1, 9, 13, 19 and dependent variables
were peak torque, perceived discomfort and fatigue
percent. When applying variance analysis led to the
identification of differences, post-hoc tests were
used.
The level of significance used to inferential
statistics was α = 0,05.
3 RESULTS
Of the 12 subjects who participated, two of them
have not reached values close to50% MVIC with TR
and QU shape waveforms. There was no differences
between the 3 groups in the age (F
2,9
=5,42, P =
0,029)
,
BMI (X
2
kw
(2) = 3,500, P = 0,174) and sex
(Table 2). The groups are also similar in physical
exercise practice, not being given the intensity of the
exercise.
Table 2: Demographic variables in 3 groups.
The mean ± SD current amplitudes for SQ, TR
and QU shape waveforms were 77± 14; 92± 8 and
99 ± 2, respectively. The SQ, TR and QU
waveforms evoked mean ± SD percents of MVIC of
50,5% ± 2,4%, 47,2% ± 11,1% and 45,6% ± 10,1%,
respectively (Figure 2). It was noted the SQ wave
generates higher percent of MVIC than the others
with lower current amplitudes. FRIEDMAN’S test
did not reveal statistical difference between evoked
percents of MVIC by 3 shape waveforms in the first
contraction of the fatigue test (X
2
AF
(2) = 3,362, P =
0,186).
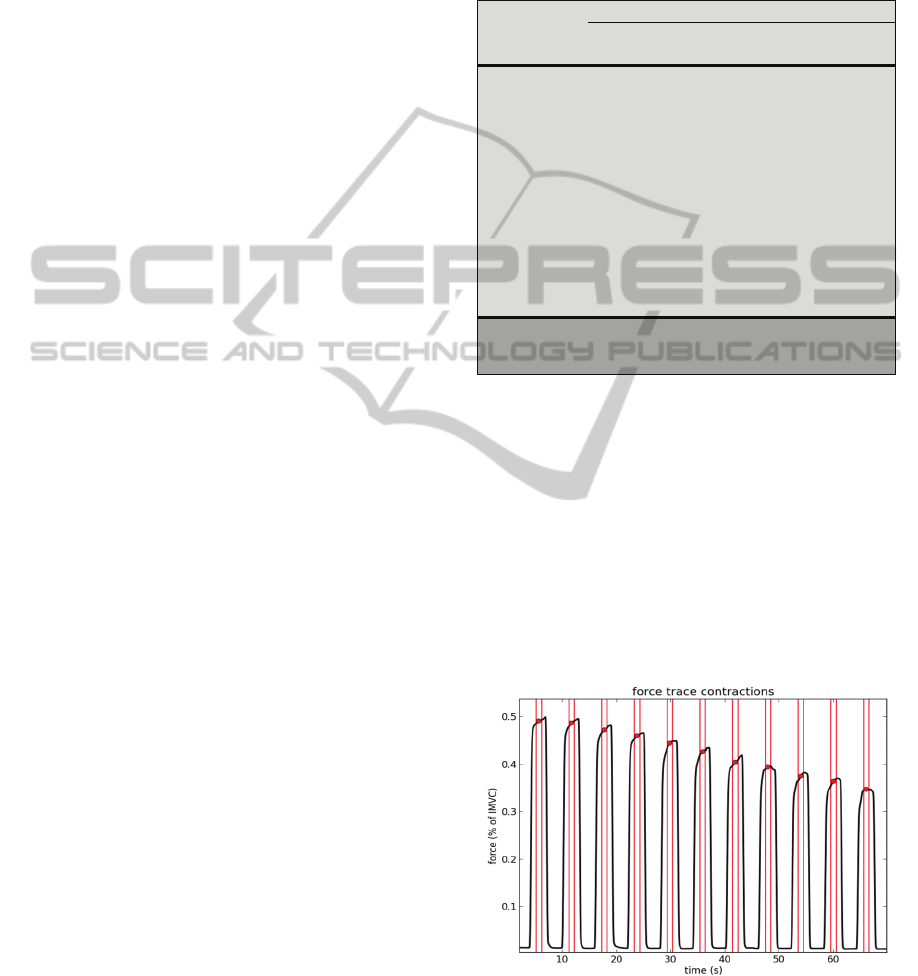
Figure 2: Declining torque of a subject, during fatigue test
with SQ shape waveform.
The 1-way ANOVA did not reveal significant
difference in fatigue percent for SQ (F
2,9
= 1,063, P
Variables
Groups
Group 1
(n = 4)
Group 2
(n= 4)
Group 3
(n = 4)
Sex
Female 2 (33,3%) 2 (33,3%) 2 (33,3%)
Male 2 (33,3%) 2 (33,3%) 2 (33,3%)
Age* 22 ± 3,2 25 ± 1,3 27 ± 2,7
BMI* 21 ± 2,8 22 ± 2,0 19 ± 0,8
Dominant leg
Right 4 (33,3%) 4 (33,3%) 4 (33,3%)
Left 0 0 0
Exercise
practice
Yes 3 (37,5%) 3 (37,5%) 2 (25,0%)
No 1 (25,0%) 1 (25,0%) 2 (50,0%)
Group 1: SQ, TR and QU; Group 2: QU, SQ and TR; Group 3:
TR, QU and SQ.
*Data presented in form of means and standard deviations.
QuadricepsMuscleFatigueandComfortGeneratedbyNeuromuscularElectricalStimulationwithCurrentModulated
Waveforms
95
= 0,385), TR(F
2,9
= 0,201, P = 0,821) and QU (F
2,9
=
0,317 P = 0,736) waveform; comfort perception
score of SQ ( F
2,9
= 0,66, P = 0,537), TR ( F
2,9
= 1,
725, P = 0, 232) and QU (F2,9 = 2,189, P = 0,168)
protocols , among the 3 groups, suggest that the
sequence of application of the waves does not
interfere with the results.
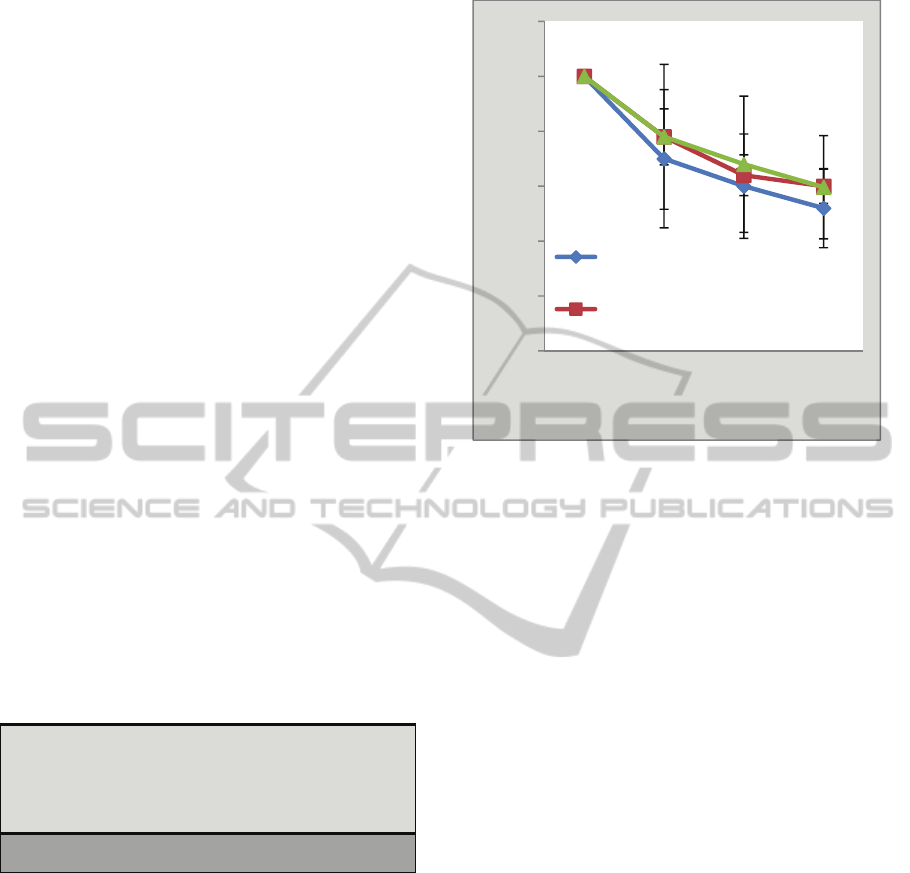
Figures 2 and 3 illustrate the decline in the
evoked torque for the 3 shape waveforms. For all 3
waveforms, there was significant reduction in torque
from the initial contraction (F
3,2
= 189,143, P =
0,000; X
2
AF
(3) = 32,700, P = 0,00; X
2
AF
(3) =
32,500, P = 0,000 for SQ, TR and QU waveform,
respectively).
No significant differences were observed in
fatigue percent among the 3 shape waveforms (F
2,2
=
2,677, P = 0,091). The TR wave resulted in a lower
fatigue when compared to the other 2 shape
waveforms (mean ± SD fatigue percent 34,8% ±
12,4% versus 40,3% ± 5,5% and 41,9% ± 9,3%).
Relative to comfort score there were significant
difference between 3 shape waveforms (X
2
AF
=
9,500 , P = 0,009). We verified on Table 3 that SQ
wave differs significantly from TR wave (P =
0,007). The most comfortable shape waveform was
the TR wave (mean 5,0 ± 2,5), then the QU wave (
mean 5,6 ± 2,9) and finally the SQ shape waveform
(mean 6,7 ± 2,7).
Table 3: Pairwise comparisons among waveforms, relative
comfort scores.
4 DISCUSSION
The current study investigated the influence of the
waveform (SQ, TR and QU) on muscle fatigue,
during NMES. A second purpose was to determine
how the wave shape could alter subject comfort
level during stimulation.
The results of our study demonstrated that there
are no major differences between 3 waves on muscle
fatigue. However TR wave (mean 34,8% ± 12,4%)
has shown lowest percentage of fatigue than
standard wave SQ (mean 40,3% ± 5,5%) and QU
waveform (mean 41,9% ± 9,3).
Figure 3: Values are mean ± SD. No significant
differences between QU, SQ and TR (P > 0,05). Decline
in torque over repeated contractions for QU, SQ and TR.
The difference between the fatiguing effect of
TR waveform and that of the other 2 waveforms is
difficult to explain. Three of the variables
considered to have the greatest effect on muscle
fatigue (frequency, electrical charge and time on-off
ratios) were the same in all protocols (Binder-
Macleod and Snyde-Mackler, 1993; Doucet et al.,
2012).
Concerning QU wave, it may be thought that the
largest fatigue percent is due to higher current
amplitude (99 mA ± 2 vs 92 mA ± 8). A previous
study showed that increasing the current amplitude
while keeping other NMES parameters constant
modestly increased fatigue (Binder-Macleod et al.,
1995). This suggests that as the current amplitude
increases, more fast-twitch motor units are recruited,
resulting in greater fatigue due their higher
metabolic demand in comparison to slow-twitch
motor units.
Another possibility relates to high pulse duration
(500 µs). Literature reports with increasing pulse
duration there is an increase in the evoked torque,
possibly increasing motor unit activation (Gorgey,
Mahoney, Kendall and Dudley, 2006). A pulse
duration of 450 µs elicited 22% and 55% greater
torque output compared to pulse durations of 250
and 150 µs, respectively (Gorgey et al., 2006;
Gorgey and Dudley, 2008). Because increasing
pulse duration increases the evoked torque per unit
of activated muscle (Gorgey et al., 2006), it causes a
Shape
waveforms
Value test P
SQ vs TR 9,500 0,007*
SQ vs QU 9,500 0,662
QU vs TR 9,500 0,199
F: Value of ANOVA Friedman test
*Significantly different P < 0,05
0
10
20
30
40
50
60
1 9 13 19
Torque (% MVIC)
Contraction number
Q
U
S
Q
BIOSIGNALS2015-InternationalConferenceonBio-inspiredSystemsandSignalProcessing
96

higher energy demand and thus leads to faster
muscle fatigue.
However, neither amplitude or pulse duration
appears to influence the increased percent fatigue of
SQ wave, since it presented lower amplitude and
pulse duration than that with the best results (77 mA
and 195 µs vs 92 mA and 375 µs). A recent study
showed no change in fatigue with increase of current
amplitude or pulse duration (Gorgey et al., 2009).
These parameters cause an increase of active area in
stimulated muscle (Gorgey et al., 2009). These
findings may indicate that, although the differences
were not statistically significant, wave shape might
be responsible for the slight variations.
We cannot neglect to mention that there are few
works that study the effect of the waveform on
muscle fatigue and the independent study of the
effect of NMES parameters (frequency, pulse
duration and amplitude) on fatigue were made using
exclusively the standard wave, which gives rise to
reserves as to whether generalizations can be made
for other waves.
Relatively to level comfort, results indicate that
TR wave (mean 5 ± 2,5 on VAS score) is
significantly more comfortable than SQ wave (mean
6,7± 2,7, on VAS score). Our work does not
confirms the conclusions of Delitto and Rose
(1986), who found that individual differences exist
as far as tolerance to various waveforms (square,
triangular and sinusoidal) is concerned and that no
waveform tested can be considered optimally
comfortable than the others.
The TR waveform, as used in our study,
consisted of higher amplitude and pulse duration
than that of the SQ wave, but evoked lower percent
of maximum voluntary isometric contraction
(MVIC). With longer duration of this pulse within
the interval 200-400 µs clinical is which according
to some research is a good relationship between
efficiency and comfort to the patient (Lyons,
Sinkjaer, Burridge and Wilcox, 2002). Best results
of the TR wave could suggest that the subjects may
find an electrically elicited contraction more
comfortable at current amplitude producing lower
percentages of the MVIC than amplitude producing
higher percentages of the MVIC.
The use of the visual analogous scale (VAS) in
this study offers an alternative for measuring the
comfort levels (Kersten, 2012). VAS has been
reported to be accurate, sensitive, and reproducible
instruments for patients to report the degree of pain
they are experiencing.
No significant difference in the comfort scores
was seen on 3 groups, suggesting the order of the
administrations of waves do not interfere with
comfort perception, contrary to what Delitto and
Rose (1986) suggested.
From the results obtained in this study it is
possible to propose that the waveform does not
significantly influence muscle fatigue in healthy
individuals and that TR waveform provides more
comfort than the standard contraction wave, during
NMES.
Despite minor differences, the best results of the
TR wave compared to the SQ wave (also at the level
of muscle fatigue) can be quite relevant for clinical
practice. Literature indicates that more efficient
stimulation of the nerve fiber is made using the
square wave, with pulse durations of less than 250s,
but the triangular wave shows equal (Robertson et
al., 2006) and perhaps better results in improved
comfort and reduced fatigue levels for patients.
The new systems of NMES on the market are
modifiable, so therapists can set parameters
(frequency, pulse duration, shape waveform, etc.)
and design custom electrical stimulation programs
for patients to use. Therefore future studies should
focus on the study of the waveform and its
combination with the other parameters, using larger
number of subjects. This study should be performed
in healthy and clinical populations.
REFERENCES
Araújo JB, Rodrigues R, Azevedo R, Silva BG, Pinto RS,
Vaz MA, Baroni BM. (2014). Inter-machine reliability
of the Biodex and Cybex isokinetic dynamometers for
knee flexor/extensor isometric, concentric and
eccentric tests. Phys Ther Sport 15: 131-216.
Baker LL, Bowman BR, McNeal DR.(1988). Effects of
waveform on comfort during neuromuscular electrical
stimulation. Clin Orthop, 233: 75-81.
Binder-Macleod SA, Halden EE, Jungles KA. (1995).
Effects of stimulation intensity on the physiological
responses of human motor units. Med Sci Sports
Exerc.,27:556-565.
Binder-Macleod SA, Snyder-Mackler L. (1993). Muscle
fatigue: clinical implications for fatigue assessment
and neuromuscular electrical stimulation. Phys
Ther.,73:902–910.
Biodex. Website. http://www.biodex.com/
Biosignalsplux. Website. http://www.biosignalsplux.com/.
Delitto A, Rose SJ. (1986). Comparative Comfort of three
waveforms used in electrically eliciting quadriceps
femoris muscle. Phys Ther., 66: 1704-1707.
Doucet DM, Lam A, Griffin L. (2012). Neuromuscular
electrical stimulation for skeletal muscle function.
Yale J Bio Med., 85: 201-215.
Gerrits HL, Hopman MT, Offringa C, Engelen BG,
QuadricepsMuscleFatigueandComfortGeneratedbyNeuromuscularElectricalStimulationwithCurrentModulated
Waveforms
97

Sargeant AJ, Jones DA, Haan A. Variability in fibre
properties in paralysed human quadriceps muscles and
effects of training. Pflugers Arch. 2003; 445: 734–740.
Glinsky J, Harvey L, Van Es. (2007). Efficacy of electrical
stimulation to increase muscle strength in people with
neurological conditions: a systematic review.
Physiotherapy Research International., 12:175–194.
Gorgey AS, Black CD, Elder CP, Dudley GA. (2009).
Effects of electrical parameters on fatigue in skeletal
muscle. J Orthop Sports Phys Ther, 39(9): 684-692.
Gorgey AS, Dudley GA. (2008). The role of pulse
duration and stimulation duration in maximizing the
normalized torque during neuromuscular electrical
stimulation. J Orthop Sports Phys Ther., 38: 508-516.
Gorgey AS, Mahoney E, Kendall T, Dudley GA. (2006).
Effects of neuromuscular electrical stimulation
parameters on specific tension. Eur J Appl Physiol.,
97: 737-744.
Kantor G, Alon G, Ho HS. (1994). The effects of selected
stimulus waveforms on pulse and phase characteristics
at sensory and motor thresholds. Phys Ther.,74:951–
962.
Kersten P. (2012). The use of Visual Analogue Scale
(VAS) in rehabilitation. J Rehab Med.,44: 609-610.
Kesar T, Binder-Macleod S. (2006). Effect of frequency
and pulse duration on human muscle fatigue during
repetitive electrical stimulation. Exp Physiol., 91: 967-
976.
Laufer Y, Ries JD, Leininger PM. (2000). Quadriceps
femoris muscle torque and fatigue generated by
neuromuscular electrical stimulation with three
different waveforms. Phys Ther., 81: 1307-1316.
Lieber RL, Kelly MJ. (1993). Torque history of
electrically stimulated human quadriceps: implications
for stimulation therapy. J Orthop Res,11:131-141.
Lyons GM, Sinkjaer T, Burridge Jh, Wilcox DJ. (2002). A
review of portable FES-based neural orthoses for
correction of drop foot. IEE Transactions on Neural
Systems and Rehabilitation Engineering, 10: 260-279.
Maffiuletti NA. (2010) Physiological and methodological
considerations for the use of neuromuscular electrical
stimulation. European Journal of Applied
Physiology.,110: 223-234.
Maffiuletti NA, Cometti G, Amiridis IG, Martin A,
Pousson M, Chatard JC. (2000). The effects of
electromyostimulation training and basketball practice
on muscle strength and jumping ability. International
Journal of Sports Medicine., 21: 437-443.
Mulla MR, Sepulveda F, Colley M. (2011). A review of
non-invasive thecniques to detect and predict localized
muscle fatigue. Sensors.,11: 3545-3594.
Newsam CJ, Baker LL. (2004). Effect of an electric
stimulation facilitation program on quadriceps motor
unit recruitment after stroke. Archives of Physical
Medicine and Rehabilitation., 85:2040–2045.
Peckham PH; Knutson JS. (2005) Functional electrical
stimulation for neuromuscular applications. Annu Rev
Biomed Eng., 7:327–360.
Riener R. (1999). Model-based development of
neuroprosthesis for paraplegic patients. Philos Trans R
Soc Lond B Biol Sci., 354: 877–894.
Robertson V, Ward A, Low J. Reed A. (2006).
Electrotherapy Explained: Principles and Practice. 4
th
Edition. Oxford: Elsevier; Chapter 3, Electrical
stimulation: currents and parameters; 59.
Slade JM, Bickel CS, Warren GL, Dudley GA.
(2003).Variable frequency trains enhance torque
independent of stimulation amplitude. Acta Physiol
Scand.,177:87-92.
Snyder-Mackler L, Delitto A, Stralka SW, Bailey SL.
(1994). Use of electrical stimulation to enhance
recovery of quadriceps femoris muscle force
production in patients following anterior cruciate
ligament reconstruction. Physical Therapy., 74: 901–
907.
Stackhouse SK, Binder-Macleod SA, Stackhouse CA,
McCarthy JJ, Prosser, LA, Lee SC. (2007). Neuro-
muscular electrical stimulation versus volitional
isometric strength training in children with spastic
diplegic cerebral palsy: a preliminary study.
Neurorehabilitation and Neural Repair., 21 (6):475-
485.
Vanderthommen M, Duteil S, Wary C, Raynaud JS,
Leroy-Willig A, Crielaard JM, et al. (2003). A
comparison of voluntary and electrically induced
contractions by interleaved 1H- and 31P-NMRS in
humans. J Appl Physiol., 94:1012–1024.
BIOSIGNALS2015-InternationalConferenceonBio-inspiredSystemsandSignalProcessing
98
