
Fingerprint Quality Assessment Combining Blind Image Quality,
Texture and Minutiae Features
Z. Yao, J. Le bars, C. Charrier and C. Rosenberger
Universite de Caen Basse Normandie, ENSICAEN, UMR 6072 GREYC, Caen, France
Keywords:
Fingerprint, Minutiae Template, Quality Assessment, Evaluation.
Abstract:
Biometric sample quality assessment approaches are generally designed in terms of utility property due to the
potential difference between human perception of quality and the biometric quality requirements for a recog-
nition system. This study proposes a utility based quality assessment method of fingerprints by considering
several complementary aspects: 1) Image quality assessment without any reference which is consistent with
human conception of inspecting quality, 2) Textural features related to the fingerprint image and 3) minutiae
features which correspond to the most used information for matching. The proposed quality metric is obtained
by a linear combination of these features and is validated with a reference metric using different approaches.
Experiments performed on several trial databases show the benefit of the proposed fingerprint quality metric.
1 INTRODUCTION
Fingerprint systems, among biometric modalities, are
the most deployed solution due to the invariability,
usability and user acceptance of fingerprints (Jain
et al., 2004). So far, the application of fingerprint is
no longer limited to traditional public security area
(official applications), but spread into the daily life,
smart phone authentication and e-payment, for in-
stance. Because of the continuous developments, fin-
gerprint quality assessment has become a crucial task
in the deployment of systems in real applications.
There is no doubt that a good quality sample during
the enrollment process can reduce recognition errors.
The good quality of a fingerprint sample is also ben-
eficial to matching operations (Grother and Tabassi,
2007) in addition to the clarity of human intuition
and feature extractability of the image (Chen et al.,
2005). In this case, most previously proposed fin-
gerprint quality approaches have been implemented
in terms of utility of biometric sample’s quality rather
than fidelity (Alonso-Fernandez et al., 2007), i.e. bio-
metric sample’s quality should be related to system
performance. Tabassi et al. (Tabassi et al., 2004)
defined their quality metric as a predictor of system
performance by considering the separation of gen-
uine matching scores (GMS) and impostor matching
scores (IMS). Chen et al. (Chen et al., 2005) later
proposed one quality metric by considering authenti-
cation performance.
As we can see in the literature, features are very
important to make a reliable judgment of the qual-
ity of a fingerprint. Moreover, a fingerprint can be
considered as an image or a set of minutiae we could
extract many features. This study proposes a qual-
ity metric of fingerprint image based on the utility
property by considering two aspects in general: 1)
the fingerprint image itself and 2) the corresponding
minutiae template which is rarely taken into account
for this issue. The validation of the proposed quality
metric is carried out by using two approaches based
on the prediction of authentication performance. The
main contribution of the paper is to propose a continu-
ous quality index of a fingerprint integrating different
points of view (brought by the used features) and pro-
viding a better assessment.
This paper is organized as follows: Section 2 de-
tails the features for computing the proposed quality
metric. Section 3 presents the computation approach
of the proposed quality metric. Experimental results
are given in 4. Conclusion is given in section 5.
2 QUALITY FEATURES
The general purpose of this work is to qualify original
fingerprint samples and to analyze the proposed qual-
ity metric through different validation approaches.
The proposed quality metric is based on a former
method in (El Abed et al., 2013). That work evalu-
336
Yao Z., Le Bars J., Charrier C. and Rosenberger C..
Fingerprint Quality Assessment Combining Blind Image Quality, Texture and Minutiae Features.
DOI: 10.5220/0005268403360343
In Proceedings of the 1st International Conference on Information Systems Security and Privacy (ICISSP-2015), pages 336-343
ISBN: 978-989-758-081-9
Copyright
c
2015 SCITEPRESS (Science and Technology Publications, Lda.)

ated altered fingerprint image quality with two kinds
of quality features, one is universal (no reference im-
age quality assessment) and another is related to the
fingerprint modality. We employ this framework for
the original fingerprint samples.
2.1 NR-IQA and Prior Features
In (El Abed et al., 2013), 11 features have been used
to obtain the quality metric, including one derived
from a NR-IQA algorithm (Saad et al., 2012) and the
others are image-based features. Details of the fea-
ture are not presented again in this paper. A general
description is given in table 1.
Table 1: List of quality features in (El Abed et al., 2013).
Feature Description
NO.
NR-IQA BLIINDS (Saad et al., 2012)
1-N1
SIFT point
number
Number of SIFT keypoints
2-S1
SIFT DC coef-
ficient
DC coefficient of SIFT features
3-S2
SIFT Mean Mean measure related to SIFT keypoints
4-S3
SIFT STD
Standard deviation related to SIFT key-
points
5-S4
Block number Number of blocks (17×17)
6-P1
Patch RMS
Mean
Mean of blocks RMS
1
values.
7-P2
Patch RMS
STD
Standard deviation of RMSs
8-P3
Patch RMS
Median
Median of blocks RMSs.
9-P4
Patch RMS
skewness
Skewness of blocks RMSs.
10-P5
Median LBP 256-level MBP histogram
11-P6
1. ’RMS’ is the abbreviation of Root Mean Square.
Salient features are extracted by using Scale In-
variant Feature Transform (SIFT) operator. For
patched features, it firstly divide images into blocks of
17×17, and then the root mean square (RMS) value of
each block is computed to obtain the quality features.
2.2 Texture-based Quality Features
Texture features are widely used for image classifi-
cation and retrieval applications. There is not study
observed that whether some of them are able to con-
tribute distinctive results for quality assessment of fin-
gerprint image. In this study, 11 texture features have
been selected as the components for generating the
proposed quality metric, cf. 2. These features have
been classified into four classes:
1) The first class of textural features embeds local bi-
nary pattern (LBP) features and its extensions or
transforms. LBP features have been proposed by
Ojala et al (Ojala et al., 2002) for image classifi-
cation. This feature is simple yet efficient so that
it is widely used for texture analysis. The idea of
LBP operator was that the two-dimensional sur-
face textures can be described by two complemen-
tary measures: local spatial pattern and gray scale
contrast (Pietik
¨
ainen, 2011). Basic LBP operator
generates a binary string by thresholding each 3-
by-3 neighborhood of every pixel of the image.
Table 2: List of texture features.
Feature Format
NO.
LBP 256-level LBP histogram vector
1-C1
Four-patch
LBP
Descriptor code vector
2-C1
Completed
LBP
512-bit 3D joint histogram vector
3-C1
GLCM mea-
sures
8-bit GLCM vector
4-C2
LBP H-FT LBP histogram FT
1
vector
5-C1
2S 16O
1
Gabor 64-bit Gabor response vector
6-C3
4S 16O Gabor 128-bit Gabor response vector
7-C3
8S 16O Gabor 256-bit Gabor response vector
8-C3
16S 16O Ga-
bor
512-bit Gabor response vector
9-C3
LRS 81-bit LRS motif histogram vector
10-C4
Median LBP 256-level MBP histogram
11-C1
1. ’S’, ’O’ and ’FT’: abbr. of scale, orientation and Fourier Transform.
The transforms of LBP involved in this study
include four-patch LBP (FLBP), completed
LBP (CLBP), LBP histogram Fourier transform
(LBPHFT) (Nanni et al., 2012) and median LBP
(MLBP) (Hafiane et al., 2007).
2) Second class is Haralick feature or gray level
co-occurrence matrix (GLCM) (Haralick et al.,
1973). In this study, 4 statistic measures generated
from the GLCM matrix in 4 directions combina-
tion of neighbor pixels are computed, including
energy, entropy, moment and correlation.
3) The 2D Gabor decomposition is a sinusoidal func-
tion modulated by a Gaussian window. In this
case, the basis of a Gabor function is complete
but not orthogonal. In the last few decades, it has
been widely applied to fingerprint image and other
biometric data to perform classification and seg-
mentation tasks. Shen et al. (Shen et al., 2001)
proposed using Gabor response to evaluate finger-
print image quality, in which it is said that one
or several Gabor features of 8-direction Gabor re-
sponse are larger than that of the others. Olsen et
al. (Olsen et al., 2012) proposed a quality index
based on 4-direction Gabor response and it is said
that 4-direction is sufficient to qualify fingerprint.
However, in this study, it is observed that 2-scale
FingerprintQualityAssessmentCombiningBlindImageQuality,TextureandMinutiaeFeatures
337
4-direction Gabor filters do not bring out distinc-
tive regularity for fingerprint images of a specified
database.
4) The last one concerns local relational string (LRS)
(Hafiane and Zavidovique, 2006) which is an illu-
mination invariant operator and it reflects varia-
tion of local gray level of the image. The operator
is based on the local pixels relation in a specified
scale, and it uses 3 relations to generate local re-
lation motif histogram for measuring local spatial
variations of the image.
2.3 Minutiae-based Quality Features
Feng et al. (Feng and Jain, 2011) proposed to
reconstruct a fingerprint image from the triplet
representation of minutia point. Such a result demon-
strates the significance of minutiae template. In this
study, we relate the minutiae template to the quality
assessment of fingerprint by defining several quality
features based on minutiae number and DFT of the
three components of minutiae point, as shown in
table 3.
Table 3: Minutiae number-based measures related to finger-
print quality.
Measure Description
NO.
Minutiae number
(MN)
Minuitiae number of fingerprint.
1-M1
Mean of minutiae
DFT
Defined as equation (1b)
2-M1
STD of minutiae
DFT
Equation (1c)
3-M1
MN in ROI
1
MN in a rectangle region.
4-M1
MN in ROI 2 MN in a circle region.
5-M1
Region-based
RMS
Root mean square (RMS) value of
MN based on two blocks of the tem-
plate.
6-M1
Region-based me-
dian
Median value of MN obtained by di-
viding the template into 4 blocks.
7-M1
Block-based mea-
sure
A block-based score for the tem-
plate.
14-M1
1. region of interest.
Minutiae-based measures given in table 3 are cal-
culated based on a the template of detected minutiae
extracted by using NBIS tool (Watson et al., 2007).
This template contains a quadruple representation of
minutia point which consists of 1) the position (x, y)
of detected minutiae, 2) the orientation θ of detected
minutiae, and 3) a quality score of detected minutiae.
In the experiment, only the minutiae positions and ori-
entations are used for calculating these measures. In
the following, the details of some of the measures are
presented.
In the experiment, both measure 2 and 3 are de-
rived from the magnitude of the Fourier transform of
the linear combination of 3 minutia components after
eliminating DC component, as described in equation
1.
F (x, y, θ) =
N−1
∑
n=0
x
n
·µ
kn
+ y
n
·ν
kn
+ θ·ω
kn
. (1a)
where µ, ν, and ω are frequency samples. Measures
M
2
and M
3
are finally computed as follows:
M
2
= |F (x, y, θ)|, (1b)
M
3
=
s
1
N
N
∑
i=1
(F
i
− M
2
). (1c)
DC component was eliminated when computing these
two measures because there is no valuable informa-
tion in this element.
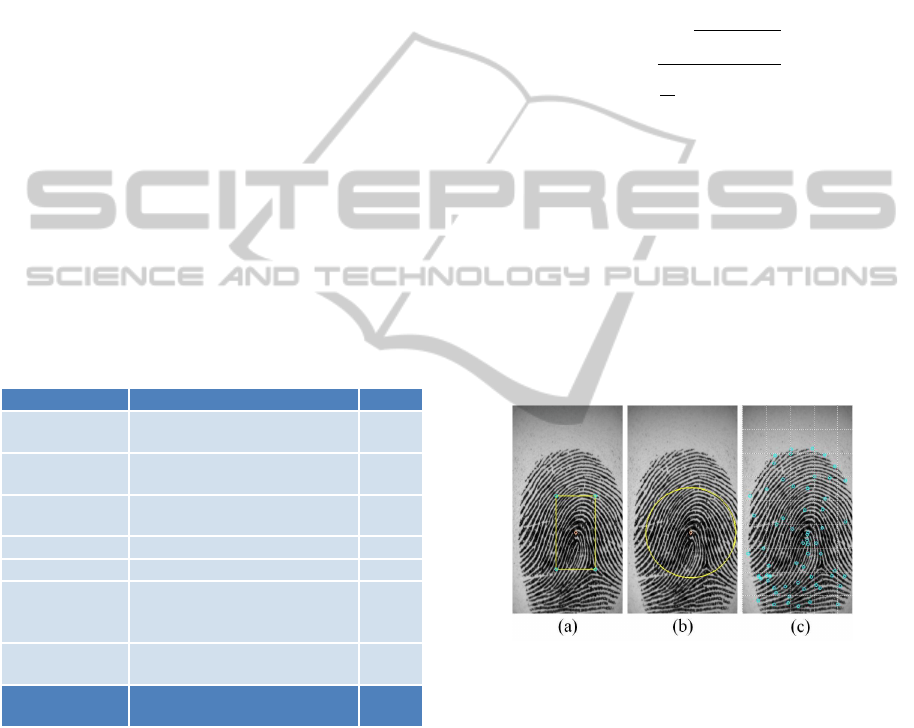
For measure 4, the size of rectangle region is de-
termined by the maximum value of both x and y co-
ordinates of minutiae, for which there is no useful in-
formation outside the foreground of the fingerprint in
this case. This choice also ensures that the region of
interest will not go over the effective area of minutiae.
An example of rectangle region is shown in figure 1
(a).
Figure 1: Example of circle region (a), rectangle region (b),
and template block partition in the size of fingerprint (c).
The radius of the circle region for measure 5 is
also determined by the maximum and minimum loca-
tion value of minutiae along the horizontal direction
of fingerprint, for minutiae lie around fingerprint cen-
ter are said to be those who contribute most to finger-
print matching, i.e. they are considered as the most in-
formative. As the quadruple representation does not
provide information of fingerprint core point, an es-
timated point was used as the center’s location of the
fingerprint. A comparison has been made between the
estimated center point and a core point detected by an-
other approach, and it is found that the result does not
vary too much. The estimated center position was de-
termined by considering the maximum and minimum
ICISSP2015-1stInternationalConferenceonInformationSystemsSecurityandPrivacy
338

minutiae location as well. An example of the circular
region is shown in figure 1 (b).
For measures 6 and 7, the whole fingerprint re-
gion is divided into 2 and 4 blocks, and minutiae num-
ber in each block is considered to generate a measure.
Another block-based measure is calculated by divid-
ing the whole fingerprint region into several blocks in
the size of 64×64. The blocks are classified into 3
classes, reasonable block, vague block, and unreason-
able block. At last, a quality index is assigned to each
block in terms of the minutiae number in the block,
for which a threshold is used for determining the in-
dex of each block. An example of block partition is
shown by figure 1 (c). In addition, features proposed
in (Ross et al., 2005) are calculated in terms of minu-
tiae distribution and orientations, and they are rotation
and translation invariant.
We analyse in section 4.2 the behavior of these
quality features. Based on all these quality features,
we generate a quality metric using the method de-
scribed in the next section.
3 QUALITY METRIC
DEFINITION
The quality metric of fingerprint (QMF) image in this
study is computed by an approach using a Genetic Al-
gorithm (GA) proposed in (El Abed et al., 2013). It
uses a weighted linear combination of the quality fea-
tures, formulated as
Q =
N
∑
i=1
α
i
F
i
, (2)
where N is the number of quality features F
i
(i =
1, ··· , N), α
i
are the weighted coefficients. The
weighted coefficients are computed via optimizing
a fitness function of GA which is composed by the
Pearson correlation between combined quality results
defined by equation 2 and corresponding GMS of fin-
gerprints samples. This approach realizes a learn-
ing of quality assessment and optimizes the weighted
coefficients to generate a continuous quality metric
combining different features.
4 EXPERIMENTAL RESULTS
In order to validate the behavior of the quality met-
ric (denoted as QMF) of this study, an analysis of the
proposed features is realized. The validation of QMF
is implemented by observing the evaluation results of
both QMF and NFIQ (Tabassi et al., 2004).
4.1 Protocol and Databases
In this study, three FVC databases (Maio et al., 2004)
have been used for experiments: FVC2002DB2A,
FVC2004DB1A, and FVC2004DB3A. The first two
databases are established by optical sensor and the
last one is thermal sweeping sensor. The resolu-
tions and image dimensions of all 3 databases are
500dpi, 500dpi, 512dpi, and 296×560, 480×640, and
300×480, respectively. Each database involves 100
fingertips, and 8 samples for each fingertip. The intra-
class and inter-class matching scores involved in the
experiment have been calculated by using NBIS tool
(Watson et al., 2007) namely Bozorth3 and a commer-
cial SDK (IDt, ). Minutiae template used in the ex-
periment were also extracted by using the correspond-
ing MINDTCT and the SDK. The minutiae-based fea-
tures involve in only the location (x, y) and the orien-
tation o of minutia so that we don’t consider the qual-
ity value of the points (generated by MINDTCT) and
the type of them (given by SDK).
4.2 Feature Analysis
Fernandez et al. (Alonso-Fernandez et al., 2007)
and Olsen (Olsen et al., 2012) respectively calcu-
lated Pearson and Spearman correlation coefficients
between different quality metrics to observe the
behaviour of them. We use the same approach in this
study by computing the Pearson correlation between
several quality metrics and the QMF. Quality metrics
used for this analysis include OCL (Lim et al., 2002),
orientation flow (OF) (Chen et al., 2004), standard
deviation (STD) (Lee et al., 2005), Pet Hat’s wavelet
(PHCWT) (Nanni and Lumini, 2007) and NFIQ.
Figure 6, 8, 7 presents the correlation results obtained
from the trial databases for all quality features.
In table 6, highlighted columns (with yellow)
demonstrated a relatively stable correlation for all the
three databases, and some others marked with green
illustrated their feasibility for certain data sets. Ac-
cording to this observation, we could make an attempt
to reduce some redundant features in next study. Ta-
ble 8 presents only 11 of the minutiae-based features,
for the correlation of them is not very distinctive.
Some of them demonstrate good correlated behavior
with the quality metrics, but greatly vary among the
data sets and even not correlated with any of the qual-
ity metrics. Likewise, the correlation results of the
image-based features are given in table 7. We use all
these features to calculate the quality metric which
enables qualifying fingerprint samples with comple-
mental information. Note that the last columns denote
FingerprintQualityAssessmentCombiningBlindImageQuality,TextureandMinutiaeFeatures
339
relatively good correlation between the NR-IQA and
the quality metrics.
4.3 Metric Validation
The validation involves in two sections, one is the im-
pact of enrollment selection (YAO et al., 2014) and
another is a utility evaluation (Chen et al., 2005).
4.3.1 Impact on the Enrollment Process
Authors in (Grother and Tabassi, 2007) discussed on
quality values used for three different cases, including
enrollment phase, verification task and identification.
Enrollment is generally a supervised task for getting
relatively good quality samples, and one main differ-
ence between verification and identification tasks is
the existence of enrollment which directly impacts on
how FNMR and FMR acts. However, if the purpose
is to validate a quality metric without considering the
testing type (i.e. algorithm testing, scenario testing
and etc.), the variation of enrollment samples quality
would generate distinctive impacts on matching per-
formance and the result is repeatable in the experi-
ments.
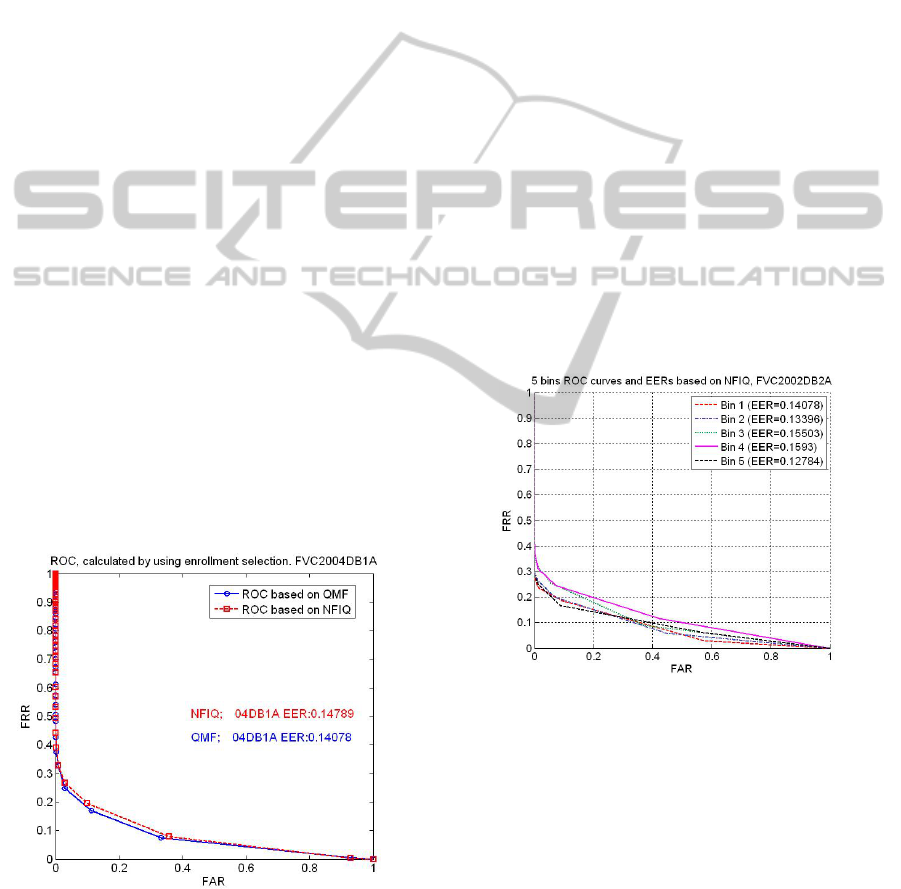
We computed the EER values of 3 databases by
choosing the best quality samples as the reference
(by using NFIQ and QMF). A good quality metric
for the choice of the references should reduce match-
ing error rate. The ROC curves and EER values of
FVC2004DB1A based on this strategy are presented
as an illustration, see figure 2.
Figure 2: Enrollment selection result of FVC2004DB1A.
The EER values by using NFIQ (for the enroll-
ment process) is 14.8%, and 14.1% with the QMF
metric. For FVC2002DB2A and FVC2004DB3A, the
EER values are 13.2% (NFIQ), 10.6% (QMF), 8.3%
(NFIQ) and 6.7% (QMF). These results show the ben-
efit of QMF face to NFIQ as it permits to optimize the
enrollment process.
In addition, such EER values are calculated via
the commercial SDK, results obtained via NFIQ
are 3.99% (02DB2A), 9.39% (04DB1A) and 4.76%
(04DB3A), while the values obtained by using QMF
are 3.39% (02DB2A), 5.35% (04DB1A) and 4.64%
(04DB3A), respectively. This result demonstrates
whether the QMF is possible for dealing with inter-
operability. However, in practical, this property relies
on both the performance of matching algorithm and
the quality metric. We employ this result simply for
validating the QMF.
4.3.2 Quality and Performance Evaluation
The second approach is based on the isometric bins of
samples sorted in an ascending order the quality val-
ues and is more strict for the distribution of the quality
values. In order to validate the QMF by referring to
NFIQ, instead of dividing quality values of NFIQ into
5 isometrics bins, we divided them into 5 bins which
correspond to its 5 quality labels. The reason for do-
ing so is that NFIQ fails to satisfy the isometric-bin
evaluation criteria, as given in figure 3.
Figure 3: Example of 5-bin evaluation for NFIQ on
FVC2002DB2A.
Then, the EER values of the divided bins are cal-
culated. For NFIQ-based quality values, it is easier to
calculate the EER values of the 5 label bins, as it is
depicted in figure 4.
We are able to observe that the matching perfor-
mances on FVC2002DB2A and FVC2004DB3A are
monotonically increased by pruning bad quality sam-
ples gradually. NFIQ generated quality levels from 1
to 4 for FVC2002DB2A, and no samples of level 5
were figured out for this database. This might be due
to the minutiae points detected on the images of this
database, because NFIQ algorithm involves in minu-
tia quality of the fingerprint image. This situation was
ICISSP2015-1stInternationalConferenceonInformationSystemsSecurityandPrivacy
340
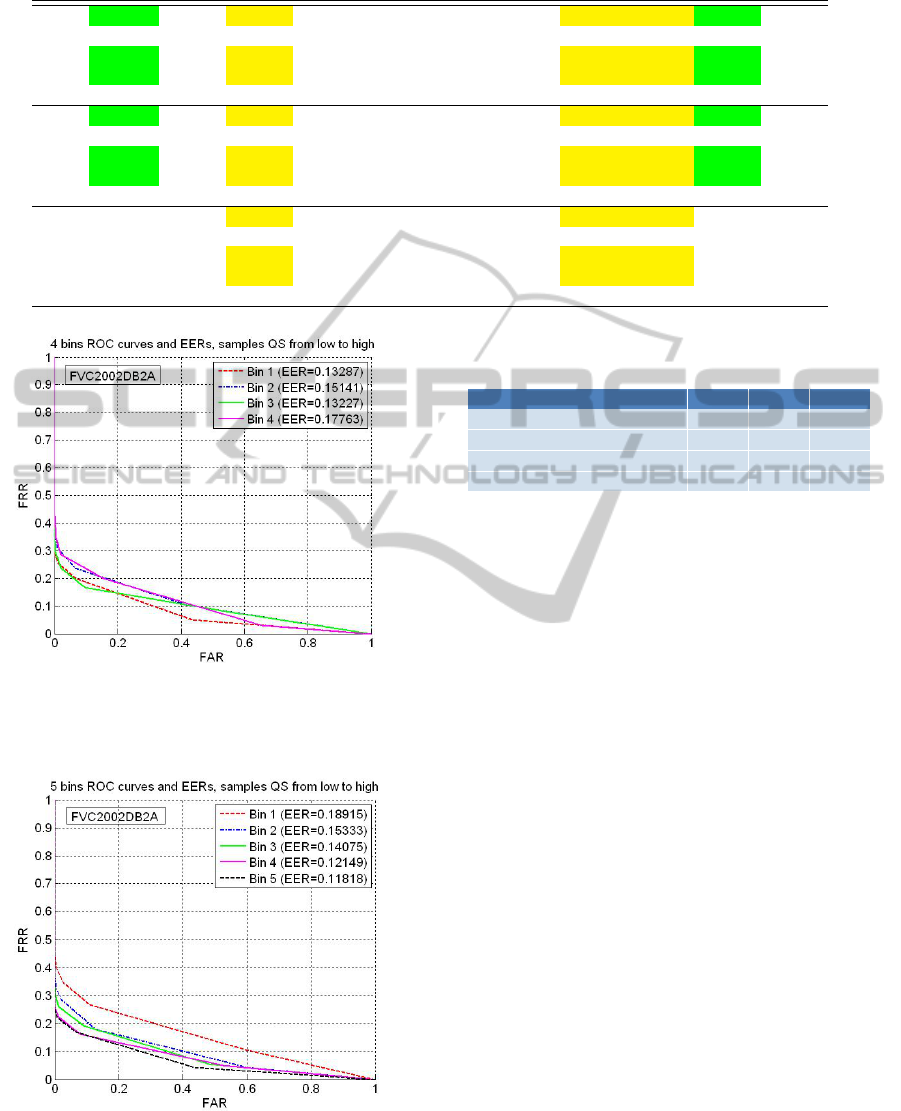
Table 5: Inter-class Pearson correlation for textural features. 02DB2A (top), 04DB1A (middle) and 04DB3A (bottom).
OCL -0.6826 0.3002 -0.7037 -0.7895 -0.4462 -0.3294 0.3806 0.5864 0.6832 0.8699 -0.7593
OF -0.1938 0.1783 0.0098 -0.0396 -0.0452 -0.0700 0.1685 0.2016 0.1590 -0.0012 0.0593
PHC -0.6926 0.2864 -0.6665 -0.8805 -0.3391 -0.1957 0.3552 0.6329 0.7507 0.8476 -0.7807
STD -0.6230 0.3958 -0.5590 -0.8796 -0.3016 -0.3037 0.5620 0.8066 0.8940 0.7668 -0.7438
NFIQ 0.3919 0.1240 0.3483 0.4675 0.1617 -0.0057 0.0401 -0.0676 -0.1307 -0.4569 0.2731
OCL -0.6899 -0.7979 -0.7798 0.2582 0.7151 0.0456 0.4071 0.6708 0.7223 -0.7416 0.7125
OF -0.2642 -0.3263 -0.3057 0.1580 0.2073 0.1087 0.3968 0.4206 0.4539 -0.2281 0.2057
PHC -0.7060 -0.8206 -0.8416 0.2832 0.7535 0.0373 0.4722 0.7548 0.7964 -0.7701 0.7426
STD -0.5920 -0.7066 -0.7286 0.2249 0.6471 0.0554 0.4669 0.6930 0.7264 -0.6646 0.6297
NFIQ 0.1634 0.1607 0.1775 -0.0683 -0.2101 -0.0412 0.0897 -0.0254 -0.0157 0.2295 -0.2143
OCL -0.5001 -0.6394 -0.7460 0.0406 0.5144 0.0842 0.5301 0.6505 0.6948 -0.3814 0.5536
OF -0.2510 -0.1842 -0.1539 0.1097 0.0814 -0.2304 -0.1348 -0.1148 -0.0539 -0.1537 0.1566
PHC -0.1648 -0.2758 -0.4495 0.1015 0.1439 0.1660 0.6947 0.7992 0.7450 -0.1928 0.1726
STD -0.2401 -0.3447 -0.5029 0.0839 0.2221 0.1201 0.6398 0.7359 0.7037 -0.2161 0.2550
NFIQ -0.0532 -0.0886 0.0316 0.0183 0.0518 -0.2360 -0.3640 -0.4005 -0.2608 -0.0805 0.0907
Figure 4: Monotonic increasing matching performance val-
idation of FVC2002DB2A for NFIQ, calculated by dividing
quality values into 5 isometric bins (no sample of quality 5
for this database).
Figure 5: Monotonic increasing matching performance val-
idation of FVC2002DB2A for QMF, calculated by dividing
quality values into 5 isometric bins.
Table 4: 5 Bins EER values based on QMF and NFIQ of
FVC2004DB1A and FVC2004DB3A.
Bin No. B1 B2 B3 B4 B5
Q
1
. (04DB1) 22.2% 16.6% 17.2% 17.8% 13.3%
N
1
. (04DB1) 15.8% 18.1% 17.7% 23.2% 26.5%
Q. (04DB3) 14.2% 8.9% 7.4% 5.8% 4.2%
N. (04DB3) 7.5% 8.1% 13.4% 12.9% 29.8%
1. ’Q’ and ’N’ are abbreviation of ’QMF’ and ’NFIQ’, respectively.
observed when calculated the correlation between
14 minutiae quality features and genuine matching
scores in the experiment of this study. It shows
a relatively higher correlation on FVC2002DB2A,
while the values of two other databases are relatively
lower. For FVC2004DB1, both the proposed qual-
ity metric and the reference algorithm showed cer-
tain difficulties. Here, only the graphical results on
FVC2002DB2A are presented, while the 5 bins’ EER
values based on proposed approach and NFIQ of
FVC2004DB1A and FVC2004DB3A are given in ta-
ble 4. The quality values of QMF are normalized into
[0, 100] on each database where small value denotes
bad quality (bin 1). The NFIQ has 5 quality levels
where level 1 represents the best quality and level 5 is
the worst one.
5 CONCLUSION
This study first propose a fingerprint quality metric by
considering image-based quality features and those
derived from minutiae template. Second, the quality
metric has been validated by using different valida-
tion approaches. In the study, the proposed quality
metric was evaluated on 3 different FVC databases,
FVC2002 DB2 A, FVC2004 DB1 A, and FVC2004
DB3 A. Among the validation result, it can be ob-
served that the performance of quality metric shows
FingerprintQualityAssessmentCombiningBlindImageQuality,TextureandMinutiaeFeatures
341
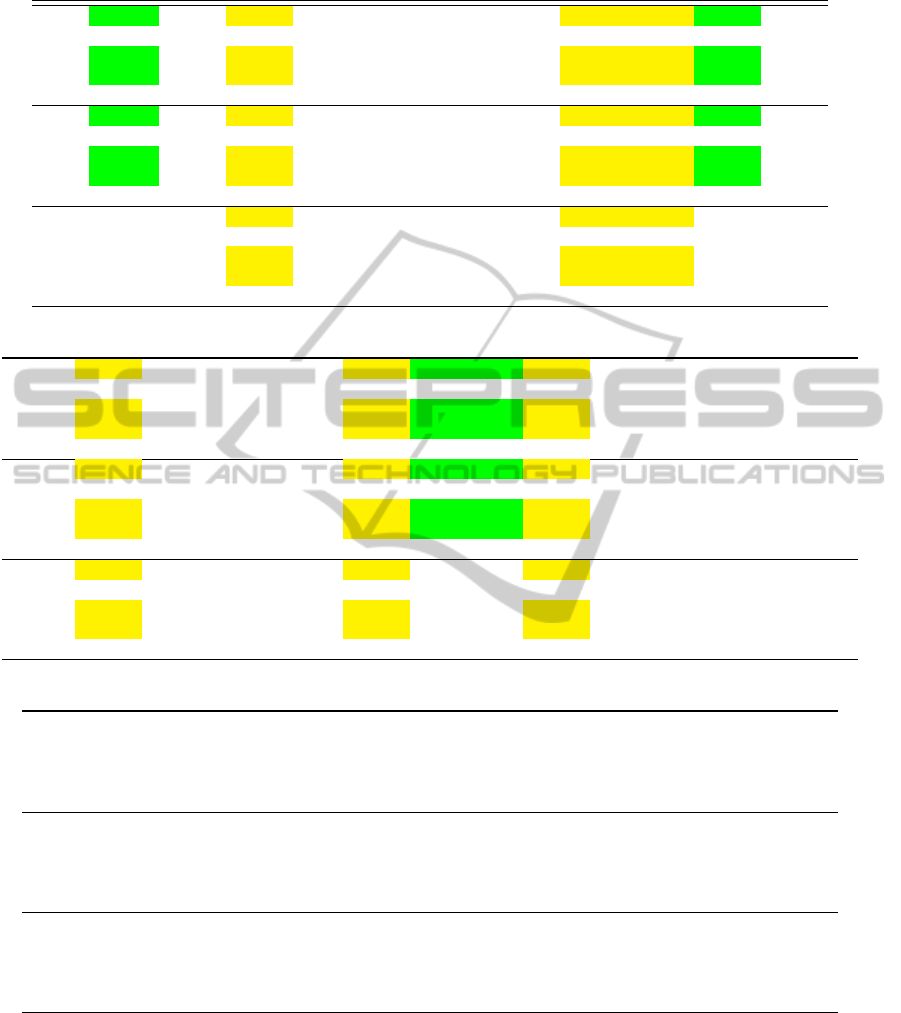
Table 6: Inter-class Pearson correlation for textural features. 02DB2A (top), 04DB1A (middle) and 04DB3A (bottom).
OCL -0.6826 0.3002 -0.7037 -0.7895 -0.4462 -0.3294 0.3806 0.5864 0.6832 0.8699 -0.7593
OF -0.1938 0.1783 0.0098 -0.0396 -0.0452 -0.0700 0.1685 0.2016 0.1590 -0.0012 0.0593
PHC -0.6926 0.2864 -0.6665 -0.8805 -0.3391 -0.1957 0.3552 0.6329 0.7507 0.8476 -0.7807
STD -0.6230 0.3958 -0.5590 -0.8796 -0.3016 -0.3037 0.5620 0.8066 0.8940 0.7668 -0.7438
NFIQ 0.3919 0.1240 0.3483 0.4675 0.1617 -0.0057 0.0401 -0.0676 -0.1307 -0.4569 0.2731
OCL -0.6899 -0.7979 -0.7798 0.2582 0.7151 0.0456 0.4071 0.6708 0.7223 -0.7416 0.7125
OF -0.2642 -0.3263 -0.3057 0.1580 0.2073 0.1087 0.3968 0.4206 0.4539 -0.2281 0.2057
PHC -0.7060 -0.8206 -0.8416 0.2832 0.7535 0.0373 0.4722 0.7548 0.7964 -0.7701 0.7426
STD -0.5920 -0.7066 -0.7286 0.2249 0.6471 0.0554 0.4669 0.6930 0.7264 -0.6646 0.6297
NFIQ 0.1634 0.1607 0.1775 -0.0683 -0.2101 -0.0412 0.0897 -0.0254 -0.0157 0.2295 -0.2143
OCL -0.5001 -0.6394 -0.7460 0.0406 0.5144 0.0842 0.5301 0.6505 0.6948 -0.3814 0.5536
OF -0.2510 -0.1842 -0.1539 0.1097 0.0814 -0.2304 -0.1348 -0.1148 -0.0539 -0.1537 0.1566
PHC -0.1648 -0.2758 -0.4495 0.1015 0.1439 0.1660 0.6947 0.7992 0.7450 -0.1928 0.1726
STD -0.2401 -0.3447 -0.5029 0.0839 0.2221 0.1201 0.6398 0.7359 0.7037 -0.2161 0.2550
NFIQ -0.0532 -0.0886 0.0316 0.0183 0.0518 -0.2360 -0.3640 -0.4005 -0.2608 -0.0805 0.0907
Table 7: Inter-class Pearson correlation for image-based features. 02DB2A (top), 04DB1A (middle) and 04DB3A (bottom).
OCL 0.4816 0.2370 0.2931 0.1775 0.3659 -0.9137 0.6643 -0.8818 0.4179 -0.5538 -0.8443
OF 0.0386 -0.0438 0.1038 0.0733 0.2487 0.0391 0.0875 -0.0197 0.0840 -0.1092 0.0452
PHCWT 0.4720 0.3650 0.3149 0.1234 0.4921 -0.7480 0.5860 -0.7129 0.4031 -0.5316 -0.8469
STD 0.3169 0.2133 0.4788 0.2037 0.5805 -0.7170 0.6608 -0.6660 0.4149 -0.5252 -0.8023
NFIQ 0.4434 0.4445 0.1735 0.0971 0.1164 0.4017 0.2510 0.4088 0.1409 0.2598 0.3907
OCL 0.4689 0.0418 0.3839 0.4307 0.5980 -0.9129 0.8823 N 0.2666 -0.3423 0.8753
OF 0.1908 0.0065 0.1216 0.0284 0.1347 -0.1971 0.1586 NaN -0.1877 0.2351 0.3396
PHC 0.5126 0.2468 0.4225 0.3492 0.7118 -0.7046 0.6858 N 0.2085 -0.2800 0.8687
STD 0.4070 0.2177 0.4946 0.3752 0.8112 -0.6632 0.6887 N 0.1722 -0.2416 0.7591
NFIQ -0.1890 -0.3808 0.1444 0.0117 -0.3420 0.0132 -0.0121 N 0.0175 0.0069 -0.0719
OCL 0.3414 0.2499 0.2271 -0.0788 0.6927 -0.2067 0.6544 -0.5836 0.0446 -0.0068 0.7988
OF -0.0558 -0.0645 -0.1039 -0.0052 0.0883 -0.0079 -0.1368 0.0741 -0.0361 -0.0017 0.0122
PHC 0.3580 0.4141 0.5300 -0.1290 0.5679 0.2351 0.8933 -0.2086 0.0303 0.0515 0.6215
STD 0.4175 0.4266 0.4661 -0.1211 0.6575 0.1858 0.9157 -0.2545 0.0262 0.0575 0.6319
NFIQ -0.2256 -0.3925 -0.1761 0.2087 -0.2670 -0.2824 -0.4156 -0.0671 0.0335 0.0112 -0.1193
Table 8: Inter-class Pearson correlation for minutiae-based features. 02DB2A (top), 04DB1A (middle) and 04DB3A (bottom).
OCL 0.4077 0.3768 0.4040 0.2780 0.0826 0.3166 0.4214 -0.3196 -0.2799 -0.1930 -0.2568
OF 0.0327 0.0391 0.0442 -0.0096 0.0019 -0.0035 0.0491 -0.0040 -0.0987 0.0874 -0.0521
PHC 0.3717 0.3445 0.3735 0.2306 0.0298 0.2787 0.3829 -0.3230 -0.2704 -0.1934 -0.2791
STD 0.2391 0.2267 0.2376 0.1247 -0.0615 0.1630 0.2490 -0.2389 -0.2027 -0.1304 -0.1832
NFIQ -0.6052 -0.5393 -0.5949 -0.4783 -0.4639 -0.5807 -0.5554 0.4461 0.3544 0.2975 0.3198
OCL 0.5576 0.5290 0.5570 0.4649 0.5088 0.4505 0.5536 -0.3599 -0.3677 -0.3178 -0.3986
OF 0.0835 0.0946 0.0859 0.1661 0.0721 0.1334 0.0128 0.0159 0.1975 -0.1621 -0.0372
PHC 0.4036 0.4153 0.4150 0.3462 0.3731 0.3124 0.4184 -0.2908 -0.3245 -0.2718 -0.3121
STD 0.3876 0.4017 0.4003 0.3275 0.3446 0.3149 0.3865 -0.2992 -0.3093 -0.2611 -0.3095
NFIQ -0.1532 -0.1840 -0.1796 -0.1175 -0.1457 -0.1058 -0.1603 0.1778 0.1040 0.1771 0.1825
OCL 0.2447 0.2362 0.2521 0.1304 -0.0361 0.2280 0.2630 -0.2231 -0.1557 -0.1659 -0.2140
OF 0.2929 0.2577 0.2724 0.2786 0.3218 0.3043 0.2854 -0.0661 0.1458 -0.0830 -0.1077
PHC -0.1438 -0.1170 -0.1215 -0.1919 -0.3633 -0.1563 -0.1144 -0.1132 0.0373 0.0158 0.0406
STD -0.0421 -0.0243 -0.0220 -0.1007 -0.2618 -0.0561 -0.0130 -0.1491 -0.0271 -0.0423 -0.0281
NFIQ 0.3195 0.2497 0.2741 0.3971 0.4406 0.3391 0.2953 -0.0524 -0.0716 -0.0840 -0.0885
a great variation between different databases, where
both the reference quality algorithm and proposed
quality metric obtain relatively good result on FVC
2004 DB3 A. This is due to several factors impacted
on image quality and matching performance. In ad-
dition to external factors such as sensor type (Ross
and Jain, 2004) and environment, it might be involved
in image factors, such as contrast, image size, pixel
density, foreground and background area; and corre-
spondingly the factors caused by minutiae template,
such as minutiae location, minutiae reliability, and
other minutiae properties if they are considered.
In this study, a lot of quality features were adopted
for generating quality metric. In this case, it is neces-
sary to analyze the redundancy of quality feature in
the future work. Besides, in order to improve the cur-
ICISSP2015-1stInternationalConferenceonInformationSystemsSecurityandPrivacy
342

rent quality metric, future works of this study will also
focus on feature processing for the quality metric.
REFERENCES
User friendly toolkit for easy integration of state of the art
fingerprint recognition technology.
Alonso-Fernandez, F., Fierrez, J., Ortega-Garcia, J.,
Gonzalez-Rodriguez, J., Fronthaler, H., Kollreider,
K., and Bigun, J. (2007). A comparative study of
fingerprint image-quality estimation methods. Infor-
mation Forensics and Security, IEEE Transactions on,
2(4):734–743.
Chen, T., Jiang, X., and Yau, W. (2004). Fingerprint image
quality analysis. In Image Processing, 2004. ICIP ’04.
2004 International Conference on, volume 2, pages
1253–1256 Vol.2.
Chen, Y., Dass, S. C., and Jain, A. K. (2005). Fingerprint
quality indices for predicting authentication perfor-
mance. In Audio-and Video-Based Biometric Person
Authentication, pages 160–170. Springer.
El Abed, M., Ninassi, A., Charrier, C., and Rosenberger,
C. (2013). Fingerprint quality assessment using a no-
reference image quality metric. In European Signal
Processing Conference (EUSIPCO), page 6.
Feng, J. and Jain, A. K. (2011). Fingerprint reconstruction:
from minutiae to phase. Pattern Analysis and Machine
Intelligence, IEEE Transactions on, 33(2):209–223.
Grother, P. and Tabassi, E. (2007). Performance of biomet-
ric quality measures. Pattern Analysis and Machine
Intelligence, IEEE Transactions on, 29(4):531–543.
Hafiane, A., Seetharaman, G., and Zavidovique, B. (2007).
Median binary pattern for textures classification. In
Image Analysis and Recognition, pages 387–398.
Springer.
Hafiane, A. and Zavidovique, B. (2006). Local relational
string for textures classification. In Image Processing,
2006 IEEE International Conference on, pages 2157–
2160.
Haralick, R. M., Shanmugam, K., and Dinstein, I. H.
(1973). Textural features for image classification. Sys-
tems, Man and Cybernetics, IEEE Transactions on,
(6):610–621.
Jain, A. K., Ross, A., and Prabhakar, S. (2004). An intro-
duction to biometric recognition. Circuits and Systems
for Video Technology, IEEE Transactions on, 14(1):4–
20.
Lee, B., Moon, J., and Kim, H. (2005). A novel measure
of fingerprint image quality using the Fourier spec-
trum. In Jain, A. K. and Ratha, N. K., editors, Society
of Photo-Optical Instrumentation Engineers (SPIE)
Conference Series, volume 5779 of Society of Photo-
Optical Instrumentation Engineers (SPIE) Conference
Series, pages 105–112.
Lim, E., Jiang, X., and Yau, W. (2002). Fingerprint qual-
ity and validity analysis. In Image Processing. 2002.
Proceedings. 2002 International Conference on, vol-
ume 1, pages I–469–I–472 vol.1.
Maio, D., Maltoni, D., Cappelli, R., Wayman, J. L., and
Jain, A. K. (2004). Fvc2004: Third fingerprint ver-
ification competition. In Biometric Authentication,
pages 1–7. Springer.
Nanni, L. and Lumini, A. (2007). A hybrid wavelet-
based fingerprint matcher. Pattern Recognition,
40(11):3146–3151.
Nanni, L., Lumini, A., and Brahnam, S. (2012). Survey on
lbp based texture descriptors for image classification.
Expert Systems with Applications, 39(3):3634 – 3641.
Ojala, T., Pietikainen, M., and Maenpaa, T. (2002). Mul-
tiresolution gray-scale and rotation invariant texture
classification with local binary patterns. Pattern Anal-
ysis and Machine Intelligence, IEEE Transactions on,
24(7):971–987.
Olsen, M. A., Xu, H., and Busch, C. (2012). Gabor filters
as candidate quality measure for nfiq 2.0. In Biomet-
rics (ICB), 2012 5th IAPR International Conference
on, pages 158–163. IEEE.
Pietik
¨
ainen, M. (2011). Computer vision using local binary
patterns, volume 40. Springer.
Ross, A. and Jain, A. (2004). Biometric sensor interop-
erability: A case study in fingerprints. In Biometric
Authentication, pages 134–145. Springer.
Ross, A., Shah, J., and Jain, A. K. (2005). Toward recon-
structing fingerprints from minutiae points. In Defense
and Security, pages 68–80. International Society for
Optics and Photonics.
Saad, M., Bovik, A. C., and Charrier, C. (2012). Blind im-
age quality assessment: A natural scene statistics ap-
proach in the DCT domain. IEEE Transactions on
Image Processing, 21(8):3339–3352.
Shen, L., Kot, A., and Koo, W. (2001). Quality measures of
fingerprint images. In IN: PROC. AVBPA, SPRINGER
LNCS-2091, pages 266–271.
Tabassi, E., Wilson, C., and Watson, C. (2004). Nist finger-
print image quality. NIST Res. Rep. NISTIR7151.
Watson, C. I., Garris, M. D., Tabassi, E., Wilson, C. L.,
Mccabe, R. M., Janet, S., and Ko, K. (2007). User’s
guide to nist biometric image software (nbis).
YAO, Z., Charrier, C., and Rosenberger, C. (2014). Util-
ity validation of a new fingerprint quality metric.
In International Biometric Performance Conference
2014. National Insititure of Standard and Technology
(NIST).
FingerprintQualityAssessmentCombiningBlindImageQuality,TextureandMinutiaeFeatures
343
