
Adaptive Traffic Signal Control of Bottleneck Subzone based
on Grey Qualitative Reinforcement Learning Algorithm
Junping Xiang
1,2
and Zonghai Chen
1
Department of Automation, University of Science and Technology of China, Hefei, China
Lianyungang JARI Electronics Co., Ltd. of CSIC, Lianuyungang, China
Keywords: Grey Qualitative, Reinforcement Learning, Bottleneck Subzone Control, BP Neural Networks.
Abstract: A Grey Qualitative Reinforment Learning algorithm is present in this paper to realize the adaptive signal
control of bottleneck subzone, which is described as a nonlinear optimization problem. In order to handle
the uncertainites in the traffic flow system, grey theory model and qualitative method were used to express
the sensor data. In order to avoid deducing the function relationship of the traffic flow and the timing plan,
grey reinforcement learning algorithm, which is the biggest innovation in this paper, was proposed to seek
the solution. In order to enhance the generalization capability of the system and avoid the "curse of
dimensionality" and improve the convergence speed, BP neural network was used to approximate the Q-
function. We do three simulation experiments (calibrated with real data) using four evaluation indicators for
contrast and analyze. Simulation results show that the proposed method can significantly improve the traffic
situation of bottleneck subzone, and the algorithm has good robustness and low noise sensitivity.
1 INTRODUCTION
Road bottleneck or congestion, which is a special
case of imported lanes of road are saturation or near
saturation, is the performance of road traffic
deterioration. In order to fully enhance the urban
road network resource utilization efficiency and
avoid bottlenecks or even traced queuing
phenomenon of individual sections, the primary
objective of regional traffic signal coordination
control should be to maximize the number of
vehicles leaving the subzone per unit time. Taking
into account the conservation of subzone traffic
flow, the control target is equivalent to minimize the
average carrying vehicles of all bottlenecks in the
specified time period.
Adaptive regional coordination control (TSC)
has been a goal of intelligence traffic signal control
researchers. In traffic signal control system, an
signal controller can be seen as an intersection agent,
and all signal controllers of controlled subzone can
be seen as multi-agent cluster. A controller agent can
be viewed as perceiving its environment (traffic
flow) through sensors (traffic flow detectors) and
acting upon that environment through effectors
(traffic signal lights). Based on multi-agent
reinforcement learning (RL) technology, combined
with grey system theory and neural network tool, we
try to construct an effective traffic signal
coordination control model for bottleneck subzone
which has some saturated or nearly saturated
sections, but also has some relatively smooth
sections.
There are many kinds of artificial intelligence
methods that have been used to implement adaptive
traffic signal control and ease the traffic pressure.
The adaptive traffic signal control techniques in
Chun-gui (2009), Arel et al (2010) and Prashanth et
al (2011) are based on the reinforcement learning
and rely on the Q-learning algorithm with function
approximation (Baird, 1995), State-Action, Reward-
State Action (SARSA) (Loch and Singh, 1998) and
the Policy Gradient Actor Critic algorithm (Sutton et
al, 2000). Yujie et al (2011) have proposed a traffic
signal controller based on three layered neural
network to control the traffic lights in urban road
traffic conditions. Shen and Kong (2009) used
neural network (NN) with back propagation to
implement fuzzy logic for devising a technique for
traffic coordination control. Choy et al (2006) have
also used hybrid system of neural network and fuzzy
logic for designing a TSC and carried out
simulations for comparing the working of SPSA-
295
Xiang J. and Chen Z..
Adaptive Traffic Signal Control of Bottleneck Subzone based on Grey Qualitative Reinforcement Learning Algorithm.
DOI: 10.5220/0005269302950301
In Proceedings of the International Conference on Pattern Recognition Applications and Methods (ICPRAM-2015), pages 295-301
ISBN: 978-989-758-077-2
Copyright
c
2015 SCITEPRESS (Science and Technology Publications, Lda.)

NN, GLIDE and hybrid NN. Teo et al (2010)
introduced genetic algorithm in their paper to
optimise the traffic flow control. Choy et al (2006)
also made use of GA to optimise the parameters of
fuzzy controller used in their distributive multi-agent
traffic signal controller. Ahmad et al (2014) first
proposed an earliest deadline (EDF) based
scheduling to reduce urban traffic congestion.
In this paper, the adaptive signal control of
bottleneck subzone is described as a nonlinear
optimization problem, and solved using a BP Neural
Network based Grey Qualitative Reinforment
Learning algorithm (BP-GQRL), which can handle
the uncertainty in traffic flow control system and
alleviate traffic congestion spread. Grey qualitative
theory has been successful in robot navigation
applications and qualitative simulation applications
(Shujie et al, 2011; Yuanliang et al, 2008; Chunlin et
al, 2008; Yuanliang et al, 2004).
The remainder of the paper is organized as
follows: Section 2 describes the mathematical model
of the problem. Section 3 describes the proposed
BP-GQRL algorithm in detail. The simulations are
carried out in section 4 to verify the effectiveness
and robustness of our method, and section 5
concludes our work.
2 PROBLEM DESCRIPTION
Any traffic signal control bottleneck subzone can be
defined as a collection of sections of roads. A typical
bottleneck subzone topology diagram is shown in
Figure 1. Road carrying capacity is determined by
the length of road and the effective lengths of the
vehicles. When not considering the interaction
between the subzones, we can say that the current
bottleneck subzone is independent. Some sections
with small traffic pressure, whose carrying
capacities are considered to be +∞, do not require
monitoring their carrying capacitites, and are called
"ordinary sections". Accordingly, other sections are
called "bottleneck sections". Our optimization goal
is to minimize the average number of carrying
vehicles of bottleneck sections and limit the number
of carrying vehicles of each bottleneck section
within an acceptable range.
Assuming the set of bottleneck sections of
subzone is R
R
|
i 1,2,⋯,N
, N is the number
of bottleneck sections. According to the traveling
directions of flow, one bottleneck section R
can be
divided into two links: input link R
L
,
|j
1,2,⋯,N
and output link R
L
,
|k
1,2,⋯,N
(As shown in Figure 1, there are four
input links and four output links). L
,
is the inlet
lane j of R
and N
is the number of inlet lanes of R
.
L
,
is the outlet lane k of R
and N
is the
number of outlet lanes of R
. The vehicle flows in
input link and output link are determined by the
traffic signal control schemes of the upstream and
downstream signal controllers. The changes of the
carrying vehicles in the links are the direct reflection
of the control effect.
Supposing that ft,i is the number of carrying
vehicles of bottleneck section R
at time t, f
t,i,j
is the instantaneous passing vehicle number of inlet
lane L
in,k
i
, and f
t,i,j is the instantaneous passing
vehicle number of outlet lane L
,
. f
t,i,j
and
f
t,i,k can be obtained from the traffic flow
detectors laying at the inlet and outlet sections,
respectively. The detectors may be coil detectors,
video detectors, microwave detectors or any other
types of detectors. According to road traffic
conservation, ftt,i can be calculated by the
following equation (1):
f
tt,i
f
t,i
f
t,i,j
dt
f
t,i,k
dt
(1)
The objective function of bottleneck control
optimization is:
min
1
N
STA
t,i
STA
t,i
f
t,i
U
i
s.t. FMIN
f
t,i
FMAX
,∀t,i;
(2)
where U
i
is the saturated flow of R
(which is the
maximum carrying capacity of the section, an
inherent attribute of the road, and whose value can
be selected by experience), STA
t,i
is the saturation
of R
(which reflects the traffic state of the section),
and FMIN
and FMAX
are the wanted lower and
upper limits of the number of carrying vehicles of R
,
respectively. Pt is the dynamic traffic timing plan,
namely the combination of the signal lights state and
vehicles release time (including the transition time,
such as the green flash time and the yellow light
time) of each stage of each intersection in the
bottleneck subzone.
ICPRAM2015-InternationalConferenceonPatternRecognitionApplicationsandMethods
296
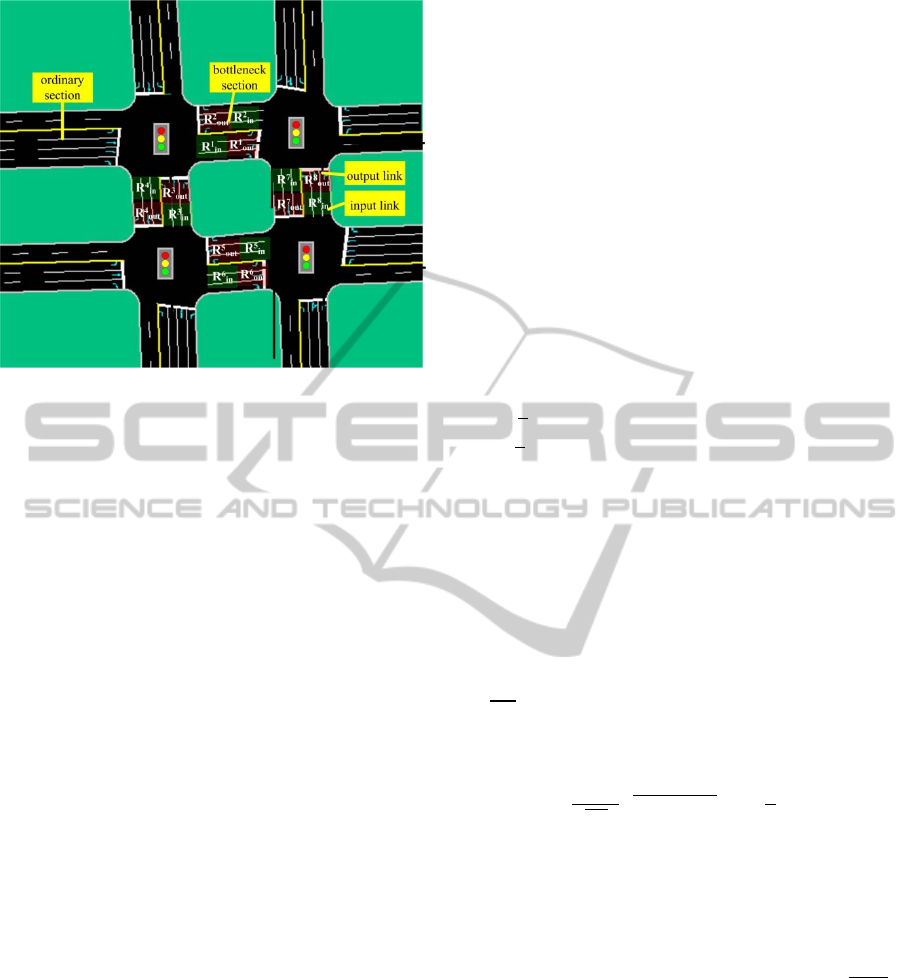
Figure 1: A typical bottleneck subzone topology diagram.
Suppose that the subzone is composed of M
intersections. For any one intersection C
m
1,2,⋯M, supposing that the set of traffic signal
stage (a combination of signal phases) is S
S
g|g 1,2,⋯B
, then, at time t, the vehicles
release time of stage S
i is SG
i,t (unit:
seconds). The solution of the optimization problem
is the optimal dynamic traffic timing plan. Based on
the above assumptions, we can get:
P
t
SG
g,t
|1gB
,1mM
(3)
3 METHOD
In the optimization problem defined by equations (1)
to (3), the function relationship of f
t,i and Pt is
not explicitly expressed. Although there are a lot of
"model-driven" methods that can deduce the
function relationship between f
t,i and Pt
approximately, here we do not intend to make this
attempt based on the following reasons: (1)
Numerous confounding factors, such as pedestrians
and non-motorized vehicles etc, make many
uncertainties in the traffic flow system, and we can
only get the approximate function. (2) Many " data-
driven" methods, such as reinforment learning
method, can solve above optimization problem
without knowing the exact function relationship. In
order to handle the uncertain error of the traffic flow
detectors, grey theory model and qualitative method
were used to express the sensor data. In order to
avoid deducing the function relationship between
traffic flow and timing plan, grey reinforcement
learning algorithm was adopt to seek the solution. In
order to enhance the generalization capability of the
system and avoid the "curse of dimensionality" and
improve the convergence speed, BP neural network
was used to approximate the Q-function.
3.1 Grey Qualitative Representation of
Data
3.1.1 Probability Grey Number
The grey system theory, which originated in the
1980s, mainly focuses on modeling a system using
“small sample” information(Julong, 1985).
Considering the uncertainty, information is usually
represented by grey numbers, which are usually
intervals. For example, given an observation value y
of a system output, the grey system theory
researchers prefer to represent it by a grey number
⨂y
,y. It means that the true value of the output
is in y
,y, but we do not know exactly which one it
is. To obtain the exact value, a whitening weight
function is usually defined on the grey number to
indicate the observer’s preference of the values in
the interval.
In this paper, we use Probability Grey Number to
describe the observation value, which is defined as
follows:
Definiton 1. Probability grey number ⨂
,
,
whose whitening weight function is the probability
density function of the normal distribution
N
,σ
, is a special interval grey number defined
in the real interval [a,b](a<b), where σ
satisfies the
following formula:
1
√
2πσ
e
.
dx
α
2
(4)
1α is the measure of probability grey number,
denoted as follow:
μ
⨂
,
1α,α∈0,1
(5)
From the above definition, the distribution
parameters of probability grey number is σ
/
,
Z
/
is the α/2 fractile of standard normal
distribution N (0,1). If we know any two of the three
elements (i.e. the interval [a,b], measure 1α and
distribution parameter σ
) in the probability grey
number, and the third will be finalized.
Definition 2. The similarity between two
probability grey numbers, ⨂
,
and ⨂
,
, is
defined as follows (seeing shadow area in Figure 2
below):
Sim⨂
,
,⨂
,
μ
⨂
,
μ
⨂
,
(6)
AdaptiveTrafficSignalControlofBottleneckSubzonebasedonGreyQualitativeReinforcementLearningAlgorithm
297

where p is the intersection of whitening weight
functions of ⨂
,
and ⨂
,
.
Figure 2: Definition of similarity between grey numbers
⨂
,
and.⨂
,
3.1.2 Grey Qualitative Description of the
System Observations
As mentioned earlier, saturation STA
t,i
is the
observation value of the traffic system, which
reflects the road service level and the control target.
Because of the uncertainty of measurement error,
supposing that one observation value STA
t,i
corresponds to a probability grey number ⨂t,i.
According to the following six principles based on
traffic flow theory, the service level SL
t,i
of
section R
at time t can be qualitatively divided into
six levels.
Principle 1: If STA
t,i
∈∞,0.35, which
means that the traffic is smooth and volume is less
than 60% of road capacity, then SL
t,i
1 and the
corresponding grey number of this level is ⨂
⨂
,.
, μ⨂
β
t.
Principle 2: If STA
t,i
∈ 0.35,0.64, which
means that the traffic is steady with a alight delay,
and volume is nearly 70% of road capacity, then
SL
t,i
2 and the corresponding grey number of
this level is ⨂
⨂
.,.
, μ⨂
β
t.
Principle 3: If STA
t,i
∈ 0.64,0.77, which
means that the traffic is steady with some delay, and
volume is nearly 80% of road capacity, then
SL
t,i
3 and the corresponding grey number of
this level is ⨂
⨂
.,.
, μ⨂
β
t.
Principle 4: If STA
t,i
∈ 0.77,0.9, which
means that the traffic is not steady with tolerable
delay, and volume is nearly 90% of road capacity,
then SL
t,i
4 and the corresponding grey number
of this level is ⨂
⨂
.,.
, μ⨂
β
t.
Principle 5: If STA
t,i
∈ 0.9,1.00, which
means that the traffic is not steady with intolerable
delay, and volume is close to the road capacity, then
SL
t,i
5 and the corresponding grey number of
this level is ⨂
⨂
.,.
, μ⨂
β
t.
Principle 6: If STA
t,i
∈ 1.00,∞, which
means that the traffic is not steady with tolerable
delay, and volume is nearly 90% of road capacity,
then SL
t,i
6 and the corresponding grey number
of this level is⨂
⨂
.,∞
, μ⨂
β
t.
β
t is the parameter to be optimized, whose
initialized value is selected according to the artificial
experience or obtained through parameter learning
from the historical detector data. With the operation
of the system, the grey degree will gradually
decrease, the value of β
t will be updated with the
change of the data.
3.2 System Decision
The output of the traffic signal optimization system
described here is the optimized dynamic traffic
signal timing plan SG
g,t
. The decision of agent
is: at the start time of each stage g of each
intersection m, increase or reduce the vehicle release
time of current stage T seconds, or keep it
unchanged. In general, T is set to 4, which reflects
the adjustment step length of the green light time,
and its value should not be too large. The decisions
are executed by the traffic signal controllers in
intersections.
3.3 BP-GRL Algorithm
The uncertainties of bottleneck subzone signal
control system mainly come from the detectors, the
environmental status and the feedbacks. For the
subzone with N bottleneck sections and M
intersections, the state set and action set can be
expressed as follows:
GS GS
,GS
,⋯,GS
GA GA
,GA
,⋯,GA
GS
∈⨂
,⨂
,⨂
,⨂
,⨂
,⨂
GA
∈
T,0,T
(7)
where i1,2,⋯,N and j1,2,⋯,M.
At the start of time step t of each stage, agent
sensing the external environment by the detectors
and get the grey state GSt. Then, by using grey
RL model, the agent will select an action GA(t) to
execute. At the start of the time step t+1 of next
stage, the agent observes subsequent state GSt1,
and gets the the corresponding compensation
according to the grey enhancement function
GR
,
. Combining equation (7), the grey
enhancement function GR
,
, which is used
to reward the action which makes the grade of road
service level improved and not less than four, is
defined as follows:
ICPRAM2015-InternationalConferenceonPatternRecognitionApplicationsandMethods
298
GR
,
∑
SI
t1
∑
SI
t
SI
t
.,
,,,
,⨂
,
(8)
We use GQ values of grey Q learning method to
describe the reward discounts and expectations. BP
neural networks can be used to learn GQ values, and
each bottleneck section corresponds to a neural
network. The output of a neural network is the GQ
values of each stage of the intersection, and the input
of a neural network is the STA
t,i
values.
The traffic bottleneck area signal control
algorithm based on grey reinforcement learning and
neural networks is described below. For each BP
neural network:
Step0:Initialize the starting timing plan, the agent
state/action set and the neural network.
Step1:At the start of time step t of each stage of
each intersection, detect the states STA
t,i
of all
bottleneck sections and compute the state GS
t
and
the output GQ
,
,
of network.
Step2:According to "greedy exploration strategy"
(i.e., choosing the actions which can maximize the
GQ value), select the current decision GA
t
and
execute it.
Step3:Observe the subsequent state set STA
t
1,i
, calculate the grey number GS
t1
, and
receive the timely feedback value r
GR
,
according to the formula (8).
Step4:Update GQ
,
based on formula (9)
as follows:
GQ
,
1α
GQ
,
,
αr
γ
max
GQ
,
,
(9)
Step5:Update the weight ωt of neural network
as ωt1 using the error signal et defined in
formula (10), so that the actual output of the neural
network can approximate the desired output
GQ
,
.
etGQ
,
GQ
,
,
(10)
Step6:Go to the start time step t+1 of next stage,
and repeat Step1~ Step6.
4 SIMULATION AND ANALYSIS
4.1 Experimental Method
In order to verify the effectiveness of the proposed
method, we use the microscopic traffic simulation
commercial software VISSIM to simulate the
control effect of a bottleneck subzone in the city of
Lianyungang of China. By collecting the traffic flow
and road topology information of the subzone, we
calibrate a simulation intersection with real data.
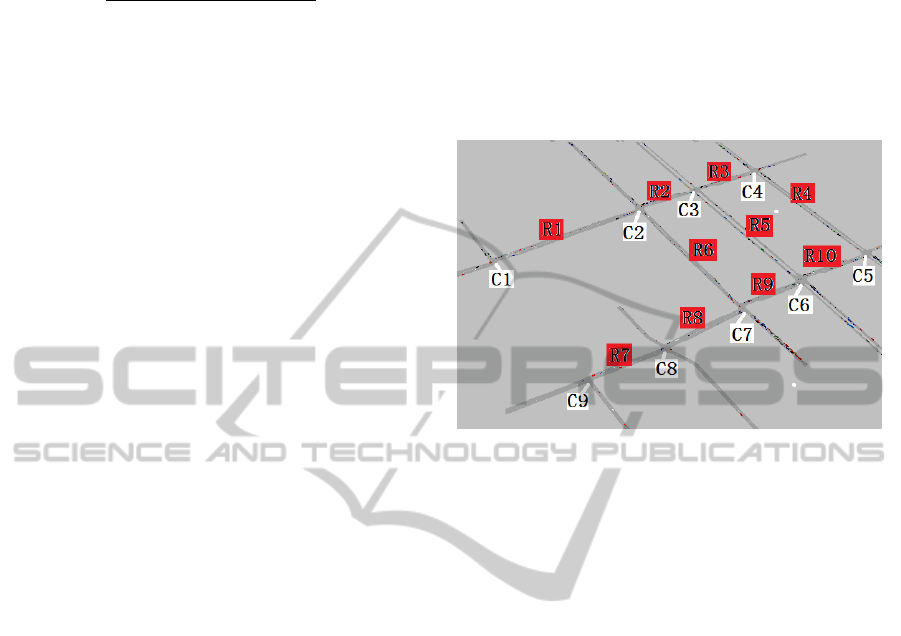
The region topology diagram is shown in Figure 3.
There are 9 intersections and 10 bottleneck sections
in the subzone, and local traffic in the periods of
morning and evening peaks is congested.
Figure 3: The subzone topology diagram.
Currently, the traffic signal timing plans in the
region has been optimized by the professional
engineers with more than five years of work
experience. The present signal controllers implement
the "multi-period timing control" mode, whose plans
are fixed without any dynamic adjustment for each
period. Commissioned by the traffic management
departments, we need to assess the timing plans in
this subzone, to determine whether it is necessary to
change the timing plan or perform adaptive control
scheme.
In order to verify the robustness of BP-GRL
model in a situation where the detected data is not
accurate or with noise, the Gaussian white noise are
added to the output of each VISSIM detector, whose
mean is zero and variance is four.
The three experiments that can be used to
contrast and analyze include: (a) the experiment with
the existing fixed timing plans optimized by
professional engineers, which is recorded as FIX
method; (2) the experiment with proposed BP-GRL
method based on Gaussian white noise data, which
is recorded as G-BP-GRL method; (3) the
experiment with proposed BP-GRL method without
Gaussian white noise, which is recorded as BP-GRL
method. The four evaluation indicators that can be
used to evaluate the results include: (1) delay, (2)
parking time, (3) the number of stops and (4) the
number of passing vehicles.
AdaptiveTrafficSignalControlofBottleneckSubzonebasedonGreyQualitativeReinforcementLearningAlgorithm
299
4.2 Results and Analysis
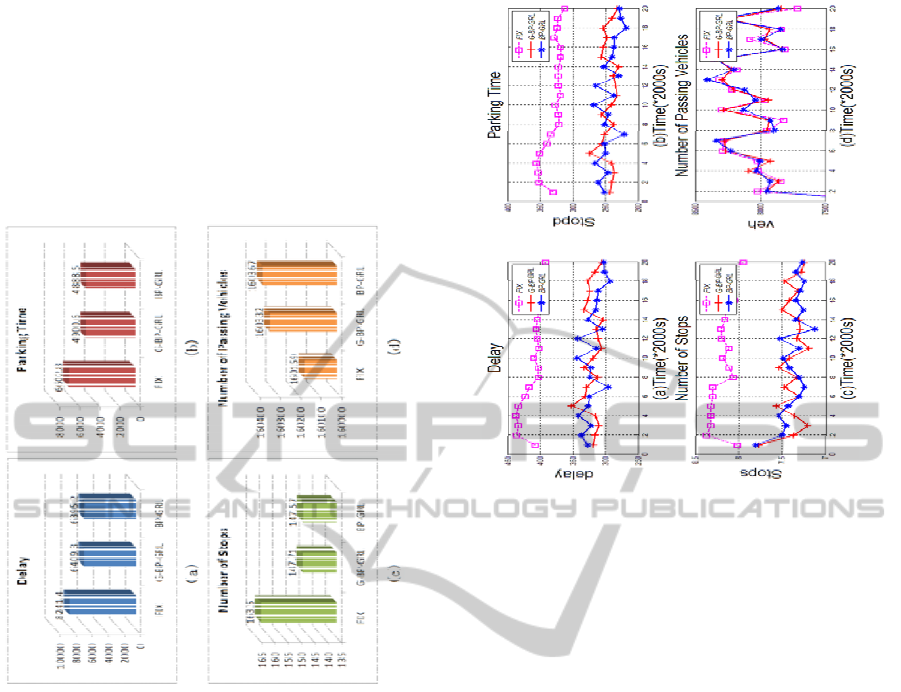
We conducted 40,000 seconds simulation three
times, correspongding to the FIX experiment, G-BP-
GRL experiment and BP-GRL experiment. One
simulation second is equal to five simulation steps.
The sums of the evaluation indicator values are
shown in Figure 4 and the numerical trends are
shown in Figure 5 for comparisons.
Figure 4: The statistical results of the sums of the
evaluation indicator values.
Through data analysis, we find that, compared with
FIX, the delays, the parking time, the number of
stops and the number of passing vehicles of G-BP-
GRL are reduced by 18.05%, 22.1%, 2.07% and -
337 pcu (per car unit) respectively, while BP-GRL
are reduced 18.57%, 22.41%, 2.03% and -618 pcu
respectively. Thus, regardless of whether the data
have a certain detector noise or not, the results of
BP-GRL algorithm are much better than the FIX
method, and the improvement is obvious. Because
we use grey qualitative approach to express the
observation values, the system has good robustness
and low sensitivity to data noise.
By the analysis, we konw that the existing fix
timing plans have large room for improvement, and
recommend that traffic managers should set up the
addition of traffic flow detectors and implement the
adaptive control strategy to achieve better control
effect.
Figure 5: The numerical trends of the valuation indicators.
5 CONCLUSIONS
Essentially, the bottleneck is the inevitable result of
the growing traffic demand. Excessive traffic
demand makes road traffic congestion arising from
lack of capacity for queue. A Grey Qualitative
Reinforment Learning algorithm is present in this
paper to realize the adaptive signal control of
bottleneck subzone, which is described as a
nonlinear optimization problem. Firstly, we use grey
theory model and qualitative method, which can
handle the uncertainites in the traffic flow system, to
express the sensor data. Secondly, BP Neural
Network based Grey Reinforcement Learning (BP-
GRL) algorithm, which is the biggest innovation in
this paper, was adopt to seek the solution. So we do
not need to deduce the function relationship of
traffic flow and timing plan. Finally, we do three
experiments using four evaluation indicators for
contrast and analyze. Simulation results show that
the proposed method can significantly improve the
traffic situation of bottleneck subzone, and the
method has good robustness and low noise
sensitivity. Combining with pedestrian and non-
motorized traffic data, the model will be further
extended in the future.
ICPRAM2015-InternationalConferenceonPatternRecognitionApplicationsandMethods
300

ACKNOWLEDGEMENTS
This work was supported by National Natural
Science Foundation of China (Grant No. 61375079).
REFERENCES
Ahmad A., Arshad R., Mahmud S. A., Khan G. M. and
Hamed S. A., 2014. Earliest-Deadline-Based
Scheduling to Reduce Urban Traffic Congestion. IEEE
Transactions of Intelligent Transportation Systems.
15(4): 1510-1526..
Baird L., 1995. Residual algorithms: Reinforcement
learning with function approximation. In Proc. Int.
Workshop Conf. Mach. Learn. 30–37.
Chun-gui L., Meng W., Shu-hong Y., and Zeng-Fang Z.,
2009. Urban traffic signal learning control using sarsa
algorithm based on adaptive rbf network. In Proc.
ICMTMA’09, international conference on measuring
technology and mechatronics automation. 3: 658–661.
Chunlin C., Daoyi D., Zonghai C., Haibo W., 2008. Grey
Systems for Intelligent Sensors and Information.
Processing Journal of Systems Engineering and
Electronics. 19(4): 659-665.
Chunlin C., Daoyi D., Zonghai C., Haibo W., 2008.
Qualitative control for mobile robot navigation based
on reinforcement learning and grey system.
Mediterranean Journal of Measurement and Control.
4(1):1-5.
Choy M. C., Srinivasan D. and Cheu R. L., 2006. Neural
Networks for Continuous Online Learning and Control.
IEEE Transactions on Neural Networks. 7(3): 261-272.
Julong D., 1985. Grey Control System. Huazhong
University of Science and Technology Press. Wuhan.
Loch J. and Singh S., 1998. Using eligibility traces to find
the best memoryless policy in partially observable
Markov decision processes. In Proc. 15th Int. Conf.
Mach. Learn. 323–331.
Prashanth L. and Bhatnagar S., 2011. Reinforcement
learning with average cost for adaptive control of
traffic lights at intersections. In Proc. 14th Int. IEEE
Conf. ITSC. 1640–1645.
Shen G. J. and Kong X. J., 2009. Study on road network
traffic coordination control technique with bus priority.
IEEE Transactions on Syst.ems, Man and Cybernetics,
Part C: Applications and Review. 39(3): 343–351.
Shujie L., Zonghai C., 2011. Analysis and Prospect of
Qualitative-Quantitative Representation Method of
Uncertain Knowledge. System Simulation Technology
& Application. 13: 1095-1103.
Sutton R. McAllester S., Singh D., S., and Mansour Y.,
2000. Policy gradient methods for reinforcement
learning with function approximation. Adv. Neural Inf.
Process. Syst. 12(22): 1057–1063.
Teo K. T. K., Kow W. Y. and Chin Y.K, 2010.
Optimization of Traffic Flow within an Urban Traffic
Light Intersection with Genetic Algorithm. Second
International Conference on Computational
Intelligence, Modelling and Simulation. 172-177.
Wei W., Zhang Y., Mbede J., Zhang Z., and Song J., 2001.
Traffic signal control using fuzzy logic and moga. In
Proc. IEEE Int. Conf. Syst.,Man, Cybern. 2: 1335–
1340.
Yuanliang H., Zonghai C., Wangshen G, 2004. Grey
Qualitative Simulation. The Journal of Grey System.
16 (1): 5~20.
Yujie D., Jinzong H., Dongbin Z. and Fenghua Zhu, 2011.
Neural Network Based Online Traffic Signal
Controller Design with Reinforcement Training. 14th
International IEEE Conference on Intelligent
Transportation Systems Washington. 1045-1050.
AdaptiveTrafficSignalControlofBottleneckSubzonebasedonGreyQualitativeReinforcementLearningAlgorithm
301
