
Modeling a Public Hospital Outpatient Clinic in Peru using Discrete
Simulation
Valeria Quevedo and Javier Chapilliquen
Faculty of Engineering, Universidad de Piura, Av. Ramon Mugica 131, Piura, Peru
Keywords: Discrete Simulation, Simulation Modelling, Public Hospital, Outpatient Clinic.
Abstract: Having insurance or not makes a difference in terms of the procedure patients need to follow to be attended
in public hospitals in Peru. Studies show a high dissatisfaction towards the service offered by public
hospitals, mainly due to long waiting times, specially for patients with insurance. The initiatives
implemented by the government to solve these problems were not supplemented with a rigorous analysis to
help quantify their impact. The main objective of this study is to assess the quality of care at one of the most
visited public hospitals in Peru. Discrete simulation was used to build a model which was validated through
historical data and hospital personnel. The model is capable of measuring the service level and it facilitates
the identification of bottlenecks. It identified the most critical medical specialties most utilized and that have
the longest queues. The results also serve to identify the services with a low utilization rate. High idle time
during the insurance verification process was identified as a problem. It seems insurance verification could
be integrated with admission tasks or during other services. The model can be applied to any public hospital
in Peru given the fact that their outpatients processes are similar.
1 INTRODUCTION
The health system in Peru has two sectors: public
and private. The public sector is divided in two
programs: the government subsidized program and
the social insurance program. The social insurance
program is supported by employee and employer
direct contributions. In Peru there are hospitals,
EsSalud hospitals, exclusively for people having
social insurance.
People without social insurance go to MINSA
hospitals. Here, the government offers health
services to those without social insurance. If these
people are poor, they have access to a subsidized
insurance program called SIS “Seguro Integral de
Salud” (Integral health insurance). To maintain this
subsidized insurance, they need to make a monthly
minimum payment to cover the hospital’s variable
costs. If they are not eligible for the SIS insurance or
do not make this payment, and do not have social
insurance, they can go to the MINSA establishments
as well but they need to pay for the service
(Dirección General Parlamentaria, 2010).
About 30% of the Peruvian population has either
social insurance or private insurance. About 31%
has the subsidized insurance (SIS), and about 38%
of the population lack any type of medical insurance
(Instituto Nacional de Estadística e Informática,
2012), Table 1. The percentage of people without
insurance has diminished since 2008, from 58% to
38.1%. (Jacqueline Elizabeth Alcalde-Rabanal,
Oswaldo Lazo-González, & Gustavo Nigenda,
2011).
Table 1: Percentage of population with and without
insurance*, 2012.
Indicator
Piura
2012
Peru
2012
Population with social
insurance 20.3 24.4
Population with private
insurance 3.65 6.06
Population with
subsidized insurance (SIS) 31.2 31.4
Population with some
insurance (subsidized or not) 55.1 61.9
Population without
insurance 44.9 38.1
*Data retrieved from INEI (Instituto Nacional de
Estadística e Informática), 2012.
Another critical factor in the health system is the
number of physicians per 1000 units of population.
389
Quevedo V. and Chapilliquen J..
Modeling a Public Hospital Outpatient Clinic in Peru using Discrete Simulation.
DOI: 10.5220/0005271903890394
In Proceedings of the International Conference on Operations Research and Enterprise Systems (ICORES-2015), pages 389-394
ISBN: 978-989-758-075-8
Copyright
c
2015 SCITEPRESS (Science and Technology Publications, Lda.)

Peru has a physician’s density of 1.42 (Instituto
Nacional de Estadística e Informática, 2012), while
other countries in South America have larger
densities, such as 1.76 for Brazil, and 3.16 for
Argentina (Central Intelligence Agency).
The hospital used in this study is located in Piura
which is the second largest province in Peru. Piura
has approximately 1.8 million habitants, 6% of the
total population in Peru. For the province of Piura
32.1% of the population is considered poor. In 2012,
there were 27 hospitals in Piura or if evenly
distributed each hospital serves on average 66,666
habitants; compared to 44,059 habitants per hospital
in Lima. Piura has a physician density about 0.75,
compared to the national average of 1.42. In Piura,
the percentage of people with some insurance is
55.1% (Instituto Nacional de Estadística e
Informática, 2012).
The hospital examined in this study is a MINSA
hospital where people with SIS insurance or without
insurance can gain admittance. This hospital is one
of the most visited in the region.
Satisfaction surveys administered by the Peruvian
Health Ministry show a very high dissatisfaction rate
towards the service offered by the hospitals, mainly
due to the long waiting times (MINSA,
www.minsa.gob.pe). This hospital is not exempt
from that situation. While many initiatives that have
been implemented to solve the problems all of these
initiatives have used quality tools such as
satisfaction survey and brainstorming without using
quantitative tools to quantify the impact of different
possible solutions by carrying out “what-if” scenario
analysis.
Discrete event simulation has been used for a
variety of health care applications (Jahn et.al. 2010).
For example, it has been used to improve patient
care in emergency departments (Abo-hamad, and
Arisha, 2013; Brenner et.al., 2010; Cabrera et. al.,
2012; Hoot et.al., 2008; Jamon and Lin, 2012; and
Zeng et. al., 2012), to improve bed utilization in
hospitals (Holm et.al., 2012), to model outpatient’s
clinic (Al-Araidah et. al., 2012; Villamizar et.al.,
2011), to analyze the capacity of the Intensive Care
Unit at hospitals (Troy and Rosenberg, 2009), and to
improve radiation therapy planning process (Werker
et.al. 2009).
For all the above, discrete simulation with
ARENA was used for modelling the outpatient’s
clinic of the MINSA hospital under study. The
simulation tool can help hospital management assess
the service level through measuring queue length,
waiting times, and utilization rates for the different
health services. Additionally, it allows trying many
operational changes to determine an optimal system
configuration.
2 SYSTEM DESCRIPTION
The outpatient clinic at the hospital studied offers 25
medical specialties. In 2010, 60,351 outpatients were
serviced. As it can be seen in Figure 1, the demand
does not fluctuate much across time. The drop in
October and November for 2010 was due to a strike
at the hospital during which only critical cases were
admitted.
Figure 1: Monthly demand for the outpatient clinic at the
hospital, 2010.
According to the hospital records, 30% of patients
had SIS insurance, 60% did not, and the rest were
exonerated of the payment due to their economic
situation. These percentages are also steady over
time.
The outpatient clinic has a four stage service
process. First is admission. Second is the insurance
documentation (SIS module) just for the patients
with subsidized insurance, where they will receive
the payment waiver. The third stage is the medical
assessment itself. Finally, the last stage includes
medical support services such as pharmacy, x-ray,
and laboratory tests. From Monday to Friday, all
areas work from 7:00 am to 1:00 pm, except x-ray
which works until 4:00 pm.
The process at the outpatient clinic is:
(1) Patients arrive at the clinic’s admission area,
where they can schedule a medical appointment
for that day. If the patients have insurance, they
must complete the insurance process; here, the
insurance staff verifies if the insurance will
cover the medical expenses, otherwise the
patient need must pay for service.
(2) Patients go to the waiting room to be called by
the specialist for their assessment. The hospital
Jan Feb Mar Apr May June Jul Aug Sep Oct Nov Dec
Total
5686 5373 6519 5541 6005 5847 5360 5472 5581 3238 895 4834
0
2000
4000
6000
8000
Number of patients
Monthly Hospital Demand at its Outpatients
Clinic, 2010
ICORES2015-InternationalConferenceonOperationsResearchandEnterpriseSystems
390
offers 25 specialties. Most visits are for
obstetrics, gynaecology, paediatrics,
ophthalmology, gastroenterology, cardiology,
echography, internal medicine, neurology,
odontology, otorhinolaryngology,
rheumatology, orthopedics, and urology.
(3) After the assessment, patients go to pharmacy,
x-ray diagnostics, and laboratory, according to
the doctor’s instructions. Laboratory is the only
one that has two subsystems: reception and lab
test. Before these services can be utilized the
patients with insurance must go through an
insurance process to receive a payment waiver
for services.
Throughout the process, patients’ experience long
waiting times and queues.
3 SIMULATION MODEL
An extended survey was carried out in order to
collect data on the arrival process, and the service
times at the different stages. To represent the real
process, process observation; database retrieval;
interviews of doctors, nurses, and hospital
employees; and time studies were conducted.
The service process was modeled by a discrete
event simulation system, using Arena software
(Kelton et. al., 2009, and Law & Kelton, 2007)
3.1 Input Analysis
Input Analyzer from Arena was used to model the
probability distributions for describing the time
between arrivals and service time, Table 2.
Table 2: Probability distributions.
Variables
Probability
distribution
Time between patients’ arrivals Exponential
Receptionist’s service time for
patients with insurance Erlang
Receptionist’s service for patients
without insurance Lognormal
Service time of the 15 specialties Triangular
Service time of pharmacy, x-ray,
and laboratory Triangular
Service time of the receptionist at
the laboratory Normal
External arrivals to these services—those
coming from hospitalization or the emergency room
were also considered in the model. The time
between external arrivals in the pharmacy was
described as a weibull distribution, while x-ray and
laboratory external arrivals were described as
uniform distributions.
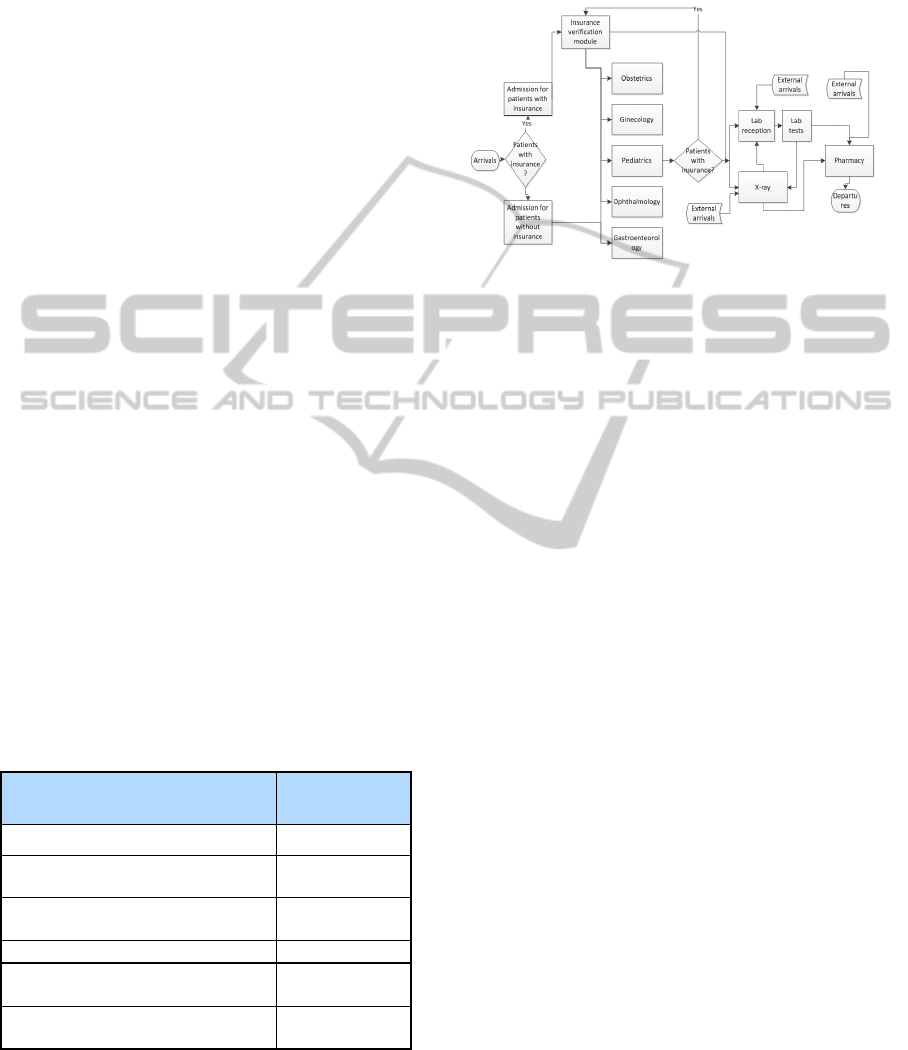
Figure 2: Process flow of the outpatients’ clinic.
3.2 Model
The conceptual model is represented in Figure 2.
Based on those processes, resource availability, and
the results from the input analysis, a simulation
model was developed using ARENA 10.
First, a small portion of the model was built, and
after its functionality was established, more areas
and complexity were added. Once the model was
complete, its functionality was verified. After
checking the model to insure it provided the
intended information, the model was validated. At
this stage, the amount of daily average patients
treated was compared to the historical data.
Meanwhile, other service indicators such as average
time spent at the different queues and total average
waiting time in the hospital were validated by the
hospital personnel working in those services.
Subsequently, it was concluded that the model is a
credible representation of the system.
4 RESULTS
One of the objectives of this study was to measure
the service level of the different medical services
offered to the outpatients. To do that, some
indicators, approved by the hospital management,
needed to be defined. One of these was the total
average patient wait time, which was 83.27 minutes
for patients with insurance and 77.84 minutes for the
patients without insurance. Even though this seems
like a short waiting period, it is only an average. The
maximum total waiting time for a patient reached
326.67 minutes or 5.4 hours. Other indicators were:
ModelingaPublicHospitalOutpatientClinicinPeruusingDiscreteSimulation
391
average waiting time, queue length, and utilization
rate at every stage of the process.
For admission, the average waiting time was not
as high as expected, and there is almost no
difference between the waiting time for patients with
insurance and patients without insurance, 28.80 and
28.75 minutes respectively; nonetheless, there is a
slight difference for the average maximum waiting
time 135 and 148 minutes respectively. However,
was a large difference between the number of
patients with insurance in queue (3.85) and the ones
without insurance (9.03), getting an average
maximum queue length of 27 and 55 patients
respectively. Even though the average is not that
high, the admission area gets very congested during
the first two hours of the day, reaching 40 patients in
queue on average (for patients without insurance).
This is because the receptionist starts attending
patients at point 120 in time (7 am), and then it
dramatically dropped to less than five (in less than
an hour), Figure 3. The admission’s utilization rate
was also analyzed. On average, the receptionist is
busy 57.11% of the time.
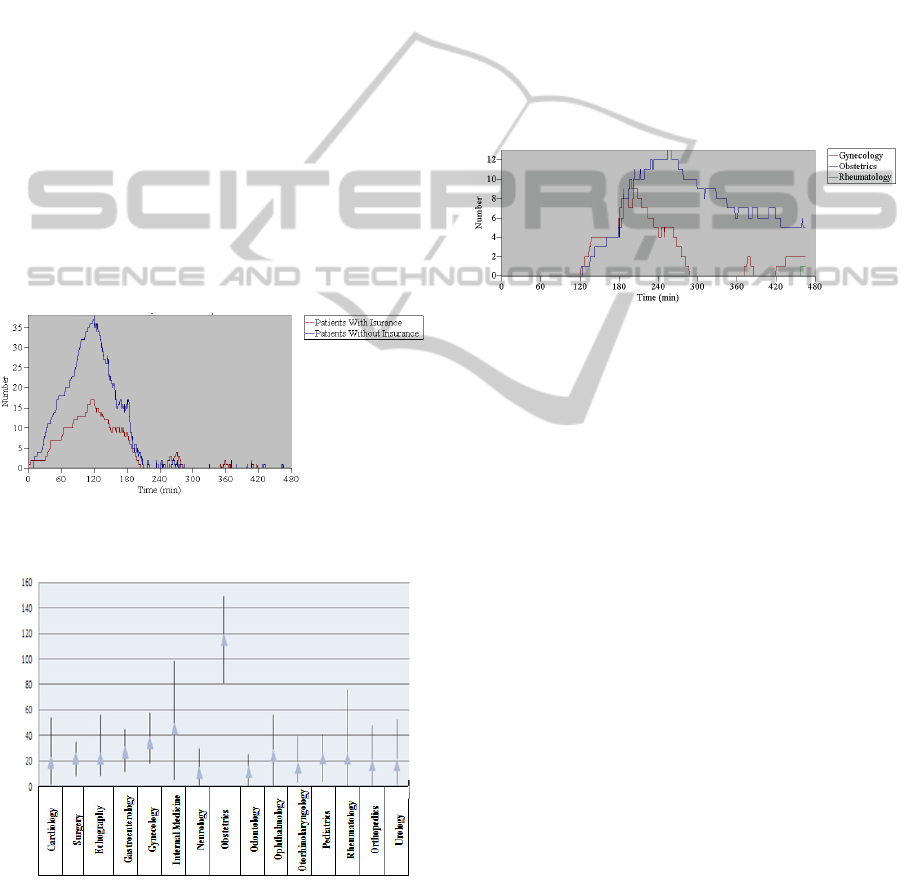
Figure 3: Number of Patients in queue at the admission for
patients without insurance and with insurance.
Figure 4: Queue waiting time for each specialty.
Each of the 15 specialties was analysed. As Figure 4
shows, Obstetrics was the specialty with the highest
average waiting time, more than 2 hours, reaching a
minimum average time of 1 hour 20 minutes, and a
maximum of 2 hours 28 minutes.
The average patient waiting time for the Internal
Medicine specialty is not so great, about 40 minutes,
but it has the highest range (maximum value –
minimum value) which is approximately 100
minutes. For the rest of the specialties, the average
waiting time is between 20 and 40 minutes.
Another indicator analyzed was the average number
of patients in a queue. The results show that on
average, a normal day, Gynecology has up to 10
patients in its queue and after approximately three
hours this number plummets to 0. Obstetrics quickly
reaches up to 13 patients in its queue, then it drops
to 6 patients, then this number stays steady, Figure
5.
Figure 5: Number of patients in queue for Obstetrics, and
Gynecology.
Analysis of the utilization percentage indicates
that Obstetrics has a high utilization rate (on average
it is 100%). Gynecology and Internal medicine have
the second highest utilization rate, 72.90 and 73.68
on average respectively. Results show that the
insurance module is fully occupied for just 30
minutes during the day, when the average queue is
10 patients.
When it comes to the pharmacy, the average
utilization rate is 65.05, with an average queue
length of maximum 6 patients during the first 60
minutes, and an average length of between 1 and 2
patients after that.
In the laboratory, the average utilization rate at
reception is 47.60, while for the lab test is 32.82.
The length of the queue at reception is very high
during the first two hours, and then peaks at six
patients for short times. Apparently, there is no
problem with the patients waiting for lab test
procedures, given that the queue reaches a maximum
of only one patient.
Finally, x-ray service shows an average
utilization rate of 54.85, receiving up to five patients
during the first two hours of service, and then it
dropped to zero or between one and three.
ICORES2015-InternationalConferenceonOperationsResearchandEnterpriseSystems
392

5 WHAT-IF SCENARIOS
Given the results, one obstetrician was added as a
resource in the model. The average patient length is
then reduced to six, instead to 13, and after an hour
it drops to three patients, and continues to decrease.
The rest of the indicators are shown in Table 3.
Table 3: Comparison between current and proposed
scenario.
Number of
obstetricians
Average
waiting time
in queue
(min.)
Average
length
queue
Utilization
rate
1 148.93 6.48 100%
2 41.66 1.09 69.35%
Another possible scenario analyzed was adding a
receptionist for patients without insurance. The
results are show in Table 4.
Table 4: Comparison between current and proposed
scenario at admission.
Receptionists
for patients
w/o
insurance
(admission)
Average
queue
waiting
time (min.)
Average
queue
length
Utilization
rate
1 28.75 9.03 57.11%
2 20.17 3.14 29.03%
Results of the current situation show that the lab
reception is a bottleneck; long queues are formed
when the hospital opens for service. By adding
another lab receptionist, the bottleneck is move
downstream to the subsequent process, lab test. By
adding a second receptionist, the average waiting
time is not reduced much.
6 CONCLUSIONS AND
DISCUSSION
Discrete simulation is a tool for analyzing complex
systems where there is a number of random
variables involved. It can provide understanding of
the system, and hence allows improved decision
making. This tool is perfectly applicable to the
health sector and as the study demonstrates the use
of this tool at a public hospital in Peru, can be used
to improve patient services.
In this study, a simulation model of a public
hospital´s outpatient clinic was presented. The
simulation results were compared with the observed
results at the outpatient clinic with minimal
differences, which validates the model used for the
study. The results give a better understanding of the
current process at the clinic. The first stage of the
study can be used by hospital management to
identify objectives for the service level indicators
(utilization rate, queue length, waiting time). Results
show that the most critical medical specialties are
Obstetrics, Internal medicine, and Gynecology,
which are the most utilized and have the longest
patient queues. There is a need for increasing
resources in these areas, especially at Obstetrics due
to a high utilization rate, 100.
The model also helped identify high idle time at
the insurance module and a low utilization rate in
pharmacy, lab, x-ray and admission areas.
Therefore, it seems adequate to integrate the
insurance module tasks with the admission and the
other services.
Some what-if scenario analyses were performed.
Such analyses permit a quantification of the impact
from implementing possible solutions. By adding a
second obstetrician, the service level improves
drastically: the average waiting time for a patient
can be reduced by 72% (from an average of 148.93
to 41.66 minutes in the que). It also shows that
adding more staff at admission or reception lab does
not improve the service level at the clinic. More
analysis to try different resource allocation and
system configuration will be done in subsequently
studies. It is also proposed to study hospital
management.
Finally, it can be said that the model used in this
study can be used for continuous improvement at the
hospital and given the fact that the outpatient
process is similar to any public hospital in Peru, the
model with slight modifications can be used at other
medical facilities.
REFERENCES
Abo-hamad W., Arisha A., 2013. Simulation-based
framework to improve patient experience in an
emergency department. European Journal of
Operations Research. Vol. 224. Pp 154-166.
Al-Araidah O., Boran A., Wahsheh A., 2012. Reducing
Health Care Delivery at Outpatients Clinics using
Discrete Event Simulation. International Journal
Simulation Model 11, vol.4 pp175-185.
Alcalde-Rabanal JE., Lazo-González O., Nigenda G.,
2011. Sistema de salud en el Perú. Salud Publica de
Mexico. Vol. 53, num. 2, pp. s243-s254.
Brenner S., Zeng Z., Liu Y., Wang J., Li J., Howard P.,
2010. Modeling and Analysis of the Emergency
ModelingaPublicHospitalOutpatientClinicinPeruusingDiscreteSimulation
393

Department at University of Kentucky Chandler
Hospital Using Simulations. Journal of emergency
nursing. Vol 36, issue 4, pp 303-310.
Cabrera E., Taboada M., Iglesias M., Epelde F., Luque E.,
2012. Simulation Optimization for Healthcare
Emergency Departements. Proceedings of the
International Conference on Computational Science,
ICCS 2012. Vol 9, pp 1464-1473.
Central Intelligence Agency. The World Factbook.
Retrieved from https://www.cia.gov/library/
publications/the-world-factbook/fields/2226.html#179.
Dirección General Parlamentaria, 2010. Carpeta
Georeferencial. Retrieved from http://
www.congreso.gob.pe/adlp/georeferencial/2013/1trim
estre/20.PIURA.pdf.
Holm L., Luras H., Dahl F., 2012. Improving hospital bed
utilisation through simulation and optimization with
application to a 40% increase in patient volume in a
Norwegian general hospital. International Journal of
Medical Informatics. Vol. 82, issue 2, pp 80-89.
Hoot N., LeBlanc L., Jones I., Levin S., Zhou C., Gadd C.,
2008. Forecasting Emergnecy Department Crowding:
A Discrete Event Simulation. Annals of Emergency
Medicine. Vol. 52, issue 2, pp. 116-125.
Instituto Nacional de Estadística e Informática, INEI,
2012. SERIES NACIONALES. Retrieved from
http://series.inei.gob.pe:8080/sirtod-series/
Jahn B., Theurl E., Siebert U., Pfeiffer K., 2010. Tutorial
in Medical Decision Modeling Incorporating Waiting
Lines and Queues Using Discrete Event Simulation.
Value in Health. Vol. 13. Num 4. Pp 501-506.
Jamon P., Lin L., 2012. Models for improving patient
throughput and waiting at hospital emergency
departments. Journal of Emergency Medicine. Vol. 43,
issue 6, Pp-1119-11268.
Kelton W., Sadowski R., Zupick N., 2009. Simulation with
Arena, McGraw-Hill. New York, 5
th
edition.
Law AM., Kelton D., 2007. Simulation modeling and
analysis, McGraw-Hill. New York, 4
th
edition.
Ministerio de la Salud, MINSA. Observatorio de Calidad
en la Salud Reports. Retrieved from http://
www.minsa.gob.pe/dgsp, 11/8/2013 (date accessed).
Troy P., Rosenberg L., 2009. Using simulation to
determine the need for ICU beds for surgery patients.
Surgery. Vol 146, num 4, pp608-620.
Villamizar JR., Coelli FC., Pereira W., Almeida R., 2011.
Discrete-event computer simulation methods in the
optimisation of a physiotherapy clinic. Physiotherapy.
Vol 97. Pp. 71-77.
Werker G., Sauré A., French J., Shechter S., 2009. The use
of discrete-event simulation modeling to improve
radiation therapy planning process. Radiotherapy and
Oncology vol 92, pp 76-82.
Zeng Z., Ma X., Hu Y., Li J., Bryant D., 2012. A
simulation study to improve quality of care in the
emergency department of a community hospital. The
Journal of nursing. Vol. 38, issue 4, pp 322-328.
ICORES2015-InternationalConferenceonOperationsResearchandEnterpriseSystems
394
