
A Comprehensive Approach for Evaluation of Stereo Correspondence
Solutions in Augmented Reality
Bahar Pourazar and Oscar Meruvia-Pastor
Computer Science Department, Memorial University of Newfoundland, St. John’s, Canada
Keywords:
Augmented Reality, Human Visual System, Binocular Stereo, Stereoacuity, Disparity, Stereo Correspondence.
Abstract:
This paper suggests a comprehensive approach for the evaluation of stereo correspondence techniques based
on the specific requirements of outdoor augmented reality systems. To this end, we present an evaluation
model that integrates existing metrics of stereo correspondence algorithms with additional metrics that con-
sider human factors that are relevant in the context of outdoor augmented reality systems. Our model pro-
vides modified metrics of stereoacuity, average outliers, disparity error, and processing time. These metrics
have been modified to provide more relevant information with respect to the target application. We evaluate
our model using two stereo correspondence methods: the OpenCV implementation of the semi-global block
matching, also known as SGBM, which is a modified version of the semi-global matching by Hirschmuller;
and our implementation of the solution by Mei et al., known as ADCensus. To test these methods, we use a
sample of fifty-two image pairs selected from the Kitti stereo dataset, which depicts many situations typical of
outdoor scenery. Experimental results show that our proposed model can provide a more detailed evaluation
of both algorithms. Further, we discuss areas of improvement and suggest directions for future research.
1 INTRODUCTION
Many Augmented Reality (AR) systems require some
form of optical markers placed within a scene in order
to integrate computer-generated objects with scenery
directly generated from the real world; these markers
help the system identify the location of an item within
the scene to be used as a place-holder for the synthetic
objects. Placing such markers in objects that are part
of a scene may work for many indoor environments,
but is a less practical option in outdoor AR settings
where users can move freely in their surroundings. In
the absence of such markers, an AR system requires a
depth map of the surrounding environment. In order
to obtain the 3D location of different objects in the
scene, several technologies can be used. Among these
technologies, one of the most practical techniques is
the use of stereo cameras to take images of the scene
from slightly different viewpoints. These images can
then be processed by the stereo correspondence algo-
rithms, which attempt to find the corresponding pixels
in the stereo images, to generate the depth map of the
surrounding environment. This map is then used to in-
tegrate virtual objects in the scene such that synthetic
objects are rendered in a way that considers the oc-
clusion properties and the depth of the real objects in
the scene. Due to the potential applications of stereo
correspondence, which is one of the most extensively
studied subjects in computer vision (Scharstein and
Szeliski, 2002), using an evaluation scheme that is de-
signed according to the specific requirements of the
target application is essential. The evaluation scheme
proposed in this paper is designed for outdoor AR ap-
plications which make use of stereo vision techniques
to obtain a depth map of the surrounding environment.
Over the past few years, a few evaluation schemes
have been proposed by researchers in the field
to provide a testbed for assessment of the solu-
tions based on specific criteria. The Middlebury
Stereo (Daniel Scharstein, 2012) and the Kitti Stereo
benchmarks (Andreas Geiger, 2012) are two of the
most popular and widely used evaluation systems
through which a stereo correspondence algorithm can
be evaluated and compared to others. However, both
of these models take a general approach towards eval-
uating the methods; that is, they have not been de-
signed with an eye to any particular target applica-
tion. In fact, these models focus on the particular ap-
plication of a stereo correspondence algorithm as a
solution per se to find the best matches of the corre-
sponding pixels in stereo pairs, regardless of the target
application. However, the information provided by
these evaluation benchmarks is not sufficient to select
5
Pourazar B. and Meruvia-Pastor O..
A Comprehensive Approach for Evaluation of Stereo Correspondence Solutions in Augmented Reality.
DOI: 10.5220/0005272500050013
In Proceedings of the 10th International Conference on Computer Vision Theory and Applications (VISAPP-2015), pages 5-13
ISBN: 978-989-758-091-8
Copyright
c
2015 SCITEPRESS (Science and Technology Publications, Lda.)
a given algorithm suitable for AR, because we need
information on the specific accuracy and efficiency
of these algorithms, for example to assess their suit-
ability regarding their processing time. The fact that
some of this information is missing from such stan-
dard evaluations of stereo correspondence methods
has compelled us to take steps towards a comprehen-
sive evaluation design based on specific requirements
of outdoor stereo AR applications, which results in
better definition and adjustment of the criteria for ef-
ficiency and accuracy metrics used for the evaluation.
2 BACKGROUND AND
TERMINOLOGY
Over the past decades, many mobile AR systems have
been built, from the Touring Machine in 1997 (Feiner
et al., 1997) to Google Glass which was announced
in 2013 (Google Inc., 2013); however, most of these
prototypes have remained experimental due to certain
difficulties and constraints of using them in practical
applications (Drascic and Milgram, 1996; Livingston,
2005). Two of the most important constraints are the
human factors in AR and the high demand of com-
putational resources needed to provide a real-time in-
teraction between the user and the system; therefore,
in order to build a practical AR system, these factors
need to be carefully considered while designing dif-
ferent components of the system.
2.1 Binocular Vision and the Human
Visual System
Studies in binocular vision show that human percep-
tion of depth can vary depending on the environment
and under different circumstances. Many studies have
focused on the evaluation of human perception of
depth within different frameworks and in different
applications, such as virtual reality and AR, which
have recently attracted more attention (Wann et al.,
1995; Drascic and Milgram, 1996; Livingston, 2005;
Jerome and Witmer, 2005; Swan et al., 2007; Kruijff
et al., 2010). These studies show that the viewer per-
ception of depth is inversely proportional to his/her
distance from the object (Kruijff et al., 2010; Swan
et al., 2007; Jerome and Witmer, 2005; Livingston,
2005); for instance, in (Swan et al., 2007), some ex-
periments are designed to study and evaluate the hu-
man perception of distance, in terms of the absolute
depth of the objects from the observer, for an outdoor
AR application in urban settings. However, in this
research we are more interested in the human percep-
tion of relative depth in stereo vision: the ability to
perceive and distinguish the depth of different objects
relative to each other. In binocular vision, the mini-
mum depth difference between two points that can be
detected in the visual system is known as Stereoscopic
Acuity or Stereoacuity (Pfautz, 2000). This metric is
normally presented in angular units, commonly arc-
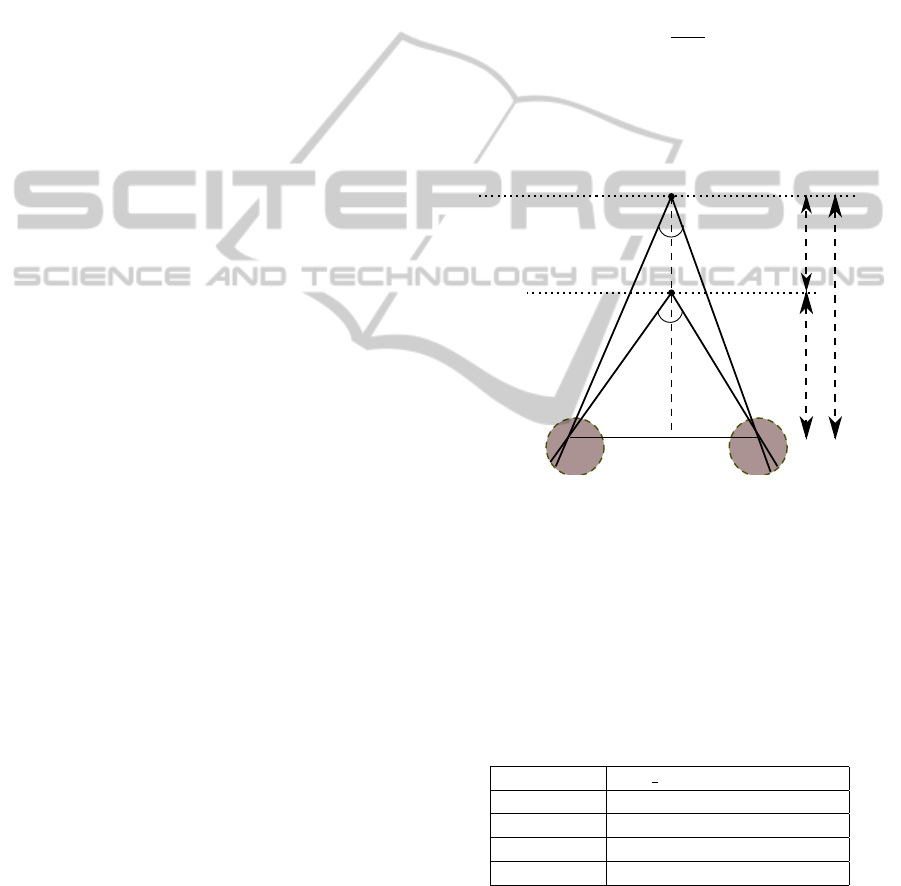
seconds. According to the geometry of binocular vi-
sion illustrated in Figure 1, stereoacuity can be ob-
tained from the following equation:
θ =
a∆Z
Z
2
(1)
This equation estimates the angular disparity in ra-
dians, where a is the distance between the center of
the pupils of the two eyes, which is known as inter-
pupillary distance.
a
Z
Z
F
α
β
ΔZ
F
F′
Figure 1: Binocular disparity.
According to standard stereo tests (Reading,
1983), the finest detectable disparity in the hu-
man visual system (HVS) is approximately 10-15
arcseconds. However, a more recent study on 60
subjects (Garnham and Sloper, 2006) at different age
groups, from 17 to 83 using standard stereotests,
shows that the average stereoacuity for different age
groups is as follows:
Table 1: Average stereoacuity for subjects ages 17 to 83.
Age Range Avg Stereoacuity(arcsecs)
17-29 32
30-49 33.75
50-69 38.75
70-83 112.5
As can be seen, the stereoacuity for the HVS in-
creases with age, that is the amount of error in the
depth results is less perceptible in the visual system of
the elders than the younger people. Using these values
in Equation 1 along with the average interpupillary
VISAPP2015-InternationalConferenceonComputerVisionTheoryandApplications
6

distance in the human visual system, that is approx-
imately 64mm (Howard and Rogers, 1995), we can
estimate the threshold for minimum detectable depth
between two objects based on their distance from the
observer.
2.2 Real-time Interaction
Providing real-time interaction in an AR system for
the user requires the processing time and update rate
of the whole system to keep up ideally with the stan-
dard video frame rate, between 24fps and 30fps, or
higher. However, studies show that in practice to build
a reasonable interactive augmented world the process-
ing rate should not be less than half of the video
frame rate (Hertzmann and Perlin, 2000). Two ways
to speed up a system are using a more advanced tech-
nology and hardware, and implementing more sophis-
ticated and efficient software design. However, hav-
ing access to advanced technology and hardware is
not always feasible and even the most advanced tech-
nologies have some limitation in their memory space
and computational capability which may not meet the
requirement for some real-time applications. There-
fore, in many cases, employing the second approach
is more practical.
3 COMPREHENSIVE
EVALUATION SCHEME
In our design, unlike the Middlebury or Kitti bench-
marks, we label a pixel in the disparity results as
an outlier if the angular measurement, that is the
stereoacuity, corresponding to the depth error be-
tween the ground truth and the estimated depth value
by the algorithm is more than the average perceptible
stereoacuity of the HVS as determined by standard
stereo tests (Reading, 1983; Garnham and Sloper,
2006). Moreover, we use the average stereoacuity for
different age groups (Garnham and Sloper, 2006) in
our design to evaluate the performance of the algo-
rithm for users at different ages; this makes the eval-
uation results more reliable and applicable to appli-
cations of AR. In order to evaluate the efficiency of
an algorithm and investigate whether it meets the re-
quirements for being part of a real-time AR applica-
tion, we integrate a module in the evaluation process
that reports on the average execution time of the algo-
rithm for the input data. The average outliers based on
the specified stereoacuity thresholds and the average
disparity error are also estimated during the evalua-
tion process.
In addition, our model employs a particular ap-
proach which can be of specific value to AR appli-
cations. In this approach, we suggest that it is im-
portant to focus the evaluation process on particular
regions of the disparity map rather than the whole
image. The main reason is that salient edges caused
by depth discontinuities, which also represent object
boundaries and occlusion, are important depth cues
for the human visual system to better perceive the
location of different objects in the 3D environment
(Szeliski, 2011). Therefore, more accurate depth re-
sults in these regions permits a higher quality com-
bination of the depth map of the real world with the
virtual depth of the synthetic objects that are part of
the AR scene. To this end, we build a mask using the
ground truth disparity map which is, in fact, a mask of
the edges in the image caused by depth discontinuities
and their surrounding area.
3.1 Architecture
The block diagram of our evaluation system can be
seen in Figure 2, which illustrates the sequence of
the operations during the whole process. As can be
seen in this figure, first the input data consisting of
the stereo images, the ground truth disparity, and the
calibration data are passed to the system. Afterwards,
the specified masks are created using a Canny edge
detector and a Dilation operation with the appropriate
parameters selected separately for each image. After
the corresponding disparity maps have been generated
by the stereo algorithm and stored on the disk, they
are passed to the evaluation module with the specified
arguments. Finally, the evaluation metrics are esti-
mated and output as data files and plots to facilitate
the evaluation of the stereo algorithm in the applica-
tion of interest.
3.2 Evaluation Metrics
The main evaluation component consists of different
modules which estimate specific evaluation metrics.
These metrics are: 1) the average stereoacuity, 2) the
average outliers, 3) the average disparity error, and 4)
the average execution time. Analysis of these metrics
in the framework of an outdoor AR application will
then allow for a practical evaluation of the stereo al-
gorithm performance.
3.2.1 Average Stereoacuity
We can break the estimation of the average stereoacu-
ity down to 3 steps: 1) estimate the stereoacuity based
on the generated disparity for each image pair and
AComprehensiveApproachforEvaluationofStereoCorrespondenceSolutionsinAugmentedReality
7

Input
Stereo
images
Ground truth
disparity
Calibration
data
Evaluation
Masks
Masking
(Dilation, Canny)
Stereo Correspondence
(stereo algorithm)
Disparity
maps
Avg_Outliers
Avg_StAc
Avg_DispErr
Avg_ExecTime
Comprehensive Evaluation System
Output
(evaluation metrics)
Figure 2: Architecture of the evaluation system.
the ground truth; 2) average the stereoacuity results
over certain depth ranges in each image; 3) average
the results from the previous step over all the images.
Corresponding plots are generated after the third step
based on the final results.
According to the specific age ranges, different val-
ues are reported for the average stereoacuity at the end
of the evaluation. In order to estimate this metric, the
depth values corresponding to both ground truth and
the generated disparity by the algorithm are first cal-
culated. Subsequently, the difference between these
values is used in Equation 1 to calculate the corre-
sponding stereoacuity, Equations 2 and 3. This pro-
cess is done for all the pixels in the image; or if a
mask has been provided, it will be applied only to the
pixels in the masked areas. Finally the results are out-
put and stored in a separate data file for each image.
Depth
err
=
depth
gt
− depth
gen
(2)
StAc =
a ∗ Depth
err
depth
2
gt
(3)
Here, depth
gt
, depth
gen
, StAc and a denote the
ground truth depth, the generated depth by the algo-
rithm, the corresponding stereoacuity, and the average
interpupillary distance, respectively.
After conducting the first step on all the disparity
maps corresponding to input image pairs, the second
step starts by building a histogram of the stereoacuity
values over specific depth ranges, Equations 5 and 6.
In our design, the width of each bin determines the
aforementioned depth range and is kept constant for
all the bins. Moreover, the number of bins along with
their corresponding width determine the total distance
over which the results are estimated and subsequently
examined.
Total distance = Number o f bins ∗Width (4)
For outdoor applications of AR, these parameters are
normally set to certain values so that the total distance
covers the medium to far depth fields; extending from
1.5 meters to more than 30 meters (Swan et al., 2007).
Sum
dRange
=
∑
dRange
StAc (5)
Avg StAc
dRange
=
Sum
dRange
(NumO f Pixs
dRange
)
(6)
Here, Avg StAc
dRange
and Sum
dRange
denote the
average and total stereoacuity over specified depth
ranges in each image, and NumO f Pixs
dRange
denote
the number of pixels within each depth range.
The results of the previous step, all stored in a data
file, are then passed to the last step. At this point, a
histogram is built over the data from all the dispar-
ity images, which results in the average stereoacuity
values within each specified depth range over all the
images, Equation 7. It should be noted that the num-
ber of bins and their corresponding width in this step
are similar to the histogram constructed in the the pre-
vious step.
Avg StAc =
∑
imgs
(Sum
dRange
)
∑
imgs
(NumO f Pixs
dRange
)
(7)
3.2.2 Average Outliers
For this measurement, the relative depth error is first
calculated by finding the corresponding depth values
for the ground truth disparity and the disparity gen-
erated by the algorithm and then converted to effec-
tive stereoacuity, as shown in Equations 2 and 3. This
value is then compared to the relative detectable depth
threshold for the HVS that is estimated using Equa-
tion 1. If the relative depth error is equal to or more
than the detectable threshold in the HVS, Equation 8,
then the corresponding pixel is labelled as an outlier.
StAc ≥ StAc
threshold
(8)
Since we are using four different thresholds of
stereoacuity corresponding to different age groups
VISAPP2015-InternationalConferenceonComputerVisionTheoryandApplications
8
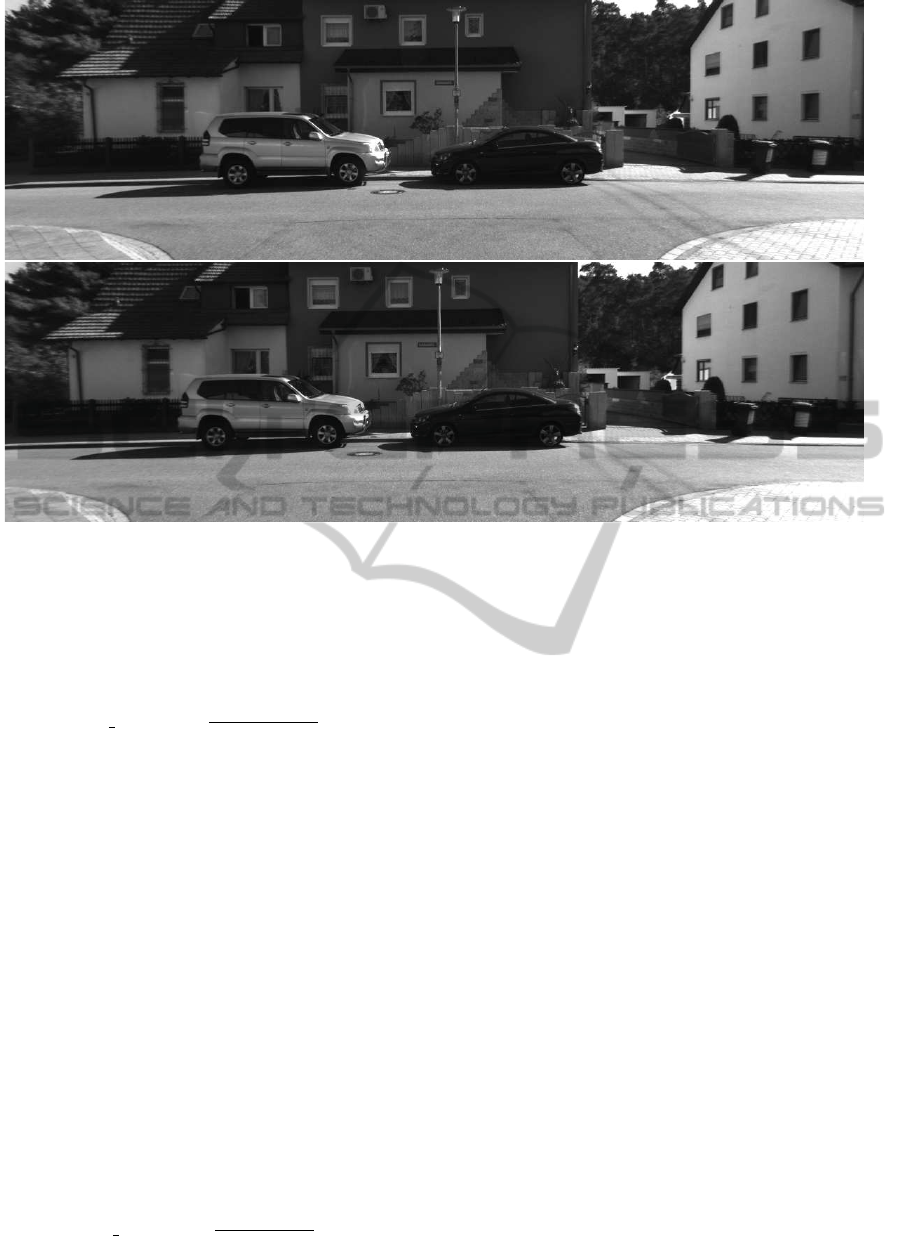
Figure 3: Sample outdoor scene from the Kitti stereo dataset (Andreas Geiger, 2012). Top: left image. Bottom: right image.
in our evaluation, the estimated error is compared
against each of these thresholds, and therefore, four
different values are eventually calculated. The aver-
age outliers is then computed as a fraction of the total
number of pixels in the inspected regions, Equation 9.
Avg Outliers =
Outliers
total
NumbO f Pixs
(9)
This process is repeated for all the pixels in the
image or merely the pixels in the masked regions de-
pending on the availability of a mask.
3.2.3 Average Disparity Error
This metric is the mean error between the ground truth
disparity and the one found by the algorithm, which
is estimated for all the pixels in the image or merely
the masked pixels depending on the availability of a
mask. It can be presented with the following estima-
tions:
Disp
err
=
disp
gt
− disp
gen
(10)
DispErr
total
=
∑
pixs
Disp
err
(11)
After the computation of the total disparity error
for the pixels, the average disparity error is estimated
as follows:
Avg DispErr =
DispErr
total
NumO f Pixs
(12)
The NumOfPixs is, in fact, the total number of pixels
in the whole image or the masked regions, depending
on the case for which the error is being estimated.
3.2.4 Average Execution Time
We use the C++ function clock() to estimate the av-
erage execution time of the algorithms for generating
disparity results corresponding to the input stereo im-
ages, fifty-two image pairs in our evaluation. We then
compare this value to the acceptable criteria for hav-
ing a real-time interactive AR system from the user’s
perspective, that is, a processing time less than 0.06-
0.08 seconds per frame corresponding to a frame rate
of 12.5 to 16.5 fps, as proposed by (Hertzmann and
Perlin, 2000).
Analyzing each of these metrics in the light of the
relevant factors in an outdoor AR application results
in a practical evaluation of the stereo correspondence
methods.
4 VALIDATION
In order to verify the effectiveness of our proposed
model for the evaluation of stereo correspondence
methods in outdoor AR applications, we have eval-
uated two sample stereo algorithms: the OpenCV im-
plementation of the semi-global block matching, also
AComprehensiveApproachforEvaluationofStereoCorrespondenceSolutionsinAugmentedReality
9

known as SGBM, which is a modified version of the
semi-global matching by Hirschmuller (Hirschmuller,
2008); and our implementation of “on building an ac-
curate stereo matching system on graphics hardware”
(Mei et al., 2011), also known as ADCensus. It should
be noted that the CPU implementation of both meth-
ods have been used.
Experiments were carried out on a Linux plat-
form with Intel Core(TM) i7 3.20GHz CPU. Fifty-
two image pairs were chosen from the Kitti Stereo
Dataset corresponding to real outdoor scenes. Figure
3 shows a sample stereo pair from the Kitti dataset.
The OpenCV Canny edge detector and Dilation oper-
ation were used for building the specified masks and
the expansion of the masked areas, respectively. Pa-
rameters corresponding to stereo algorithms, the aper-
ture size in Canny, and the degree of Dilation were
kept constant over all the images and experiments.
These values are presented in Tables 2, 3, and 4. The
parameters for Dilation and Canny were chosen em-
pirically by running the algorithms over our image set
with the intention of selecting the values which best
define the depth edges and expand them enough to
include regions with different depths surrounding the
edges.
Table 2: SGBM Parameters.
SADWindowSize 9
disp12MaxDiff 2
uniquenessRatio 10
P2 3*9
speckleWindowSize 100
speckleRange 2
Table 3: ADCensus Parameters.
λ
AD
10 λ
Census
30 L
1
34 L
2
17
τ
1
20 τ
2
6 π
1
1.0 π
2
3.0
τ
SO
15 τ
S
20 τ
H
0.4
Table 4: Masking Parameters.
Dilation iterations 10
Canny apertureSize 3
The minimum and maximum disparity values are
also kept constant for each image pair in both algo-
rithms; however, the maximum disparity differ for
each image pair as the scenes are different and objects
are located at different depth fields. The minimum
disparity is set to 0 for both algorithms. The maxi-
mum disparity for each image pair is selected based
on the maximum value in their corresponding ground
truth disparity. The standard stereoacuities used for
the evaluation are based on the results mentioned in
Table 1.
4.1 Experimental Results
The evaluation metrics, mentioned in Section 3.2,
were estimated for SGBM and ADCensus in our eval-
uation system. The main results are described below.
4.1.1 Average Stereoacuity
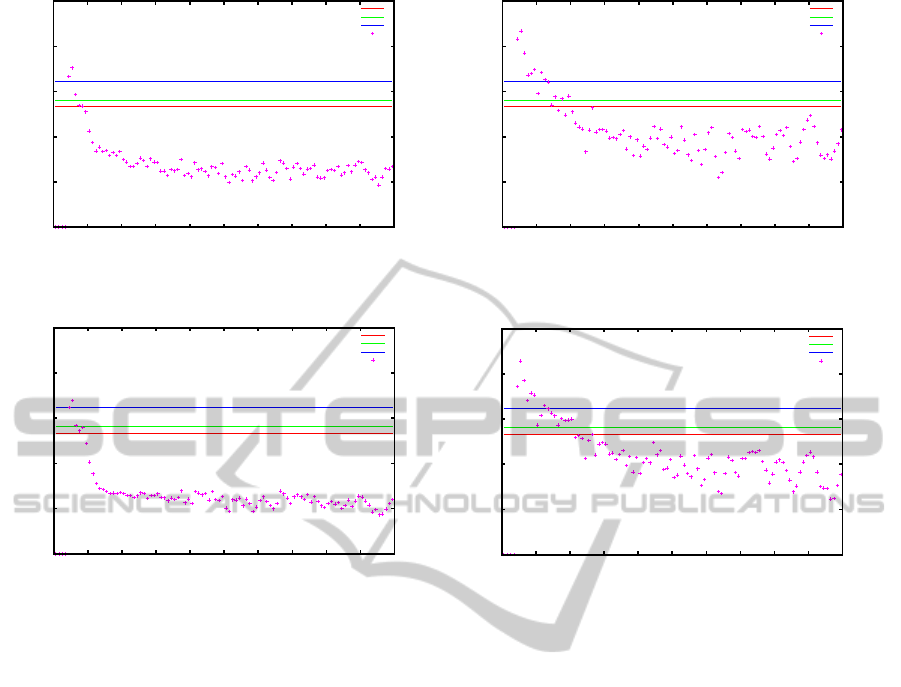
Figures 4 and 5 show the average relative depth error
converted to effective stereoacuity over distance for
the masked and the whole images with both SGBM
and ADCensus.
In these plots, a cross point below a stereoacu-
ity threshold (straight lines) implies that the average
error in the disparity values estimated by the stereo
algorithm is imperceptible to the human visual sys-
tem. However, a value higher than the threshold in-
dicates that the error cannot be ignored and should
be resolved to achieve a better alignment between the
virtual and the real world in the AR application of in-
terest. Moreover, as can be seen most of the errors fall
below the standard stereoacuity value corresponding
to older ages; indicating that these are not perceptible
to the visual system of people at these particular ages.
The zero values in the plots imply that either there is
no object within the corresponding range or the dis-
parity value estimated by the algorithm is equal to
the ground truth disparity; however, since the aver-
age of the results has been taken over all the images,
it is more likely that the zero values indicate no object
within the particular range.
As can be seen in the results, SGBM performs bet-
ter in finding more accurate corresponding matches
compared to ADCensus, as most of the error points
fall below the standard stereoacuity lines. Moreover,
the plots show that in both methods the significant
amount of error corresponds to the near field objects,
within the first 5 meters. This range of the depth
field can be considerably important in some applica-
tions, such as the ones involving certain manipulative
tasks; for these types of applications, other technolo-
gies, such as depth sensing cameras, are better choice.
Comparing the results between the masked and
the whole image show that the average error over the
masked regions; that is, near the depth edges, is very
similar to the results over the whole image. This may
imply that there is no additional benefit in the inspec-
tion of these regions. However, this might be merely
an indication of the performance of the selected algo-
rithms and can be better analyzed by evaluating more
algorithms within our model.
VISAPP2015-InternationalConferenceonComputerVisionTheoryandApplications
10
0
0.2
0.4
0.6
0.8
1
0 5 10 15 20 25 30 35 40 45 50
Stereoacuity(arcmin)
Distance(m)
Age: 30-49
Age: 50-69
Avg err
Age: 17-29
(a) Average relative depth error by SGBM
0
0.2
0.4
0.6
0.8
1
0 5 10 15 20 25 30 35 40 45 50
Stereoacuity(arcmin)
Distance(m)
Age: 30-49
Age: 50-69
Avg err
Age: 17-29
(b) Average relative depth error by ADCensus
Figure 4: Average relative depth error over distance for the masked image.
0
0.2
0.4
0.6
0.8
1
0 5 10 15 20 25 30 35 40 45 50
Stereoacuity(arcmin)
Distance(m)
Age: 30-49
Age: 50-69
Avg err
Age: 17-29
(a) Average relative depth error by SGBM
0
0.2
0.4
0.6
0.8
1
0 5 10 15 20 25 30 35 40 45 50
Stereo acuity(Arcmin)
Distance(m)
Age: 30-49
Age: 50-69
Avg err
Age: 17-29
(b) Average relative depth error by ADCensus
Figure 5: Average relative depth error over distance for the whole image.
4.1.2 Average Outliers
The average outliers for the masked and the whole
image are presented in Table 5. Results show that in
both cases, the masked regions and the whole image,
SGBM has less average outliers than ADCensus, indi-
cating that SGBM generates a more accurate disparity
map as perceived by the human visual system.
Another observation is that in SGBM, the average
outliers over the masked regions is larger than the
average outliers over the whole image, whereas in
ADCensus the opposite behavior is observed. This
implies that SGBM generates less accurate results
near the depth discontinuities and occluded regions
compared to the other areas in the image. On the
other hand, ADCensus generates more accurate
disparity values near the depth edges compared to the
other regions in the image and tends to preserve the
occluded regions. This only indicates that, despite
the better performance of SGBM over ADCensus
according to the experimental results, in cases
where only one of these solutions is available, it is
reasonable to consider this behavior to employ the
method in the right application based on the accuracy
requirement of the target system in different regions.
In other words, it is important to first investigate
which regions of the image are more important in
the context of the target application. For instance,
ADCensus performs better in an application where
the areas near depth discontinuities and occlusion are
more important than the rest of the image, such as
image compositing for layering visual elements on
the scene, compared to application scenarios where
obtaining an accurate, dense disparity map for all the
regions in an image is essential, such as constructing
a 3D model of the scene or preparing a model for
3D printing. Figure 6 shows a comparison of all the
results.
4.1.3 Average Disparity Error
The average disparity error for both the whole and
the masked image are presented in Table 6. As can
be seen, ADCensus results in less average disparity
error than SGBM. This difference is likely caused
by the various refinement steps implemented in the
ADCensus algorithm which do not exist in SGBM.
As a result, despite the larger outliers in ADCensus
than SGBM as presented in Section 4.1.2, ADCen-
sus attempts to decrease the difference between the
resulting disparity value and the ground truth dispar-
AComprehensiveApproachforEvaluationofStereoCorrespondenceSolutionsinAugmentedReality
11
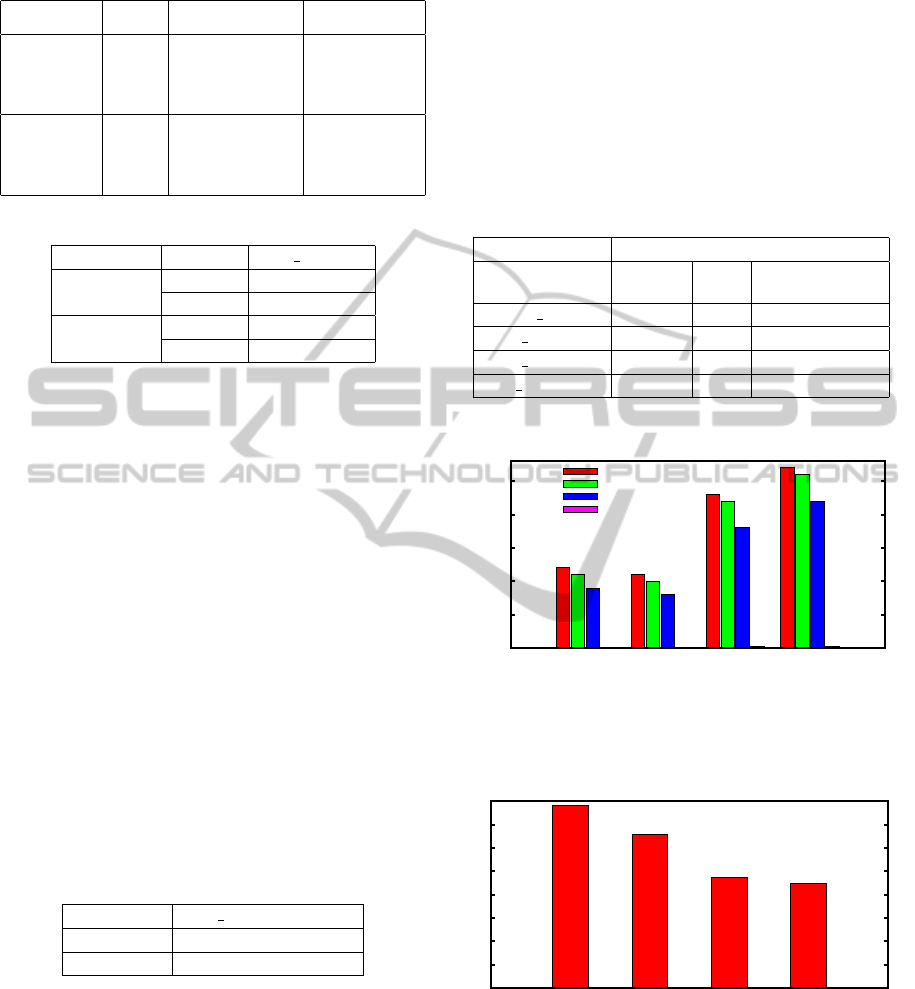
Table 5: Average outliers.
Algorithm Age
Average
Outliers(Masked)
Average
Outliers(Full)
SGBM
17-29 0.12 0.11
30-49 0.11 0.10
50-69 0.09 0.08
70-83 0.0012 0.005
ADCensus
17-29 0.23 0.27
30-49 0.22 0.26
50-69 0.18 0.22
70-83 0.002 0.002
Table 6: Average disparity error.
Algorithm Region Avg DispErr
SGBM
Full 6.58
Masked 7.81
ADCensus
Full 4.49
Masked 4.74
ity through multiple refinement steps, thus generating
smoother disparity patches within different regions of
the image. Figure 7 presents a comparison between
all the results.
4.1.4 Average Execution Time
In another experiment, we estimated the average exe-
cution time for both algorithms using a set of fifty-two
stereo image pairs from the Kitti data set (Andreas
Geiger, 2012). Results of the average execution time
over all the images are shown in Table 7. Consider-
ing the requirements of a real-time AR system (Hertz-
mann and Perlin, 2000), the processing time of each
frame should not be more than 0.06-0.08 seconds. Al-
though the current implementation of SGBM could be
used when the real world scene remains stable for ap-
proximately one second, it can be safely concluded
that none of these implementation meets the require-
ments of a real-time interactive AR system.
Table 7: Average execution time.
Algorithm Avg ExecTime(secs)
SGBM 0.54
ADCensus 272.82
4.2 Overview
Table 8 shows an overview of the difference between
our proposed evaluation approach and the other
evaluation models, Middlebury and Kitti, in terms of
the estimated evaluation metrics.
It should be noted that although the average error
and the average outliers exist in the other evaluation
schemes as well, the major difference which makes
our evaluation more appropriate than the other
schemes for practical applications of AR, is the ap-
proach employed during the design of the metrics and
the analysis of the results in the evaluation process.
In fact, integrating the important factors related to
the human visual system and its perception of depth
in the design of the metrics and the insights they
provide make the evaluation model more relevant and
applicable to outdoor AR systems.
Table 8: Comparison of different evaluation schemes.
Metrics Evaluation Models
Middle-
bury
Kitti
Comprehensive
Evaluation
Avg StAc 7 7 3
Avg Outliers 3 3 3
Avg DispErr 3 3 3
Avg ExecTime 7 7 3
0
0.05
0.1
0.15
0.2
0.25
SGBM-Masked
SGBM-Full
ADCensus-Masked
ADCensus-Full
Average Outliers
17-29
30-49
50-69
70-83
Figure 6: Average outliers for both SGBM and ADCensus.
0
1
2
3
4
5
6
7
8
SGBM-Masked
SGBM-Full
ADCensus-Masked
ADCensus-Full
Average Disparity Error
Figure 7: Average disparity error for both SGBM and AD-
Census.
VISAPP2015-InternationalConferenceonComputerVisionTheoryandApplications
12

5 CONCLUSION
In this paper, we present a new approach for evaluat-
ing stereo algorithms in which we suggest that eval-
uation metrics should be designed or chosen based
on the specific requirements of the target applica-
tion. We then applied this concept to the particular
application of augmented reality systems in outdoor
environments. We chose outdoor environments be-
cause these environments pose additional challenges
to stereo vision algorithms and AR systems since they
must cope with external factors that cannot be eas-
ily controlled, such as the effects of shadows, illumi-
nation and weather. As a result, a practical analysis
on the performance of the stereo algorithms, in terms
of accuracy and processing time as perceived by the
HVS, was presented. The results over the masked re-
gions did not show any significant benefit to the eval-
uation of the areas near the depth discontinuities and
occluded regions; however, as mentioned previously,
this might be merely an indication of the performance
of the algorithms we selected for evaluation and can
only be better analyzed by evaluating more algorithms
within our model. In either case, we hypothesize that,
due to the importance of occlusion and areas near
depth discontinuities to the HVS for the perception
of depth in AR applications, it might be reasonable
to focus more on the regions that contain depth edges
and their surroundings when designing or employing
a stereo matching technique for an AR application.
Validation of this hypothesis is a topic we would like
to further investigate in the future research. More-
over, we would like to assess the benefits of our model
for other AR applications, such as underwater envi-
ronments, and explore other factors which may also
affect the evaluation process, such as the resolution
of the display device, and the effect of contrast and
brightness.
ACKNOWLEDGEMENTS
The authors would like to thank the Research and De-
velopment Corporation (RDC) of Newfoundland and
Labrador, which provided the funding for the project,
and also Dr. Paul Gilliard, for his advice and support
for this project.
REFERENCES
Andreas Geiger (2012). KITTI Vision.http://www.cv
libs.net/datasets/kitti/.
Daniel Scharstein (2012). MiddleBury Evaluation.http:// vi-
sion.middlebury.edu/stereo/eval/.
Drascic, D. and Milgram, P. (1996). Perceptual issues in
augmented reality. In Electronic Imaging: Science &
Technology, pages 123–134. International Society for
Optics and Photonics.
Feiner, S., MacIntyre, B., H
¨
ollerer, T., and Webster, A.
(1997). A touring machine: Prototyping 3d mobile
augmented reality systems for exploring the urban en-
vironment. Personal Technologies, 1(4):208–217.
Garnham, L. and Sloper, J. (2006). Effect of age on
adult stereoacuity as measured by different types
of stereotest. British journal of ophthalmology,
90(1):91–95.
Google Inc. (2013). Google AR Glasses. http://www.
google.com/glass/start/.
Hertzmann, A. and Perlin, K. (2000). Painterly rendering
for video and interaction. In Proceedings of the 1st
International Symposium on Non-photorealistic Ani-
mation and Rendering, NPAR ’00, pages 7–12, New
York, NY, USA. ACM.
Hirschmuller, H. (2008). Stereo processing by semiglobal
matching and mutual information. Pattern Analy-
sis and Machine Intelligence, IEEE Transactions on,
30(2):328–341.
Howard, I. P. and Rogers, B. J. (1995). Binocular vision
and stereopsis. Oxford University Press.
Jerome, C. and Witmer, B. (2005). The perception and es-
timation of egocentric distance in real and augmented
reality environments. In Proceedings of the Human
Factors and Ergonomics Society Annual Meeting, vol-
ume 49, pages 2249–2252. SAGE Publications.
Kruijff, E., Swan, J., and Feiner, S. (2010). Perceptual is-
sues in augmented reality revisited. In Mixed and Aug-
mented Reality (ISMAR), 2010 9th IEEE International
Symposium on, pages 3–12. IEEE.
Livingston, M. A. (2005). Evaluating human factors in aug-
mented reality systems. Computer Graphics and Ap-
plications, IEEE, 25(6):6–9.
Mei, X., Sun, X., Zhou, M., Jiao, S., Wang, H., and Zhang,
X. (2011). On building an accurate stereo matching
system on graphics hardware. In Computer Vision
Workshops (ICCV Workshops), 2011 IEEE Interna-
tional Conference on, pages 467–474. IEEE.
Pfautz, J. D. (2000). Depth perception in computer graph-
ics. PhD thesis, University of Cambridge.
Reading, R. (1983). Binocular vision: Foundations and ap-
plications. Butterworths.
Scharstein, D. and Szeliski, R. (2002). A taxonomy and
evaluation of dense two-frame stereo correspondence
algorithms. International journal of computer vision,
47(1-3):7–42.
Swan, J. E., Jones, A., Kolstad, E., Livingston, M. A., and
Smallman, H. S. (2007). Egocentric depth judgments
in optical, see-through augmented reality. Visualiza-
tion and Computer Graphics, IEEE Transactions on,
13(3):429–442.
Szeliski, R. (2011). Computer vision: algorithms and ap-
plications. Springer.
Wann, J. P., Rushton, S., and Mon-Williams, M. (1995).
Natural problems for stereoscopic depth perception in
virtual environments. Vision research, 35(19):2731–
2736.
AComprehensiveApproachforEvaluationofStereoCorrespondenceSolutionsinAugmentedReality
13
