
Detection and Recognition of Painted Road Surface Markings
Jack Greenhalgh and Majid Mirmehdi
Visual Information Laboratory, University of Bristol, Bristol, U.K.
Keywords:
Computer Vision, Machine Learning, Text Recognition, Intelligent Transportation Systems.
Abstract:
A method for the automatic detection and recognition of text and symbols painted on the road surface is
presented. Candidate regions are detected as maximally stable extremal regions (MSER) in a frame which
has been transformed into an inverse perspective mapping (IPM) image, showing the road surface with the
effects of perspective distortion removed. Detected candidates are then sorted into words and symbols, before
they are interpreted using separate recognition stages. Symbol-based road markings are recognised using
histogram of oriented gradient (HOG) features and support vector machines (SVM). Text-based road signs are
recognised using a third-party optical character recognition (OCR) package, after application of a perspective
correction stage. Matching of regions between frames, and temporal fusion of results is used to improve
performance. The proposed method is validated using a data-set of videos, and achieves F-measures of 0.85
for text characters and 0.91 for symbols.
1 INTRODUCTION
Painted text and symbols which appear on the surface
of roads in the UK come in three basic forms: text,
symbols, and lane division markers. Text provides
information to the driver, such as speed limits, warn-
ings, and directions. Symbol-based road markings are
displayed in the form of arrows and other ideograms.
We propose a method in this paper that detects and
recognises such painted text and symbols using a
camera mounted inside a car on the driver’s rear-view
mirror (looking out front). The possible applications
for this work are numerous, and include advanced
driver assistance systems (ADAS), autonomous vehi-
cles, and surveying of road markings. While informa-
tion such as the current speed limit or upcoming turn-
ings are also provided in the form of road signs, there
is much information, such as ‘road merging’ warnings
or lane specific directional information which may ap-
pear exclusively as road markings.
There are several key issues which make the de-
tection and recognition of painted road text and sym-
bols difficult. Road markings suffer badly from wear
and deterioration due to the fact that vehicles continu-
ously pass over them, and there is also a large amount
of variation between different instances of the same
symbol or character, as they are often hand-painted.
In addition, common issues such as shadowing, occlu-
sion, lighting variation also apply. Despite such dif-
ficulties, the problem is constrained in some aspects,
with a large amount of a priori knowledge which can
be exploited. Much of this a priori knowledge re-
lates to the visual appearance of the text characters
and symbols themselves. Symbol and text based road
markings appear elongated when viewed from above,
so as to improve their readability from the view-point
of a driver on the road. This offers a constraint on
the size and aspect ratio of candidate regions, when
detected in an image that has undergone inverse per-
spective mapping (IPM).
The text-based aspect of road marking recognition
is constrained in comparison with more generalised
text recognition (Clark and Mirmehdi, 2002; Merino-
Gracia et al., 2011). The total set of text characters is
very limited, consisting only of upper-case characters,
numbers, and a small number of punctuation marks.
Also, text-based road markings are based on a single
typeface, as shown in Figure 1(a). The total number
of symbol-based road markings is also fairly limited,
with only 15 different symbols appearing in the data-
set, as shown in Figure 1(b).
The first stage of the algorithm removes perspec-
tive distortion from the road surface by applying an
IPM, after the vanishing point has been detected.
Candidate text and symbols characters are then de-
tected as maximally stable extremal regions (MSER)
on the road surface. Road marking candidates are
sorted into potential text or symbols characters based
130
Greenhalgh J. and Mirmehdi M..
Detection and Recognition of Painted Road Surface Markings.
DOI: 10.5220/0005273501300138
In Proceedings of the International Conference on Pattern Recognition Applications and Methods (ICPRAM-2015), pages 130-138
ISBN: 978-989-758-076-5
Copyright
c
2015 SCITEPRESS (Science and Technology Publications, Lda.)
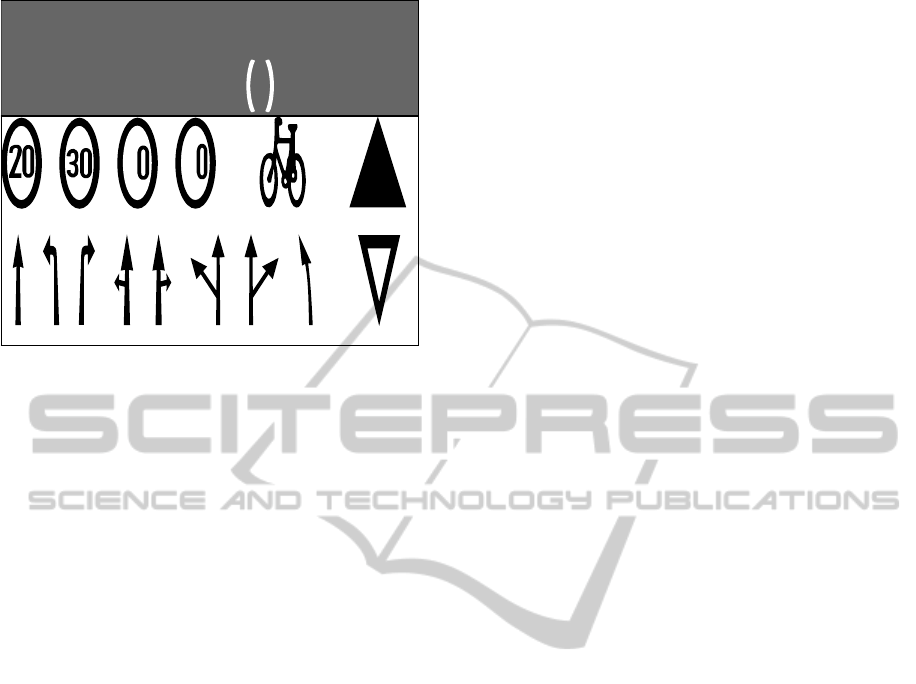
A B C D E F G H I J K L M N O P Q R S T U V W X Y Z
) ! " £ $ % ^ & * ( ,,.
'
'
&
5
4
Speed limits
Lane indication arrows
Cycle Lane
Speed bump
Give way
Figure 1: (top) Full character set for typeface on which text
road markings are based (bottom) full set of road marking
symbols which appear in the data-set.
on their relative size and proximity, so that they can be
classified using separate recognition stages. Symbol-
based markings are recognised using histogram of ori-
ented gradients (HOG) and linear support vector ma-
chines (SVM). Text words are recognised using an
open-source optical character recognition (OCR) en-
gine, Tesseract (Google, 2013), after a further correc-
tion transform has been applied. Recognised words
and symbols are matched across consecutive frames
so that recognition results can be improved via tempo-
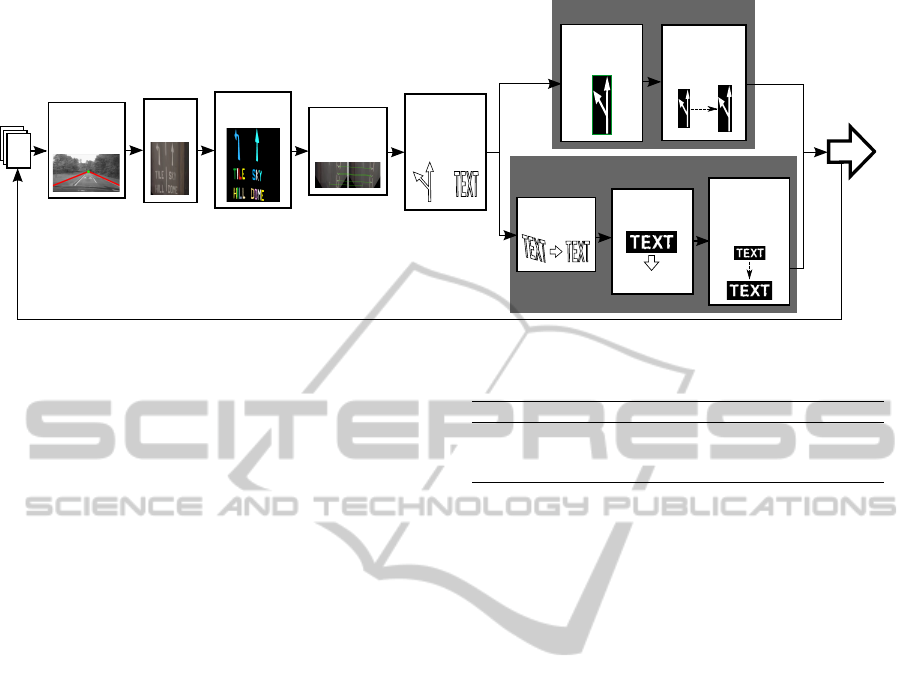
ral fusion. The total system pipeline for the algorithm
is shown in Figure 2.
In Section 2, an overview of related work is pro-
vided. Section 3 describes the stage for the detection
and sorting of candidate regions. Sections 4 and 5
focus on the recognition steps for text and symbols,
respectively. In Section 6, the temporal aspects of the
method are described. In Section 7, experimental re-
sults are presented. Finally, in Section 8, conclusions
are drawn.
2 RELATED WORK
Research on road marking detection can be broadly
divided into two categories, one of which focusses on
lane division markings, such as (Hanwell and Mirme-
hdi, 2009; Chen and Ellis, 2013; Bottazzi et al., 2013;
Zhang et al., 2013; Huang et al., 2013), and the other
on symbol or text based markings, such as(Rebut
et al., 2004; Vacek et al., 2007; Li et al., 2007; Khey-
rollahi and Breckon, 2010; Danescu and Nedevschi,
2010; Wu and Ranganathan, 2012), which provide se-
mantic information to the driver.
In cases where symbols painted on the road sur-
face are detected and recognised, the total number of
symbol types which are classified is generally very
limited, often focussing on just arrows or rectangu-
lar elements (Rebut et al., 2004; Vacek et al., 2007; Li
et al., 2007; Danescu and Nedevschi, 2010). For sym-
bol detection, several of these works employ an IPM
to remove perspective distortion of the road surface,
and hence the markings painted on it, such as(Rebut
et al., 2004; Li et al., 2007; Kheyrollahi and Breckon,
2010; Wu and Ranganathan, 2012). The only papers
that deal with the recognition of road surface text are
(Kheyrollahi and Breckon, 2010) and (Wu and Ran-
ganathan, 2012).
(Kheyrollahi and Breckon, 2010) present a
method for detecting and recognising both text and
symbols on the road surface. An IPM is applied
to each frame, after the image vanishing point (VP)
has been automatically detected. Regions of interest
(ROI) are then detected in the IPM image by applying
an adaptive threshold, and finding CCs in the resulting
binary image. After applying some post-processing to
the detected shapes, such as orientation normalisation
and rejection of complex shapes, the region is clas-
sified. The recognition stage involves the extraction
of a feature vector from each candidate CC, which
includes several shape based features. Each region
is then classified using a neural network trained us-
ing real road footage. An accumulator of symbols
is used to combine results over several frames, and
eliminate single frame false positives. The method is
limited to recognising only 7 symbols and 16 charac-
ters rather than the full alphabet, and is also limited to
recognising only 19 unique predefined words. The au-
thors report true positive rates of 85.2% and 80.7% for
recognition of arrows and text, respectively, with their
method taking 60-90 ms to process a single frame.
(Wu and Ranganathan, 2012) propose a method
for the detection and classification of text and sym-
bols painted on the road surface. ROIs are detected
in each frame as MSERs in an IPM transformed ver-
sion of the image. The FAST feature detector is then
used to extract points of interest (POI) from each ROI.
A feature vector is then found for each POI using
HOG, and the region is classified through compari-
son with a set of template images. Although Wu and
Ranganathan recognise both text and symbols using
template matching, entire words are treated as sin-
gle classes, and as a result only a small subset of
words are recognised. In this respect, their proposed
method does not provide ‘true’ text detection, as ar-
bitrary words (such as place names and their abbrevi-
ations) are not recognised. The authors report a true
positive rate of 90.1% and a false postive rate of 0.9%
for the combined recognition of arrows and text, at a
DetectionandRecognitionofPaintedRoadSurfaceMarkings
131
Detection of
vanishing
point
Input
image
Symbol recognition
Output
results
IPM of
image
Detection of
MSERs
Sorting of
regions into
words and
symbols
Correction of
distortion
OCR of
region
Matching with
words from
previous
frames
Classification
using
HOG/SVM
Matching with
symbols from
previous
frames
Text recognition
TEXT
/
Find motion
of road in
frame
Figure 2: Pipeline for the proposed painted road markings algorithm.
processing speed of at least 10 frames per second.
The method proposed in this paper improves upon
the current state-of-the-art in several ways. Firstly, the
proposed algorithm is able to recognise any arbitrary
text word which may appear, rather than the limited
set of predefined words recognised by the methods
presented by (Kheyrollahi and Breckon, 2010) and
(Wu and Ranganathan, 2012). This aspect is essen-
tial for use with an ADAS or autonomous vehicle,
given that important directional information may ap-
pear in the form of obscure place names, often with
abstract abbreviations, which may not appear in the
dictionary. For example, the place name ‘Warwick’
is sometimes abbreviated to ‘W’wick’. Secondly, the
range of road symbols recognised is expanded upon
compared to existing works which classify up to a
maximum of 6 symbols only, e.g. (Li et al., 2007;
Kheyrollahi and Breckon, 2010; Danescu and Nede-
vschi, 2010; Wu and Ranganathan, 2012). This is an
advantage of using a synthetically generated data-set,
which allows the system to be trained on any num-
ber of template images while retaining the robustness
provided by machine learning methods.
3 DETECTION AND SORTING OF
CANDIDATE REGIONS
The first stage of the proposed method detects and
sorts candidate regions for road markings. Connected
components respresenting text characters and sym-
bols are detected in an IPM version of the image, and
are then sorted into text and symbols based on their
attributes, and are passed on to the appropriate classi-
fication stage.
Table 1: Features for reduction of candidates.
Feature Min. value Max. value
Ratio of area of CC to area to RMAR 0.17 0.7
Aspect ratio of RMAR 0.09 0.68
Angle of RMAR -20
◦
20
◦
3.1 Detection of Candidate Regions
Candidate regions are first detected as MSERs in an
IPM transformed version of the input frame. Use of
IPM eliminates issues caused by perspective distor-
tion, as text and symbols maintain their shape and
scale in this transformed image, regardless of their
shape and scale in the original frame. Given that
road markings appear as high contrast homogeneous
regions on the road surface, MSER is considered to
be a suitable method for their detection, especially
following its successful application to the detection
of road signs in (Greenhalgh and Mirmehdi, 2012).
Only light-on-dark MSERs are used, given that road
markings are always painted in white paint on dark
backgrounds. Figure 3 shows an example frame, IPM
image, and detected MSERs, which are individually
coloured.
A rotated minimum area rectangle (RMAR) is fit-
ted to the CC of each candidate region, the features
of which are useful for reducing the total number of
candidates. As text and symbols painted on the road
are elongated, the angle of their RMAR is expected
to be close to 0
◦
, this also places a constraint on the
range of aspect ratios which will appear. The features
used for the elimination of false positives are shown
in Table 1, with all the values determined empirically
through analysis of template images.
ICPRAM2015-InternationalConferenceonPatternRecognitionApplicationsandMethods
132
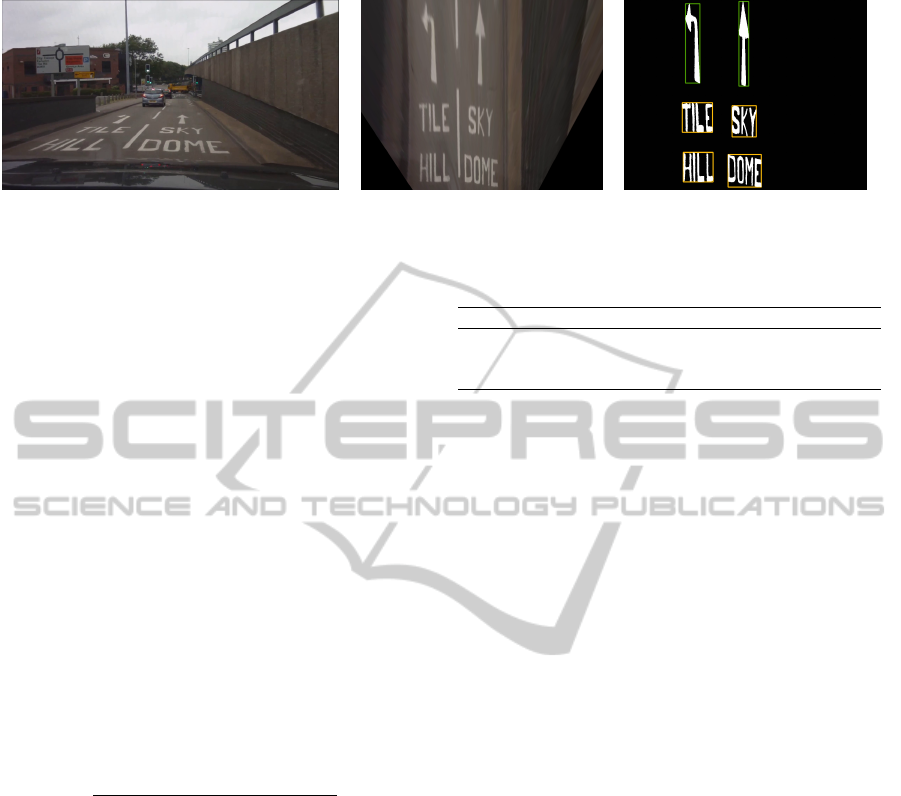
Figure 3: Stages of MSER detection on IPM image, showing original frame (left), IPM image (centre), and detected
MSERs,with detected words marked in orange and symbols in green (right).
3.2 Sorting of Candidates into Words
and Symbols
Once road marking candidates have been detected,
they can be divided into words and symbols. Text
characters contained within words appear in horizon-
tal lines and in close proximity to each other, whereas
symbol-based road markings appear in isolation with
a greater amount of space around them. Based on this
observation, it is possible to sort road marking candi-
dates into text characters and symbols.
First, each candidate region is compared to each
other on the basis of size and location. If two candi-
dates are found to be of a similar height, are approxi-
mately vertically aligned, and have a small horizontal
distance, they are grouped into a single word. To as-
sess the height similarity, a constraint is applied to the
ratio of the two heights. To determine whether two
characters are vertically aligned, an empirically de-
termined threshold is applied to an overlap measure,
ψ, which is calculated as follows:
ψ =
min{E
y2
, F
y2
} − max{E
y1
, F
y1
}
max{E
y2
, F
y2
} − min{E
y1
, F
y1
}
, (1)
where E and F represent the bounding boxes of the
two candidate regions. If there is no vertical overlap
between the regions, ψ will be equal to 0, and if the
regions perfectly overlap it will be equal to 1.
The distance between two characters from the
same word is expected to be less than approximately
one-third of the width of the widest character, which
was determined based on examples from the charac-
ter set shown in Figure 1(a). Any candidates grouped
together are considered to be text characters. The
requirements for the matching of text characters are
summarised in Table 2, where all of the described fea-
tures are invariant to scale.
After the character grouping process, any remain-
ing un-grouped candidate regions are considered to
be possible candidates for road symbols. Candidate
regions grouped into words are sent to the text recog-
nition stage of the algorithm, and the remaining char-
acters are classified by the symbol recognition stage.
Table 2: Scale invariant character grouping constraints.
Feature Min. Max.
Character height ratio 0.8 1.25
ψ 0.7 1.00
Horizontal character distance 0 (max. character width)*0.35
An example output for this stage of the algorithm
is shown in the right-hand image of Figure 3, where
candidate regions are shown in white, bounding boxes
for individual words are shown in orange, and bound-
ing boxes for symbols are shown in green.
4 RECOGNITION OF WORDS
Next, the proposed method attempts to recognise text
contained within candidate word regions. An affine
transform is applied to minimise the distortion caused
by uneven roads, before the region is interpreted using
OCR.
4.1 Correction of Perspective Distortion
of Words
The IPM stage of the algorithm works on the as-
sumption that the road surface is flat, however, in
reality road surfaces often exhibit a slight camber.
As a result, words appearing in the IPM road im-
age may sometimes suffer from rotation and shear-
ing, examples of which are shown in the top row of
Figure 4. This perspective distortion reduces the ac-
curacy achieved by the OCR engine, given that it is
designed for use with fronto-parallel text.
To avoid this distortion, a correction stage is ap-
plied to candidate words before recognition. First a
RMAR is fitted to all the connected components rep-
resenting the characters in the word. The angle of the
RMAR, ζ, is then used to correct the rotation of the
region, using the following transform:
x
0
y
0
=
cos(ζ) −sin(ζ)
sin(ζ) cos(ζ)
x
y
, (2)
DetectionandRecognitionofPaintedRoadSurfaceMarkings
133
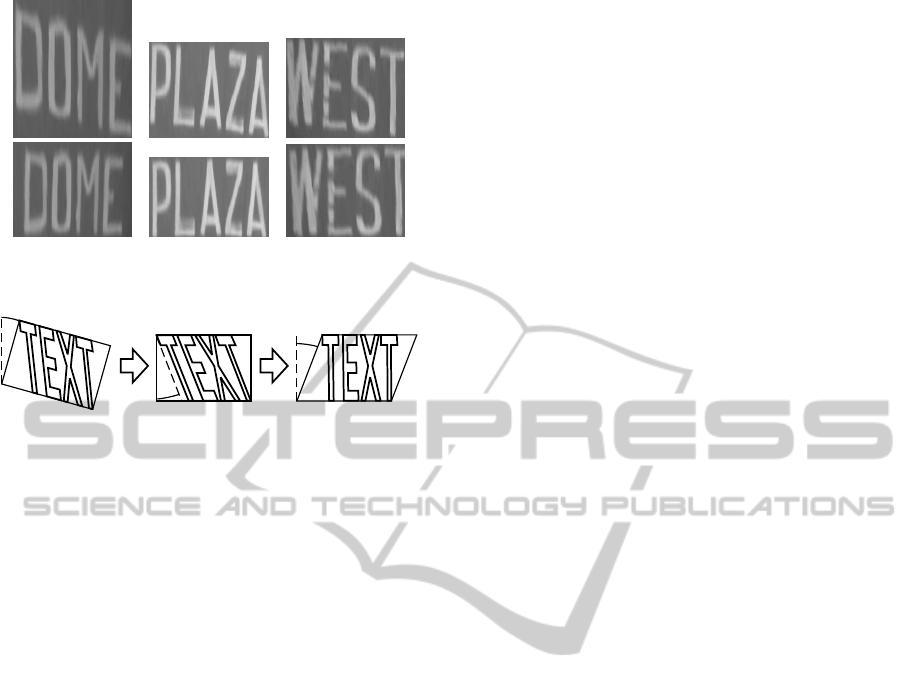
Figure 4: Examples of distorted words (top row) with cor-
rected versions (bottom row).
Rotation
De-shearing
ζ
β
β
Figure 5: Diagram illustrating stages of perspective distor-
tion correction.
where x and y are pixel coordinates in the original im-
age, and x
0
and y
0
are pixel coordinates in the rotated
image.
In order to fix the shear of the image, the most
common edge orientation is found, and used to cal-
culate the shear mapping. The Sobel filter is used to
find the horizontal and vertical derivatives of the im-
age, and from these the magnitude and orientation is
found at each pixel. A histogram of orientations is
then built, with each pixel weighted by its magnitude.
The histogram bin with the highest value is taken to
be perpendicular to the shear angle, β, and can be used
to calculate the transformation as follows:
x
0
y
0
=
1 tan(β)
0 1
x
y
. (3)
The stages of this process are shown in Figure 5. Ex-
amples of this transformation applied to several im-
ages are shown in Figure 4.
4.2 OCR of Region
Once the correction stage has been applied to the re-
gion, the pixel values are normalised and the textual
information is interpreted using the open source OCR
engine Tesseract (Google, 2013). The OCR engine
has been retrained based on a road marking typeface,
which contains only upper-case characters, numbers,
and punctuation marks (see Figure 1(a) for the full
character set). When OCR is applied, a value is re-
turned which represents the confidence of recogni-
tion, and if this value is below 50%, the entire region
is rejected.
5 RECOGNITION OF SYMBOLS
Once candidate regions have been detected and
sorted, the candidates previously selected as possi-
ble symbol road markings are classified by a recog-
nition stage. For the classification of symbol-based
markings an approach similar to the one described in
(Greenhalgh and Mirmehdi, 2012) for the recognition
of road signs is used, whereby regions are recognised
with HOG descriptors in combination with a classi-
fier. This feature descriptor is deemed to be suitable
for encoding the shape of road markings, given that
they display clearly defined edges at particular ori-
entations within the image. Each candidate region is
resized to 32 × 192, before a HOG descriptor is cal-
culated. This size is empirically determined to strike
a balance between accuracy and efficiency in compu-
tation expense. A synthetically generated data-set is
used to train the classifier. This data-set is created by
applying distortions to a set of template images, to
create images which closely resemble the road mark-
ings featured in the data-set. This approach eliminates
the necessity for a large training set of real images,
and allows the system to be trained on any number of
symbol classes.
5.1 Selection of Classifier
To select the most efficient classifier for use with
the HOG features a comparison between several was
made. Classifiers considered included SVM with a
linear kernel, SVM with a radial basis function (RBF)
kernel, MLP, and Random Forests. Each classifier
was trained on a synthetically generated data-set con-
sisting of 1000 examples per symbol class, and a neg-
ative class of 5000 examples. The classifiers were
then tested on a validation set of real images, the re-
sults of which are shown in Table 3. As can be seen
from the table, RBF SVM outperforms the other three
classification methods, but suffers from a larger, clas-
sification time. This is likely due to a combination of
the mapping process when applied to the data, given
its high dimensionality, and the fact that a multi-class
SVM classifier is made up of many one-against-one
binary classifiers. Although 7.41 ms is not a signifi-
cant amount of time for a single classification, recog-
nition must be performed on many candidate regions
in each frame, therefore making the RBF-kernel SVM
potentially unusable for this application. Linear SVM
produces the second highest accuracy of all classifiers
tested, and also retains a low classification time. Lin-
ear SVM is much faster than RBF SVM as the map-
ping process is removed. Random Forests and MLP
have a much lower classification time than RBF SVM,
ICPRAM2015-InternationalConferenceonPatternRecognitionApplicationsandMethods
134
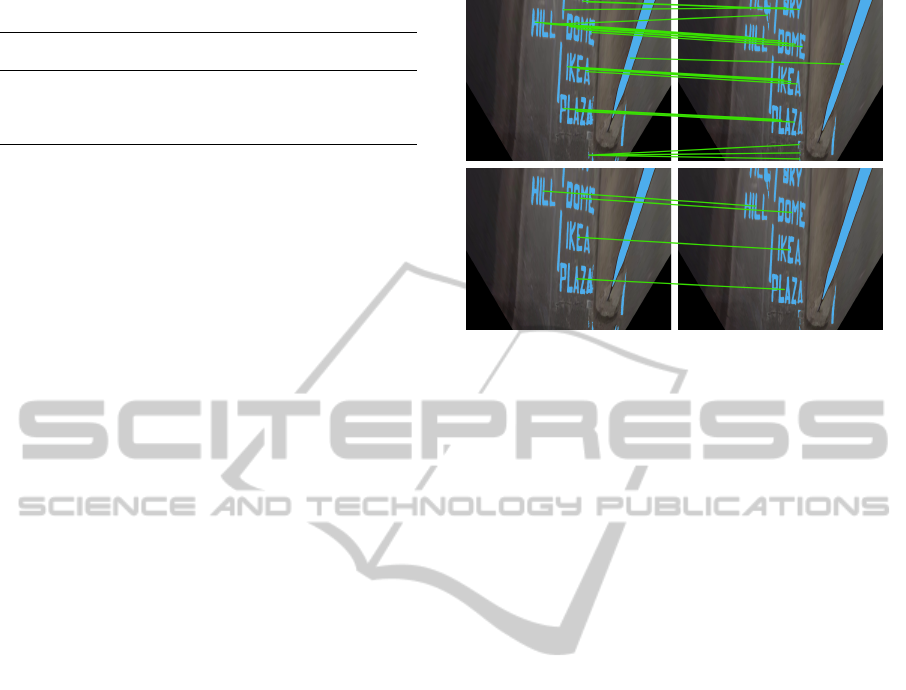
Table 3: Comparison of different classification methods.
Classifier Accuracy Average classification
Time (ms)
SVM (RBF kernel) 93.54% 7.41
SVM (linear kernel) 90.87% 0.36
Random Forest 75.58% 0.26
MLP 71.40% 0.81
but also suffer from a much lower accuracy. This is
largely due to their inability to separate the symbol
classes from the background/negative class. The clas-
sifier selected was the linear-kernel SVM, due to its
high accuracy and fast classification time.
Road markings exhibit a large amount of varia-
tion within classes, due to the fact that they are hand
painted, and are also subject to greater amounts of
deterioration. SVM is able to avoid the problem of
over-fitting through careful selection of training pa-
rameters. Therefore, for this particular problem SVM
proved to be the more suitable classifier.
6 TEMPORAL INFORMATION
Temporal information is exploited in order to improve
the accuracy of the method. Candidate word and sym-
bols from consecutive frames are matched and OCR
results from several frames are then fused together.
6.1 Calculation of Road Movement
To improve the temporal matching of candidate re-
gions, the motion of the road between consecutive
IPM frames is estimated. This movement can be
represented by a single 2-D motion vector, which is
found by matching MSERs between frames. Use of
this 2-D vector allows the current location of previ-
ously detected road markings to be estimated, there-
fore improving the accuracy of matching.
All detected MSERs (symbol, word, or otherwise)
from the previous frames are matched to those in the
current frame by finding their ‘nearest neighbours’
based on a descriptor vector consisting of a number
of simple features, including width, height, and loca-
tion. Each MSER in the current frame is compared
to each one in the previous frame, and matched to the
one with smallest Euclidean distance between feature
vectors. A 2-D motion vector for the frame is then cal-
culated by finding the mean of the distances between
the centroids of each pair of matched regions. MSERs
are well suited to image matching applications such as
this due to their high repeatability (Mikolajczyk et al.,
2005), and conveniently have already been detected
in the frame during the road-marking detection pro-
Figure 6: (Top row) Consecutive frames of IPM im-
age showing matched MSERs, (Bottom row) Consecutive
frames of IPM image showing matched words.
cess. The top row of Figure 6 shows two consecu-
tive frames with MSERs marked in blue and matches
shown with green lines.
6.2 Matching and Temporal Fusion of
Words and Symbols
The next stage of the algorithm finds matches between
words and symbols in the current frame and previ-
ous frame using the road movement vector. Although
matching is performed in the previous stage to find
the road movement vector, this process does not nec-
essarily match all MSERs correctly. This can be seen
in the top-row of Figure 6 where a text character has
been mismatched. Once the road movement vector
has been calculated more accurate matching can be
performed.
Each current symbol or word is compared to each
previously detected symbol or word by computing
the Euclidean distance between a set of features.
These features include the size and aspect ratio of the
RMAR, and the location of the corners of the RMAR
once they have been displaced by the calculated road
motion vector described above in Section 6.1. Each
candidate is matched to the previous region with the
smallest Euclidean distance between feature vectors.
If no match is found, the region is treated as a new
candidate. An example of this matching can be seen
in the bottom row of Figure 6 where each text word is
matched correctly.
For each series of matched words a histogram is
built containing all OCR results, weighted by con-
fidence. The histogram bin with the highest value
is taken as the correct result, given that it has been
recognised in at least 3 frames. Similarly, a histogram
is created for each series of matched symbols, with
DetectionandRecognitionofPaintedRoadSurfaceMarkings
135
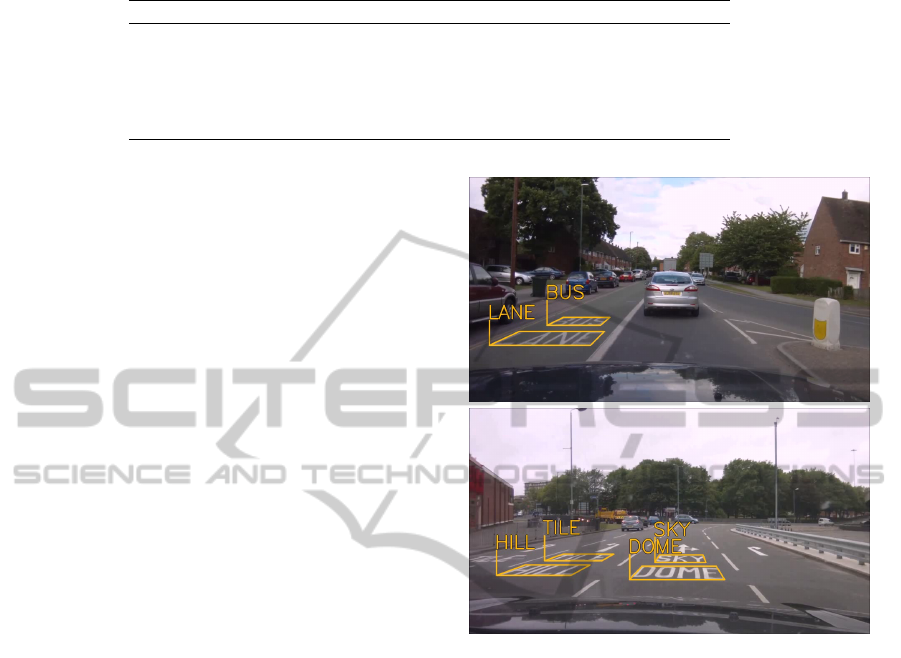
Table 4: Results for recognition of text characters.
Method Precision Recall F-Measure
OCR with no additional processing 0.66 0.79 0.72
OCR with perspective correction 0.66 0.81 0.73
OCR with temporal fusion only 0.79 0.83 0.81
OCR with perspective correction 0.86 0.87 0.85
and temporal fusion
each bin representing a class of symbol.
7 RESULTS
We validate both the symbol-based and text-based as-
pects of the proposed method via comparative anal-
ysis on a data-set, consisting of 42,110 frames at a
frame rate of 30 fps and a resolution of 1920 × 1088.
This test data was shot at a number of different vehicle
speeds, featuring different scene types which included
urban, suburban, and motorway scenes. The results
were obtained on a 3.33 GHz Intel Core i5 CPU un-
der OpenCV. The algorithm originally ran at an av-
erage rate of 3 fps on a single core. However, this
speed was increased to 7.25 fps exploiting the multi-
core capability of the processor and implementing the
method as a parallel pipeline.
7.1 Results for Text Detection and
Recognition
In order to validate the various stages of the text
recognition aspect of the system, recognition results
are provided showing the precision, recall, and F-
measure, for the detection and recognition of text
characters. We present results which compare stan-
dard OCR applied to detected regions, OCR with
the perspective correction method described in Sec-
tion 4.1, OCR with the temporal fusion method de-
scribed in Section 6, and OCR with both methods. In
this manner, the difference in performance which re-
sults from the addition of each of these enhancements
can be seen. These results are shown in Table 4.
The results demonstrate that the use of perspective
correction and temporal fusion provide a significant
improvement compared to the raw OCR approach. It
can be seen that the recall result for OCR with per-
spective correction and temporal fusion is higher than
precision, likely due to the variation seen in the text
characters to be recognised. While individual char-
acters are similar enough to be reliably detected, in-
traclass variation between characters is large, causing
misclassification, and hence, a lower precision. This
intraclass variation is due to the fact that the text char-
Figure 7: Examples of system output showing correctly de-
tected and recognised text.
acters are largely hand painted. Figure 7 contains ex-
ample output frames of the algorithm, showing road
text correctly detected and recognised.
7.2 Results for Symbol Detection and
Recognition
Our proposed algorithm is compared against an exist-
ing method proposed by (Kheyrollahi and Breckon,
2010) as well as a baseline method in order to val-
idate its performance for the recognition of symbols
on the road surface.
The method of (Kheyrollahi and Breckon, 2010)
was implemented and adapted to detect and recognise
symbols on UK roads. An artificial neural network
was trained with their proposed feature set, which
was extracted from the same synthetic data-set used
to train our method.
The baseline method classifies each region using
simple template matching. Each detected region is
resized to 32 × 192 before its pixels are normalised
between 0 and 255. The region is then compared to a
ICPRAM2015-InternationalConferenceonPatternRecognitionApplicationsandMethods
136
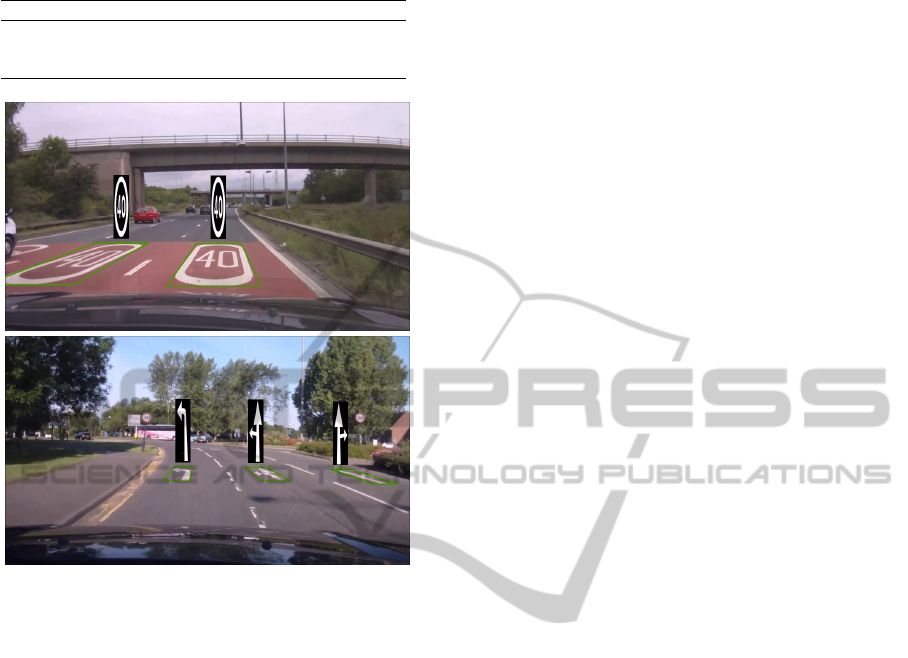
Table 5: Results for recognition of symbols.
Method Precision Recall F-Measure
Baseline method 0.58 0.65 0.61
KB2010 0.74 0.78 0.76
Proposed method 0.91 0.92 0.91
Figure 8: Examples of algorithm output showing correctly
detected and recognised symbols.
number of template images and the template with the
smallest difference is selected as the correct class.
From the results shown in Table 5 it can be seen
that the proposed method outperforms both the base-
line method and the method of (Kheyrollahi and
Breckon, 2010) (shown in the table as KB2010).
The adaptive threshold approach of (Kheyrollahi and
Breckon, 2010) was unable to detect some of the
fainter road markings, causing the recall to be re-
duced. The recognition stage which used an artifical
neural network with shape based features misclassi-
fied several non-road marking shapes as road sym-
bols, causing a reduction in precision. The baseline
method operates at 1.3 fps, KB2010 at 13.9 fps (aver-
age rate), and the proposed method at 7.3 fps.
The baseline method manages a particularly low
recall rate, in contrast to the ability of the proposed
symbol recognition method in eliminating false pos-
itives. Example frames demonstrating the output of
the symbol-based stage of the algorithm are shown in
Figure 8.
8 CONCLUSION
A method for the automatic detection and recogni-
tion of painted text and symbols on road surfaces is
proposed. Candidate regions are detected in an IPM
transformed image, which is then reduced and sorted
into words and symbols before being interpreted us-
ing separate recognition stages. Text words are recog-
nised using an open-source OCR engine, after a per-
spective correction stage. Symbols are classified us-
ing HOG features and SVM. Temporal fusion is used
to combine recognition results across several frames.
Results are provided showing precision, recall, and
F-measure for a challenging data-set of videos, for
which the system produces F-measures of 0.85 and
0.91 for text characters and symbols, respectively.
ACKNOWLEDGEMENTS
The first author was supported by the Engineering and
Physical Sciences Research Council, UK, and Jaguar
Land Rover Research Labs. The authors would like
to thank Dr. Thomas Popham of Jaguar Land Rover
Research for his support of this work.
REFERENCES
Bottazzi, V. S., Borges, P. V. K., and Jo, J. (2013). A vision-
based lane detection system combining appearance
segmentation and tracking of salient points. In 2013
IEEE Intelligent Vehicles Symposium, pages 443–448.
IEEE.
Chen, Z. and Ellis, T. (2013). Automatic lane detection
from vehicle motion trajectories. In 2013 10th IEEE
International Conference on Advanced Video and Sig-
nal Based Surveillance, pages 466–471. IEEE.
Clark, P. and Mirmehdi, M. (2002). Recognising text in real
scenes. International Journal on Document Analysis
and Recognition, 4(4):243–257.
Danescu, R. and Nedevschi, S. (2010). Detection and Clas-
sification of Painted Road Objects for Intersection As-
sistance Applications. In Proc. 13th International
IEEE Conference on Intelligent Transportation Sys-
tems, pages 433 – 438.
Google (2013). Tesseract-OCR. http://code.google.com/p/
tesseract-ocr/. [Online; accessed 8-October-2013].
Greenhalgh, J. and Mirmehdi, M. (2012). Traffic sign
recognition using MSER and random forests. In Eu-
ropean Signal Processing Conference, pages 1935–
1939.
Hanwell, D. and Mirmehdi, M. (2009). Detection of
lane departure on high-speed roads. In International
Conference on Pattern Recognition Applications and
Methods.
DetectionandRecognitionofPaintedRoadSurfaceMarkings
137

Huang, J., Liang, H., and Wang, Z. (2013). Robust lane
marking detection under different road conditions.
Robotics and Biomimetics (ROBIO), 2013 IEEE In-
ternational Conference on, 1(12):1753–1758.
Kheyrollahi, A. and Breckon, T. P. (2010). Automatic
real-time road marking recognition using a feature
driven approach. Machine Vision and Applications,
23(1):123–133.
Li, Y., He, K., and Jia, P. (2007). Road markers recognition
based on shape information. In Intelligent Vehicles
Symposium, 2007 IEEE, pages 117–122.
Merino-Gracia, C., Lenc, K., and Mirmehdi, M. (2011).
A head-mounted device for recognizing text in natu-
ral scenes. In Camera-Based Document Analysis and
Recognition.
Mikolajczyk, K., Tuytelaars, T., Schmid, C., Zisserman, a.,
Matas, J., Schaffalitzky, F., Kadir, T., and Gool, L. V.
(2005). A Comparison of Affine Region Detectors. In-
ternational Journal of Computer Vision, 65(1-2):43–
72.
Rebut, J., Bensrhair, A., and Toulminet, G. (2004). Image
segmentation and pattern recognition for road mark-
ing analysis. In 2004 IEEE International Symposium
on Industrial Electronics, pages 727–732 vol. 1. Ieee.
Vacek, S., Schimmel, C., and Dillmann, R. (2007). Road-
marking Analysis for Autonomous Vehicle Guidance.
EMCR, (1):1–6.
Wu, T. and Ranganathan, A. (2012). A practical system for
road marking detection and recognition. In 2012 IEEE
Intelligent Vehicles Symposium, pages 25–30. Ieee.
Zhang, F., St, H., Chen, C., Buckl, C., and Knoll, A. (2013).
A lane marking extraction approach based on Random
Finite Set Statistics. Intelligent Vehicles Symposium,
2013 IEEE, pages 1143–1148.
ICPRAM2015-InternationalConferenceonPatternRecognitionApplicationsandMethods
138
