
Categorize, Cluster & Classify
The 3C Strategy Applied to Alzheimer's Disease as a Case Study
Alexis Mitelpunkt
1
, Tal Galili
1
, Netta Shachar
1
, Mira Marcus-Kalish
2
and Yoav Benjamini
1,2
1
Department of Statistics and Operations Research, Tel Aviv University, Tel Aviv, Israel
2
The Sagol School for Neurosciences, Tel Aviv University, Tel Aviv, Israel
Keywords: Medical Informatics, Bioinformatics, Disease Profiling, Disease Signature, Categorization, Clustering,
Classification.
Abstract: Health informatics is facing many challenges these days, in analysing current medical data and especially
hospital data towards understanding disease mechanisms, predicting the course of a disease or assist in
targeting potential therapeutic options. Alongside the promises, many challenges emerge. Among the major
ones we identify: current diagnosis criteria that are too vague to capture disease manifestation; the
irrelevance of personalized medicine when only heterogeneous classes of patients are available, and how to
properly process big data to avoid false claims. We offer a 3C strategy that starts from the medical
knowledge, categorizing the available set of features into three types: the patients' assigned disease
diagnosis, clinical measurements and potential biological markers, proceeds to an unsupervised learning
process targeted to create new disease diagnosis classes, and finally, classifying the newly proposed
diagnosis classes utilizing the potential biological markers. In order to allow the evaluation and comparison
of different algorithmic components of the 3C strategy a simulation model was built and put to use. Our
strategy, developed as part of the medical informatics work package at the EU Human Brain flagship
Project strives to connect between potential biomarkers, and more homogeneous classes of disease
manifestation that are expressed by meaningful features. We demonstrate this strategy using data from the
Alzheimer's Disease Neuroimaging Initiative cohort (ADNI).
1 INTRODUCTION
Health informatics has the goal of discovering new
insights from the analysis of current available data.
These findings may help in understanding disease
mechanisms, predicting the course of a disease or
assist in targeting potential therapeutic options.
Upon analysing health data and especially hospital
data we face many challenges. Some of the major
challenges we identify in data mining of medical
data are:
1. Expert knowledge is valuable but current
diagnosis might be misleading. We believe that the
medical knowledge should not be ignored when
designing a data mining process. An important
example, referring to current Diagnosis Classes as
ground truth may be misleading: definitions change
over time due to new discoveries, new clinical and
research results, and new insights. Moreover,
diagnosis is usually a rough criteria, while the actual
clinical situation is more complex and sophisticated.
More generally, the understanding of measuring
tools and clinical processes is useful. Therefore we
would like to have a way to use the medical
knowledge and incorporate it into the data mining
process.
2. Compensatory mechanisms obscure the linkage
between biological markers (i.e. imaging, pathology,
genetics) and disease manifestation, making it more
difficult to discover. While always a problem in
medical research, in some fields of medicine you
could take a biological sample and the pathology
may in fact be the diagnosis. In Neurology and
Psychiatry finding the relation between a biological
marker and a disease manifestation is more complex
and difficult. Two people with the same brain
pathology, or brain images, do not necessarily share
the same clinical manifestation. It is not only the
complexity of the disease and inefficiency of the
marker, but the fact that the compensatory
mechanisms may differ from one person to the other.
3. Personalized solutions to heterogeneous
population. We seek ways to be able to tailor
treatment to each patient specifically. If we try to
566
Mitelpunkt A., Galili T., Shachar N., Marcus-Kalish M. and Benjamini Y..
Categorize, Cluster & Classify - The 3C Strategy Applied to Alzheimer’s Disease as a Case Study.
DOI: 10.5220/0005275705660573
In Proceedings of the International Conference on Health Informatics (HEALTHINF-2015), pages 566-573
ISBN: 978-989-758-068-0
Copyright
c
2015 SCITEPRESS (Science and Technology Publications, Lda.)

find relations between a marker to a large
heterogeneous population (e.g. all dementia patients)
we would decrease the chance to find a marker that
is relevant only to a part of that population because
of decreased signal to noise ratio. We would
increase our chances if we could find homogeneous
sub-groups. Such sub-groups will also have a better
chance of unravelling interesting biological
processes.
4. Big Data: Big potential but increased chance of
capturing irrelevant markers. An inherent problem
of big data is the danger that a large proportion of
the few results selected to be interesting are actually
irrelevant and appear to be interesting by mere
chance due to the extensive search. In order to
address it, a methodological, well-founded selection
process has to be conducted.This is also the case
with Alzheimer’s disease (AD) data.
1.1 Alzheimer’s Disease
Alzheimer’s disease is the most common form of
dementia. The disease is characterized by the
accumulation of b-amyloid (Ab) plaques and
neurofibrillary tangles composed of tau amyloid
fibrils associated with brain cells damage and
neurodegeneration. The degeneration leads to
progressive cognitive impairment. There is currently
no known treatment, nor one that slows the
progression of this disorder. There is a pressing need
to find markers to both predict future clinical decline
and for use as outcome measures in clinical trials of
disease-modifying agents and foster the
development of innovative drugs (Weiner et al.
2013).
The definite diagnosis of AD requires
histopathologic examination, but commonly the
diagnosis of AD is based on clinical criteria. In
2013, an updated criteria was published in the
Diagnostic and Statistical Manual of Mental
Disorders 5-th edition (DSM - 5) (American
Psychiatric Association 2013). The role of
laboratory and imaging investigations is mainly to
exclude other diagnoses. Some studies suggest that
certain biomarkers including levels of tau protein
(Sonnen et al. 2008), beta-amyloid protein
(Sunderland et al. n.d.), ApoE (Gupta et al. 2011),
may have predictive value for AD in healthy and in
patients with minimal cognitive impairment (MCI).
These may also aid in distinguishing AD from other
forms of dementia, and may identify subsets of
patients with AD at risk for a rapidly progressive
course. However, the role of these measurements in
clinical practice has not been established.
Brain imaging using magnetic resonance imaging
(MRI) is part of the diagnostic process for dementia.
It is mainly used to exclude other possible diagnosis
rather than AD for the condition. In some studies it
has been postulated that a decreased volume of
certain brain areas is related to AD but contradicting
studies found a general process of volume reduction
with aging. Functional brain imaging with [18F]
fluorodeoxyglucose positron emission tomography
(FDG-PET), functional MRI (fMRI), perfusion
MRI, or perfusion single photon emission computed
tomography (SPECT) reveals distinct regions of low
metabolism and hypo perfusion in AD. These areas
include the hippocampus, the precuneus (mesial
parietal lobes) and the lateral parieto-temporal
cortex. Clinical studies suggest that FDG-PET may
be useful in distinguishing AD from frontotemporal
dementia, but this result have not become a standard
for diagnosis.
1.2 The Alzheimer’s Neuroimaging
Initiative (ADNI) Research
The ADNI research was conceived at the beginning
of the millennium as a North American multicenter
collaborative effort funded by public and private
bodies (Weiner et al. 2013). Much of the current
research focuses on one or two specific and
promising biomarkers such as Magnetic Resonance
Imaging results (Evans et al. 2010), FDG-PET
imaging (Langbaum et al. 2010) or CSF biomarkers
(Tosun et al. 2011).
The combined-biomarkers methods are often
based on various machine learning algorithms:
(Kohannim et al. 2010) implemented the support
vector machines (SVM) tool in order to classify AD
and MCI patients. (Hinrichs et al. 2011) tried to
predict conversion from MCI to AD using a multi
kernel learning framework. (Zhang et al. 2013)
presented a three steps methodology: feature
selection using multi-task feature learning methods,
data fusing using kernel-based multimodal-data-
fusion method and finally training a support vector
regression.
As part of the medical informatics sub-project of
the European flagship the Human Brain Project,
we've created an approach that deviates from these
lines of research in four major ways addressing the
challenges mentioned above.
First, we avoid using the available diagnosis as the
ultimate truth, but do embody the current medical
knowledge into the data and analysis process.
Second, we create new diagnosis classes that are
created by analyzing the clinical data. These classes
Categorize,Cluster&Classify-The3CStrategyAppliedtoAlzheimer'sDiseaseasaCaseStudy
567

are more homogeneous in terms of the disease
manifestation. Third, we use these new diagnosis
classes as targets for the biomarkers exploration.
Fourth, we use measurements as the false discovery
rate to lower the chance of irrelevant findings.
In this paper we demonstrate the proposed
approach on a limited part of ADNI data, and on a
limited part of the available information about each
subject. This is but a first step in a longer effort that
will include evaluation and further adaptations,
before expanding to the vast problem of using
hospital data on a grand scale.
2 DATA AND METHODS
2.1 Data
In the preparation of this article we used the
ADNIMERGE table, extracted from the
ADNIMERGE R package (version 0.0.1), which are
obtained from the Alzheimer’s Disease Neuro-
imaging Initiative (ADNI) database (adni.loni.usc.
edu).
To date, over 1500 adults, ages 55 to 90, have been
recruited to participate in the research. We only used
baseline data of ADNI 2 and ADNI Go, out of which
796 subjects had no missing values on the clinical
measurements.
2.2 Pre-processing
As part of the pre-processing we dropped clinical
measurements (CM) that had near one correlation
with another CM. In Addition, we removed from the
analysis the CM EcogSPTotal and the CM
EcogPtTotal as they are both derived from some of
the other sub measurements. In order to reduce
skewness of some of the CMs, log transformations
(for ADAS13, EcogPtMem), logit transformations
(for EcogPtDivatt, EcogPtVisspat, EcogSpDivatt,
EcogSpVisspat, MMSE, MOCA) and inverse
transformations (for CDRSB, EcogPtLang, EcogPt
Organ,EcogPtPlan, EcogSpLang, EcogSpOrgan,
EcogSpPlan, FAQ,Ravlt.prec.forgetting) were
utilized. The following CMs needed no
transformation: RAVLT.forgetting, RAVLT.
immediate and RAVLT.learning. Six new CM were
defined to be the difference between the transformed
patients' report and the partner's report on certain
everyday cognition (Ecog) variable. Finally, all the
variables were scaled to have mean 0 and a variance
of 1.
2.3 The 3C Strategy Stages
2.3.1 Categorization of Variables
Categorization was done using expert medical
knowledge.
(1) The first category is the disease diagnosis
variable as assigned in the ADNI database. This
assigned diagnosis has five levels: Cognitively
Normal (CN), Significant Memory Concern(SMC),
Early Mild Cognitive Impairment(EMCI), Late Mild
Cognitive Impairment(LMCI), Alzheimer’s disease
(AD).
(2) The second category is of clinical
measurements that reflect the patient’s condition and
functionality of the patient. They encompass scores
of different cognitive and psycho-neurological tests
and ratings, according to clinical assessment and
patient’s or partners' report. This battery of cognitive
and functional assessment scores include: Clinical
Dementia Rating Sum of Boxes (CDR-SB),
Alzheimer's disease assessment scale (ADAS),
mini–mental state examination (MMSE), Rey
Auditory Verbal Learning Test (RAVLT), Family
history questionnaire (FAQ) Montreal Cognitive
Assessment (MoCA), Everyday Cognition (Ecog).
(3) The third category includes measurements of
potential biological markers, which were proposed
to have a predictive value for disease risk, for
deterioration, or for severity. These markers are
either proteins levels measured in the cerebrospinal
fluid (CSF) such as ApoE4 (Gupta et al. 2011) or
imaging data from different modalities: FDG-PET
(Walhovd et al. 2010), AV45 PET (Johnson et al.
2013), and MRI. These will be referred to as
potential biomarkers (PB).
2.3.2 Feature Selection and Clustering
In order to create clinical measurements based
classes that are medically easy to interpret, a feature
selection procedure was performed on all potential
clinical measurements. We used Random Forest, but
of course other methods may prove as useful or even
more. Out of 27 original CM, we chose to keep
those that reduced error-rate by 15% or more.
We then clustered the data based on the selected
subset of clinical measurements using k-means
algorithm (again, another algorithm could have been
used). In any such algorithm, the number of clusters
is a crucial parameter. We chose to combine
statistical information with medical perspectives.
According to the latter, there is a natural lower
bound to the number of clusters: the measured
HEALTHINF2015-InternationalConferenceonHealthInformatics
568
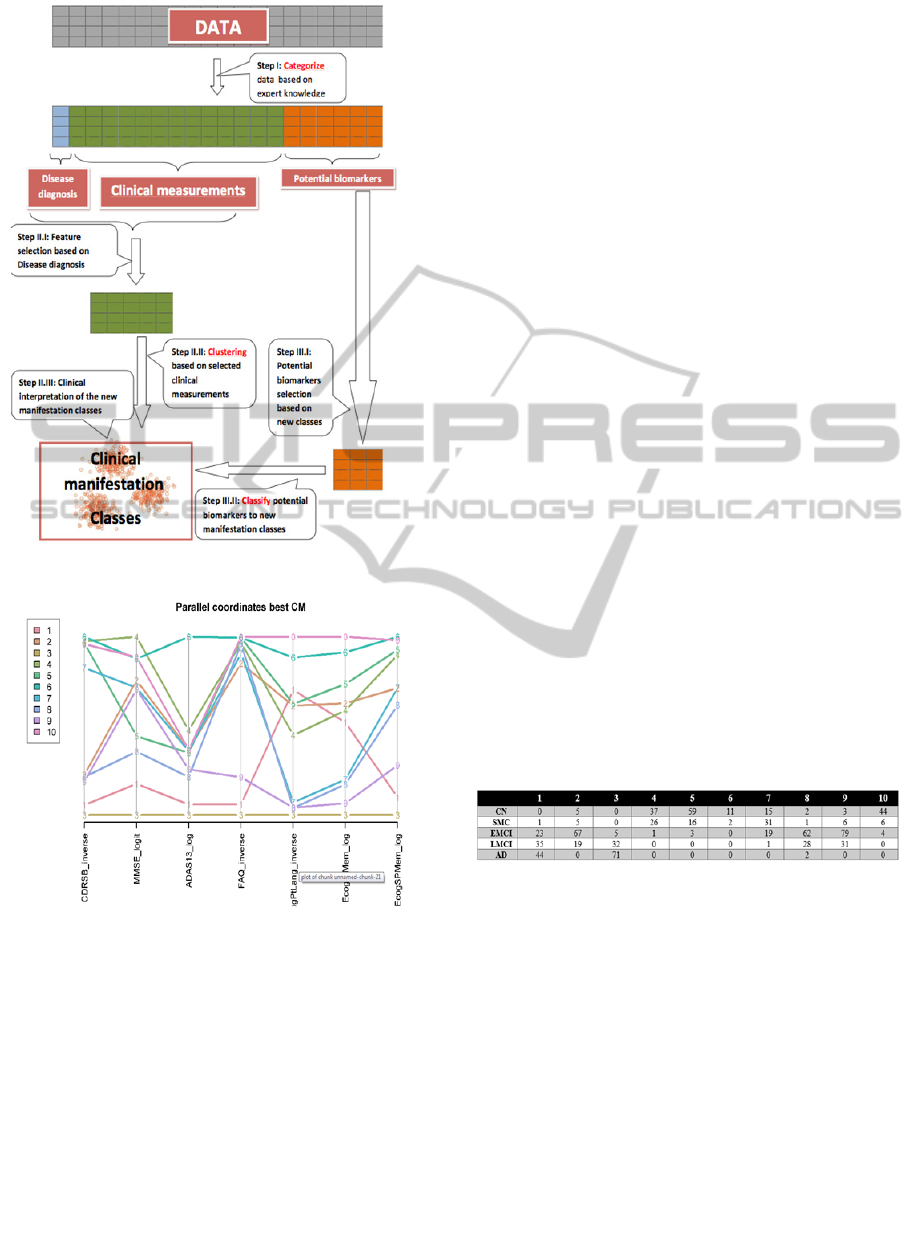
Figure 1: The 3C strategy flow chart.
Figure 2: Profiles plot (parallel coordinates) demonstrating
the values of the CM across classes.
clinical data should represent the different classes of
clinical manifestation including patients' medical
history, background, symptoms, etc. From the
literature (Shadlen et al. MD 2014) and knowledge
about dementia we know that within the clinical
spectrum that could be lines from Normal to AD
there are some sub-classes of patients. It is
reasonable to consider at least 8 subclasses of
disease manifestation:
1. AD with a rapid progression and dysfunction.
2. AD with slower progression course.
3. Cognitive Normal that will not develop dementia.
4. Cognitive Normal that will develop dementia.
5. MCI that will later develop AD.
6. MCI that will develop other irreversible cause (i.e.
FrontoTemporal Degeneration or vascular).
7. MCI that will develop other irreversible cause (i.e.
Dementia of Lewy Bodies - DLB).
8. MCI that will not deteriorate and will stay with a
stable impairment status.
This medical insight into the potential number of
classes was combined with the statistical point of
view, utilizing the gap statistic plot (Tibshirani,
Robert; Walther 2001).
2.3.3 Classifying with Potential Biomarkers
At this stage we classify the new diagnosis classes
using the set of potential biomarkers. In principle
this stage also consists of two parts. First, using
importance analysis by, say, random forests, a
promising subset of the biomarkers is selected.
Then, the final classification step is done using
hierarchical decision trees, or other rule based
analysis, utilizing the selected subset. This is
essential in order to give easy interpretation to the
diagnosis process. In the envisioned application to
hospital data the number of potential biomarkers
may increase to thousands, before incorporating
genomic information. Thus, the subset selection
stage may be crucial. In the current analysis we skip
this stage as the number of PB is small.
Table 1: Cross-classification table of originally assigned
diagnosis vs clinical classes.
2.4 Algorithms and Software
Analyses were performed using R (R Core Team
n.d.) . For assessing the importance of the clinical
measurements (as a preparation to the Clustering
stage) we used the classification method of the
{randomForest} R package (Liaw & Wiener 2002).
Importance was measured as the marginal loss of
classification accuracy for each variable by
randomly permuting it in the test (out of bag)
validation set. For clustering we used the R package
{cluster} (Maechler et al. 2013), using the gap
statistic to choose the number of clusters. The gap
statistic was based on 100 bootstarps and calculated
for up to 20 clusters. Clustering was done using k-
means with 10 iterations at most, based on the
Categorize,Cluster&Classify-The3CStrategyAppliedtoAlzheimer'sDiseaseasaCaseStudy
569

Hartigan and Wong algorithm. Classification and
regressions tree (CART) was constructed using the
{rpart} R package, the tree was constructed with the
minimal possible number of observations for a split
set to zero, minimal number of observation in a leaf
set to zero, and with a 10-fold cross validations for
tuning the complexity parameter. Scatter plot matrix
was produces using the {psych} R package (Revelle
2010).
3 RESULTS
3.1 Categorization of Variables
Categorization yielded one variable of assigned
diagnosis with 5 different diagnosis values, 27
clinical measurements and 10 potential biomarkers.
3.2 Clustering
3.2.1 Selection of Clinical Measurements
Out of 27 potential CM, we chose to keep the 7 CM
that reduced error-rate of predicting the assigned
diagnosis by 15% or more.
3.2.2 Clustering of Clinical Measurements
The 7 selected CM were clustered using k-means
with varying number of means and the gap statistics
plot for aid in the choice of the number of clusters.
The first local maxima of the gap statistics above the
clinically determined lower bound was chosen to
indicate that 10 clinically determined classes are
needed. In order to discuss the meaning of the newly
created classes we present their cross-classification
with the assigned diagnosis in Table 1, a profiles
plot in Figure 2 and a CART decision tree in figure
3.
Classes 1, 3 contain nearly all the participants
with an assigned diagnosis of AD. Class 3 might be
a class of more severe AD cases (see minimal
average level on all coordinates of the profile plot).
From this plots we also see that Class 1 members
score higher on EcogPtLang and EcogPtMem than
those classified to 3. Classes 4,5 and 10 hold the
majority of patients whose assigned diagnosis is CN.
It is interesting that while these classes have a very
small amount of patients with different diagnoses
they were still separated to three classes based on
their clinical manifestation. Class 4 has the highest
“MMSE” and a low “CDRSB” scores, which points
to a group of clinically normal participants, but the
score in "ECogPtLang” is lower than other classes
which could mean that these participants are more
concerned of their personal observation of language
difficulties. Classes 6 and 7 include normal and
mildly affected participants (sharing the same
branch in the decision tree), but differ from each
other especially in their patients' "ADAS13" scores.
Another group of classes is 2,8,9 in which patients
are distributed almost uniformly but their disease
manifestation differ from one another (though they
all seem to have a progressive disease but not to the
level which qualifies as AD). Inspecting the decision
tree representing the classes (figure 4), we can see
that “FAQ” feature had much influence on the
clustering: the classes with low “FAQ” are 1,3,9
meaning those patients would be likely to have a
progressive disease. Further down on the right
branch of the tree, class 3 has a low “MMSE” score
and class 1 has low score on “ECogPtLang”
representing the interference of language impairment
of the patient’s life in his own perception. Walking
down the left branch of the tree the first split sends
down the right branch all patients with a “CDRSB”
score of over 0.33, this by definition of the inclusion
criteria will not allow normal participants in that
branch. Clusters 2,8,9 occupy that branch of the
CART decision tree.
This decision tree gives the possibility to
determine rules and to explain to the physician the
way the classes where created from the data. The
first two branches divide the participants into
"Normal" and "Not Normal". This division of the
data is done using 2 variables: “FAQ” and
“CDRSB”, that are related to disease state
definitions. Then, both branches use the level of
“MMSE” to create a separation within each branch
between normal and AD affected. In a lower and
fine distinction the next junction divides them to a
class of participants according to ECogPtLang value
meaning that the participant feels at least
occasionally that his language ability is worse than it
was 10 years earlier.
3.3 Classification
The potential biomarkers used to classify subjects to
the ten clinically relevant classes consist of “ApoE”,
“AV45”, “FDG”, “Entorhinal”, “Fusiform”,
“Hippocampus”, “ICV”, “Midtemp”, “Ventricles”,
and “Whole-brain”. Interpretation of this step could
be done using the classes’ description shown above.
The PB decision tree (figure 4) distinguishes
primarily between the patients designated to class 3
concurrent with severely symptomatic disease. The
HEALTHINF2015-InternationalConferenceonHealthInformatics
570
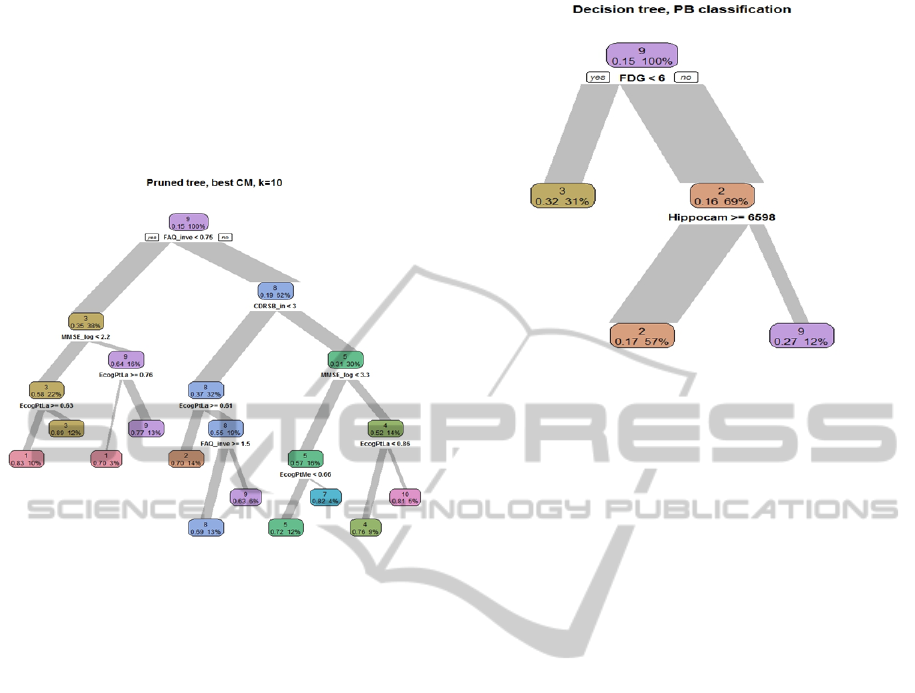
first node uses "FDG" value as a criteria to split
those with severe AD from others. This coincides
with that FDG is a known marker of AD. Having
more homogenous classes of patients has the
potential of yielding better relation between a
biomarker and a specific class of disease
manifestation.
Figure 3: Decision tree representing the classes resulted
from the clustering step.
4 SIMULATION MODEL
In order to study and evaluate the suggested 3C
strategy under different settings we created a
simulation model. In addition to the evaluation of
the 3C strategy as a whole, and since various
algorithms might be used in each of the steps, a
simulation can be helpful in determining which
algorithms yield the best results. Different datasets
were created in order to simulate possible scenarios.
In the simplest dataset, 4 current diagnoses are
assigned to patients but one of which should actually
be decomposed into two different diseases.
Simulations were conducted in different levels of
noise. For every noise level several methods for
feature selection and clustering methods were
compared. Finally, the number of clusters (K) must
be determined by the user. For each of the clustering
algorithms there are a few possible criterions
designed to indicate a recommended number of
clusters. The clustering was then made both
according to the yield results and according to an
"oracle" answer with the real number of clusters.
The use of the Oracle answer was added in order to
avoid an influence of the wrong number K on the
clustering step itself.
Figure 4: Decision tree representing prediction of classes
from potential biomarkers.
5 DISCUSSION
The criteria currently in use according to DSM-5
(American Psychiatric Association 2013) for
diagnosis of AD relies on the clinical and functional
ability of the patient. Most biological exams, such as
imaging results, are mainly used to rule out other
possible diagnoses.
In our strategy we therefore differentiate between
variable which are descriptive of the patient’s
functional conditions and variables which are
collected in order to try and find possible disease
causes, the latter being targets for drug development
or surrogate markers for disease stage or trajectory.
The accuracy of a diagnosis depends on the
available knowledge at the time it was made and the
available knowledge at that moment. DSM V
presented ten etiological subtypes which did not
appear in prior editions. Other than the explicit link
to specific known etiologies, most of these subtypes’
criteria are largely similar to one another. However,
there are important and often subtle differences
between these disorders (American Psychiatric
Association 2013). We present an approach
separating patient to groups according to their
clinical data. Interestingly, our data also identifies 10
classes that might represent a more accurate
distinction of the patients compared with the 5
diagnosis criteria given by the ADNI protocol.
We do not claim that our findings present our
best current views on the problem. We are very
aware that this was but a sketch of strategy that
happened to offer some new insights. Further
exploration is needed on a few fronts: The use of the
Categorize,Cluster&Classify-The3CStrategyAppliedtoAlzheimer'sDiseaseasaCaseStudy
571

raw exams data instead of combined scores, adding
potentially important measurements, enlightenment
of the data by expert knowledge such as differing
questions to the different cognitive function domain
measured could all help in creating more subtle and
fine clusters of patient’s disease presentation. From
a statistical point of view, different clustering
procedures and/or different selection procedures
may yield better results under different settings, an
issue we have not started to address at all.
We believe that the attempt to predict from very
specific potential biomarker is futile. The route we
have taken is to predict more subtle disease
manifestation classes. Such a process needs further
exploration but has the potential to fit a small
biomarker arrow to the clinical bull’s eye.
In many studies and definitely in the ADNI
study a vast amount of measurable information is
collected. Is it enough? The tacit knowing held and
applied by proficient practitioners represents a
valuable form of clinical knowledge, which has been
acquired through experience, and which should be
investigated, shared, and contested (Malterud 2001).
In clinical work, tacit knowing constitutes an
important part of diagnostic reasoning and judgment
of medical conditions. We made an effort to
incorporate this knowledge into the process so that a
valuable aspect of analysis and interpretation of the
results could be added. Further exploration is needed
of both the data nuances and methods, before trying
to scale to the much harder problem associated with
regular hospital data. We do believe that the strategy
we have outlined in this work is capable of
achieving that.
ACKNOWLEDGEMENTS
**Data used in preparation of this article were
obtained from the Alzheimer’s Disease Neuro-
imaging Initiative (ADNI) database (adni.loni.usc.
edu). As such, the investigators within the ADNI
contributed to the design and implementation of
ADNI and/or provided data but did not participate in
analysis or writing of this report. A complete listing
of ADNI investigators can be found
at:http://adni.loni.usc.edu/wpontent/uploads/how_to
_apply/ADNI_Acknowledgement_List.pdf
The research leading to these results has received
funding from the European Union Seventh
Framework Programme (FP7/2007-2013) under
grant agreement no. 604102 (Human Brain Project).
REFERENCES
American Psychiatric Association. (2013). DSM-5 criteria
for major neurocognitive disorder due to AD (Fifth
Edit.). Arlington, VA.
Sonnen, J. A., Montine, K. S., Quinn, J. F., Kaye, J. A.,
Breitner, J. C. S., & Montine, T. J. (2008). Biomarkers
for cognitive impairment and dementia in elderly
people. Lancet Neurology, 7(8), 704–14. doi:10.1016/
S1474-4422(08)70162-5.
Evans, M. C., Barnes, J., Nielsen, C., Kim, L. G., Clegg,
S. L., Blair, M., Fox, N. C. (2010). Volume changes in
Alzheimer’s disease and mild cognitive impairment:
cognitive associations. European Radiology, 20(3),
674–82. doi:10.1007/s00330-009-1581-5.
Gupta, V. B., Laws, S. M., Villemagne, V. L., Ames, D.,
Bush, A. I., Ellis, K. A., Martins, R. N. (2011).
Plasma apolipoprotein e and Alzheimer disease risk:
The AIBL study of aging. Neurology, 76(12), 1091–
1098.
Hinrichs, C., Singh, V., Xu, G., & Johnson, S. C. (2011).
Predictive markers for AD in a multi-modality
framework: An analysis of MCI progression in the
ADNI population. NeuroImage, 55(2), 574–589.
Kohannim, O., Hua, X., Hibar, D. P., Lee, S., Chou, Y.-
Y., Toga, A. W., Thompson, P. M. (2010). Boosting
power for clinical trials using classifiers based on
multiple biomarkers. Neurobiology of Aging, 31(8),
1429–42. doi: 10.1016/j.neurobiolaging.2010.04.022.
Langbaum, J. B. S., Chen, K., Lee, W., Reschke, C.,
Fleisher, A. S., Alexander, G. E., Reiman, E. M.
(2010). categorial and correlational analyses of
baseline flourodeoxyglucose positron emission
tomography images from the Alzheimer's disease
NeuroImage, 45(4), 1107–1116. doi:10.1016/
j.neuroimage.2008.12.072.
Liaw, A., & Wiener, M. (2002). Classification and
Regression by randomForest. R News, 2(December),
18–22.
Maechler, M., Rousseeuw, P., Struyf, A., Hubert, M., &
Hornik, K. (2013). Cluster Analysis Basics and
Extensions. R package version 1.14.4. CRAN.
Retrieved from http://cran.r-project.org/web/packages/
cluster/index.html.
Malterud, K. (2001). The art and science of clinical
knowledge: evidence beyond measures and numbers.
Lancet, 358(9279), 397–400. doi:10.1016/S0140-6736
(01)05548-9.
R Core Team. (n.d.). R: A language and environment for
statistical computing. Retrieved from http://www.r-
project.org/
Revelle, W. (2010). psych: Procedures for psychological,
psychometric, and personality research. Northwestern
University: Evanston, Illinois, 0–90.
Shadlen, Marie-Florence, MD; Larson, Eric B, MD, M.
(2014). UpToDate: Evaluation of cognitive
impairment and dementia. Retrieved from http://www.
uptodate.com/contents/evaluation-of-cognitive-
impairment-and-dementia.
HEALTHINF2015-InternationalConferenceonHealthInformatics
572

Sunderland, T., Linker, G., Mirza, N., Putnam, K. T.,
Friedman, D. L., Kimmel, L. H., Cohen, R. M. (n.d.).
Decreased beta-amyloid1-42 and increased tau levels
in cerebrospinal fluid of patients with Alzheimer
disease. JAMA : The Journal of the American Medical
Association, 289(16), 2094–103. doi:10.1001/jama.
289.16.2094.
Tibshirani, Robert; Walther, G. H. (2001). Estimating the
number of clusters in data set via the gap statistic.
Journal of the Royal Statistical Society: Series B, part
2.
Walhovd, K. B., Fjell, a M., Brewer, J., McEvoy, L. K.,
Fennema-Notestine, C., Hagler, D. J., Dale, a M.
(2010). Combining MR imaging, positron-emission
tomography, and CSF biomarkers in the diagnosis and
prognosis of Alzheimer disease. AJNR. American
Journal of Neuroradiology, 31(2), 347–54. doi:10.
3174/ajnr.A1809.
Weiner, M. W., Veitch, D. P., Aisen, P. S., Beckett, L. a,
Cairns, N. J., Green, R. C., Trojanowski, J. Q. (2013).
The Alzheimer’s Disease Neuroimaging Initiative: a
review of papers published since its inception.
Alzheimer’s & Dementia : The Journal of the
Alzheimer's Association, 9(5), e111–94. doi:10.1016/
j.jalz.2013.05.1769.
Zhang, Daoqiuang; Shen, D. (2013). Multi modal multi
task learning for joint prediction of multiple regression
and classification variables in Alzheimer’s disease.
Neuroimage, 59(2), 895–907. doi:10.1016/j.neuro
image.2011.09.069.
Categorize,Cluster&Classify-The3CStrategyAppliedtoAlzheimer'sDiseaseasaCaseStudy
573
