
An Unsupervised Method for Suspicious Regions Detection in
Mammogram Images
Marco Insalaco
2
, Alessandro Bruno
1
, Alfonso Farruggia
2
, Salvatore Vitabile
2
and Edoardo Ardizzone
1
1
Dipartimento di Ingegneria Chimica, Gestionale, Informatica, Meccanica (DICGIM), University of Palermo,
Via delle Scienze - building 6, Palermo, Italy
2
Dipartimento di Biotecnologie Medico e Forensi (DIBIMEF), University of Palermo, Via del Vespro 129, Palermo, Italy
Keywords: Mammograms, Breast Cancer, Suspicious Regions, SURF, Biomedical Imaging, Mapping, Histogram
Specifications.
Abstract: Over the past years many researchers proposed biomedical imaging methods for computer-aided detection
and classification of suspicious regions in mammograms. Mammogram interpretation is performed by
radiologists by visual inspection. The large volume of mammograms to be analyzed makes such readings
labour intensive and often inaccurate. For this purpose, in this paper we propose a new unsupervised method
to automatically detect suspicious regions in mammogram images. The method consists mainly of two
steps: preprocessing; feature extraction and selection. Preprocessing steps allow to separate background
region from the breast profile region. In greater detail, gray levels mapping transform and histogram
specifications are used to enhance the visual representation of mammogram details. Then, local keypoints
and descriptors such as SURF have been extracted in breast profile region. The extracted keypoints are
filtered by proper parameters tuning to detect suspicious regions. The results, in terms of sensitivity and
confidence interval are very encouraging.
1 INTRODUCTION
Breast cancer is the most common form of cancer in
the female population. Optical mammography aims
to detect breast cancer by characterizing the
physiological state. The detected optical signals (red
and infrared light) provide informations on the
spatial distribution of the breast tissue properties.
Screening mammography is a cost-effective method
to detect early breast cancer. Many researchers
proposed biomedical imaging methods for
computer-aided detection and classification of
suspicious regions in mammograms. Mammogram
interpretation is performed by radiologists by visual
inspection and examination of the images in search
of abnormalities that may be malignant. The large
volume of mammograms to be analyzed makes such
readings labour intensive and often inaccurate.
Several studies have shown a percentage between
10% and 25% of missed tumors in current breast
cancer screening. CAD (Computer Aided Diagnosis)
methods are used as a "second opinion" by the
radiologists. The objective of CAD methods is to
perform preprocessing steps to give some
suggestions to the radiologists in mammograms
analisys. The difficulty of the diagnostic task have
generated an increasing interest in developing
computer-aided detection methods (Doi, 2007). The
identification of masses is a difficult task because of
the borders of the masses are often ill-defined
making difficult to distinguish between
parenchyma's tissue structures and masses. Many
radiologists use the following standard tissue
classification (Wolfe, 1976): Fibro-adipose tissue:
indicates a fat breast with little fibrous connective
tissue; Glandular tissue: indicates the presence of
prominent duct pattern; Dense tissue: indicates a
dense breast parenchyma. Radiologists stated that a
patient has breast cancer if some types of masses of
calcifications are detected in mammogram. As
described in (Cheng, 2005), the most popular mass
detection methods consist of six steps: 1) Digitizing
Mammogram; 2) Image Preprocessing; 3) Image
Segmentation; 4) Feature Extraction and Selection;
5) Classification; 6) Evaluation. Image
preprocessing can suppress noise and improve the
302
Insalaco M., Bruno A., Farruggia A., Vitabile S. and Ardizzone E..
An Unsupervised Method for Suspicious Regions Detection in Mammogram Images.
DOI: 10.5220/0005277103020308
In Proceedings of the International Conference on Pattern Recognition Applications and Methods (ICPRAM-2015), pages 302-308
ISBN: 978-989-758-077-2
Copyright
c
2015 SCITEPRESS (Science and Technology Publications, Lda.)

contrast of the image, image segmentation is defined
about mass detection as locating the suspicious
regions. Features extraction and selection are
defined to classify different types of lesions and to
reduce false positives. Masses are grouped with
respect to their size (Kom, 2005): small size (3-15
mm), middles size (15-30 mm) and large size (30-50
mm). Masses of size smaller than 5 mm or larger
than 50 mm are left out during detection for
diagnosis. In this paper we proposed a new method
for suspicious regions detection in mammograms
based on two steps: preprocessing; features
extraction. In preliminary experiments we achieved
a good sensivity accuracy in suspicious regions
detection. The paper is organized as it follows: in
section 2 we give an overview of the state of the art
methods; in section 3 we describe the proposed
method; in section 4 we show the experimental
results; section 5 ends the paper with conclusions
and future works.
2 STATE OF THE ART
Several research works, in last decades, tried to
develop computer aided diagnosis tools to help the
radiolgists in the interpretation of the mammograms.
Some methods aimed to enhance the digitized
image prior to object identification (breast cancers,
microcalcifications, lesions). te Brake and
Karssemeiger (te Brake, 1998) proposed a method to
identify stellate distortions by using an orientation
map of line-like structure where the location of
possible tumors can be detected. Petrick et al
(Petrick, 1996) performed a two-stage adaptive
method, based on contrast enhancement filtering
along with edge detection and morphological
features classification, for the segmentation of
masses in mammograms. In (Gupta, 1995) the
authors used Laws filters to identify suspicious
regions in mammography. Viton (Viton, 1996)
performed a method based on the degree of
spiculation and the presence of fuzzy areas in the
boundary of the tumor. Li et al (Li, 2001) proposed a
method based statistical modelling using bayesian
relaxation labelling for the identification of
suspicious regions. In (Highnam, 1999) the authors
described some methods to detect the presence or
the absence of lesions from the mammograms.
When mammograms manifest masses, this could
correspond to the detection of suspicious regions
(nodular opacities, clear masses with lobed edges,
stellar opacities, microcalcifications).
Several image processing methods have been
proposed to perform suspicious regions detection.
Some methods aimed to enhance the digitized image
prior to object identification. The structural
asymmetry between the right and the left breast
images is used to determine mass locations (Lau,
1991). Several methods for masses detection in
mammogras are based on segmentation techniques
(Kekre, 2009). In (Kekre, 2009) the authors
proposed a tumor detection in mammography
images using vector quantization technique.
Template matching is one of the most common
approaches for medical image segmentation, it is
also used to segment possible masses from the
background of mammograms using prototypes.
Masses prototypes are created based on the
characteristics of the targeted masses, such as in
(Tourassi, 2003). In (Rogova, 1999) the authors
performed an approach to detect all different lesions
by unsupervised segmentation method. Fuzzy
logical (Sameti, 1996) also has been introduced for
segmenting suspicious regions. The features
extraction is a fundamental step in mass detection
since the performance of CAD (Computer aided
diagnosis) depends on the selection and optimization
of the features than the classification method.
Features, such as the size, shape, density,
smoothness, texture descriptors, can be calculated
from the region of interest (ROI), otherwise,
excessive features may degrade the performance of
the classifier. Significant features mainly include
(Li, 2001) four considerations: discrimination,
reliability, independence, optimality. Some
supervised methods used ANN (artifical neural
network), BBN (Bayesian Belief Network) (Zheng,
1999) linear discrimination, genetic algorithm (GA)
(Sahiner, 1998). The classifiers can be combined to
improve the classification rate: in (Constantinidis,
2001) five different classifiers such as multivariate
Gaussian classifier (MVG), radial basis function
(RBF), Q-vector median (QVM), 1-nearest
neighbour (1NN) and hyperspheric Parzen Windows
(PZN) are combined to detect masses in
mammograms. Cascio et al. in (Cascio, 2006)
performed a method for detecting masses in
mammographic images consisting of two steps:
image segmentation by contour searching and mass
lesions classifications with neural network. A
method for automatic detection of mammographic
masses is performed by Domìnguez and Nandi
(Domìnguez, 2008), it is based on regions
segmentation and ranking. The regions are
segmented via thresholding at multiple levels, then a
set of features is computed for each of the
segmented regions. The region ranking identifies the
AnUnsupervisedMethodforSuspiciousRegionsDetectioninMammogramImages
303

regions most likely to represent abnormalities
baseed on features computed. Multiresolution local
binary pattern texture analysis and variable selection
for false-positive reduction are used in (Choi, 2012)
computer aided detection of breast masses on
mammograms. Supervised methods require the
training stage to optimize their performance. In
unsupervised methods (Oliver, 2010) the
perfomance of the algorithm depensds almost
entirely on tuning parameters, i.e. adjusting a
threshold value to find the balance between
sensitivity and specificity. Muramatsu et al.
(Muramatsu, 2013) performed a method based on
multidimensional scaling (MDS), more precisely
they constructed similarity maps which can visually
present the relationships between the lesions, with
supplemental information to the reference images. In
(Natarajan, 2013) Natarajan et al. focused their
attention upon the detection of a tumor in the breast
mammogram images by utilizing variuos techniques
such as filtering, contrast adjustment, image
stretching, image subtraction, transformation
operations, flood fill operations and segmentation.
Alias and Paulchamy (Alias, 2014) performed a new
method based on artificial neural networks and
likelihood function for breast tumor detection. In
(Farruggia, 2014), the authors presented a technique
for mammogram images retrieval and classification
based on Bayesian Naive classifier.
In the next section we give a brief description of
SURF (speeded up robust features) keypoints and
descriptors. SURF are used in our method to detect
the masses on mammograms.
2.1 SURF (Speeded up Robust
Features)
SURF (Speeded Up Robust Feature) (Bay, 2008) is
an interest point detector and descriptor, designed to
be robust against scaling and rotation transforms,
and to be faster than earlier methods. The speed gain
is achieved by taking profit of integral images and a
fast non maximum suppression algorithm. It is based
on three steps: interest points extraction, repeatable
angle computation and descriptor computation.
Local keypoints are detected by using the Fast-
Hessian Detector. Location and the scale of the
points are calculated by the determinant of the
Hessian matrix. Given a point x = (x,y) in an image
I, the Hessian matrix H
,
; in x at scale σ is
defined as it follows:
H(x, σ) =
,
,
,
,
(1)
L
xx
,
is the convolution of the Gaussian second
order derivative with the image I in point x,
similarly for L
xy
,
and L
yy
,
.
Invariance to image rotation, is achieved by
using the Haar wavelet responses in horizontal and
vertical direction. The maximum angle of the
gradients surrounding the interest point is chosen as
the direction of the feature. Finally, a square region
is generated around each interest point, aligned to
the selected orientation and split into in 4x4 sub-
regions. In each sub-region Haar wavelets are
extracted at regularly spaced sample points. Wavelet
responses in horizontal and vertical directions are
summed up over each sub region and the resulting
SURF descriptor vector is of length 64.
3 THE PROPOSED METHOD
The proposed method allows the identification of
pathological areas in mammographic images on
patients who show adipose or fibro-adipose structure
of the breast tissue.
Suspicious areas, probably attributed to benign
or malignant tumor, are identified through an
unsupervised algorithm. The most important
objective of our method is to perform an aid to
clinical diagnosis. The proposed method consists of
two phases: preprocessing of the image and the
feature extraction. The preprocessing step consists of
image global transforms, resulting in two images
with different contrast level; SURF Keypoints
descriptors (Bay, 2008) are used to identify areas of
interest. In the next subsections a more detailed
description of the steps of the proposed method is
given.
3.1 Image Preprocessing
Mammogram images generally are represented with
14-bit grayscale, otherwise the reading process
assigns an array of 16-bit m × n, where m and n
represent the resolution of the image. An image with
14-bit grayscale, allocating 16-bit, is a low key
image (Figure 1) with a consequent loss of details of
crucial importance for the diagnosis of pathological
areas. For this reason we perform some global
transforms on the images, to improve the dynamic
range of the mammogram image. The techniques
used for the enhancement of these types of images
mainly consists of the analysis and modification of
the histogram. The proposed method automatically
identifies the proper range of gray levels desired for
a good representation of the visual information of
ICPRAM2015-InternationalConferenceonPatternRecognitionApplicationsandMethods
304
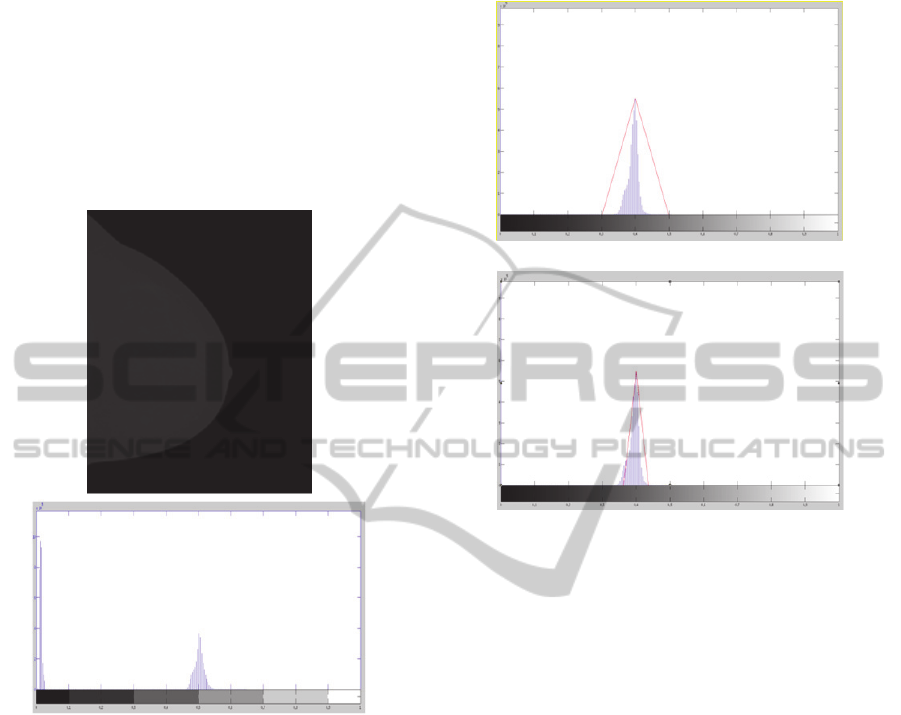
the mammograms. We convert the pixel values in
double format, then we analyze the histogram
(Figure 1). As seen in figure 1, the first part of the
histogram of a mammogram contains informations
only on background of the image, this informations
are unnecessary with respect to the identification of
suspicious regions. For this reason we decide to do
not take into account background histogram
information (the first curve, on left side of the
histogram, see figure 1). For this purpose we apply a
simple gray levels mapping transform.
Figure 1: Mammogram image and the related histogram.
More in details, we calculate the following
equation (eq. 2):
ΔN
Bin
= NumBin(i)-NumBin(i+1); (2)
Δ
N
Bin
is the difference between the number of
occurrences (NumBin(i)) for a given greylevel (i)
and the number of occurrences (NumBin(i+1)) of the
next greylevel (i+1).
Δ
N
Bin
is computed until it is
lower than a fixed threshold (5x10
5
).
Then, we select the coordinates of Bin(i+1)
corresponding to last
Δ
N
Bin
value. We need Bin(i+1)
coordinates to map histogram values. This transform
is simply a gray levels mapping described in the
following formula:
S = T(r)
T(r)
0→
1
→
1
(3)
From the eq. 3, (i+1) is greylevel referring to
Bin(i+1).
(a)
(b)
Figure 2: The identification of the first (a) and second (b)
gray levels dynamic range.
After the mapping transform (equation 3), the
mammogram histogram (figure 2) simply shows the
informations referred breast tissue (the curve
highliths the gray levels of breast tissue).
We want to detect and analyze suspicious
regions in mammogram images. For this purpose we
decide to analyze two versions of the the same
image with different levels of contrast. The objective
is to validate the detected suspicious regions by the
intersection of visual informations identified on two
version of the same mammogram. More simply, we
decide to generate two version of the same
mammogram based on histogram specifications
based on a larger and a lower dynamic gray levels
range (Figure 3). The gray levels ranges are detected
by two triangles in the histogram (Figure 2). The
following part of this section describes how to
identificate the triangles.
We need to identify the coordinates of the
vertices of the first triangle in the histogram. The
higher vertex of the triangle corresponds to the
second maximum value of the histogram (figure 2).
The others vertices of the triangle are detected
experimentally: starting from the coordinates of the
first vertex, we select the 25
th
bin position on the left
AnUnsupervisedMethodforSuspiciousRegionsDetectioninMammogramImages
305
side (in order of decreasing bins) with respect to the
second maximum value of the histogram. Third
vertex is detected by mirroring the 25
th
bin position
with respect to first vertex of the triangle. The same
technique is used to locate the second triangle
vertices, otherwise we select the 2
th
position instead
of the 25
th
.
Figure 3: The results of histogram specification by the first
dynamic grayscale range (Figure 2a) and by the second
dynamic grayscale range (Figure 2b).
3.2 Features Extraction
In scientific literature several local keypoints and
descriptors have been proposed for image processing
applications. We used the SURF (Bay, 2008)
descriptors to extract accurate informations on the
mammogram images, to detect the suspicious
regions for computer aided diagnostic with a good
level of sensitivity. The extractions of SURF
keypoints allow us to highlight important visual
informations corresponding to suspicious regions of
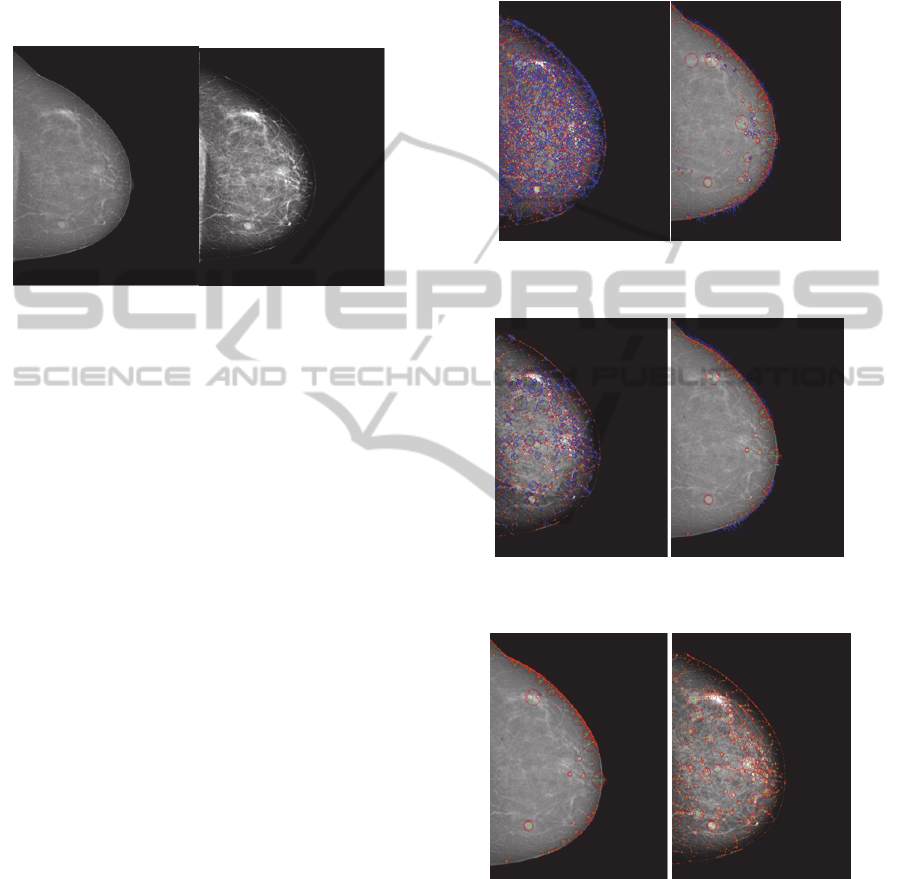
the image. The extraction of the keypoints can be
tuned with respect to some parameters, such as
scale, orientations, radius, thresholds. We extract
SURF keypoints on the two mammogram
versions(figure 3). The extraction of SURF
keypoints with default parameters (figure 4) can
generate a too large number of keypoints. Only a
few of this points are located in suspicios regions.
Each step of the method in feature extraction has
been conducted on the two images resulting from
preprocessing step (gray levels mapping and
histogram specifications).
Several tests have been conducted attempting to
set the optimal combination of paramters: the value
of the treshold was changed from 2x 10⁻⁴ to 5 x 10-
4. In figure 5 the SURF keypoints extracted with
threshold value equal to 5 x 10⁻⁴. Furthermore many
tests have been conducted with respect to radius
paramters, this paramter is very important because
corresponding to the size of possible suspicious
objects or regions in mammogram images. We are
not interested to analyze the keypoints located on the
edge of the breast because this locations do not
identificate suspicious regions. For this reason we
discard the Keypoints having Laplacian value lower
than zero (figure 6).
Figure 4: Features extraction with default SURF
parameters.
Figure 5: Features extractions with modified SURF
parameters.
Figure 6: Features extraction with positive laplacian
values.
The thresholding of the radius parameter (90)
allows us to achieve higher accuracy values. (Figure
7).
Then we consider the intersections of local
keypoints of the two images (the intersection of
keypoints with the same or similar position in the
two images) as a good information to confirm the
ICPRAM2015-InternationalConferenceonPatternRecognitionApplicationsandMethods
306
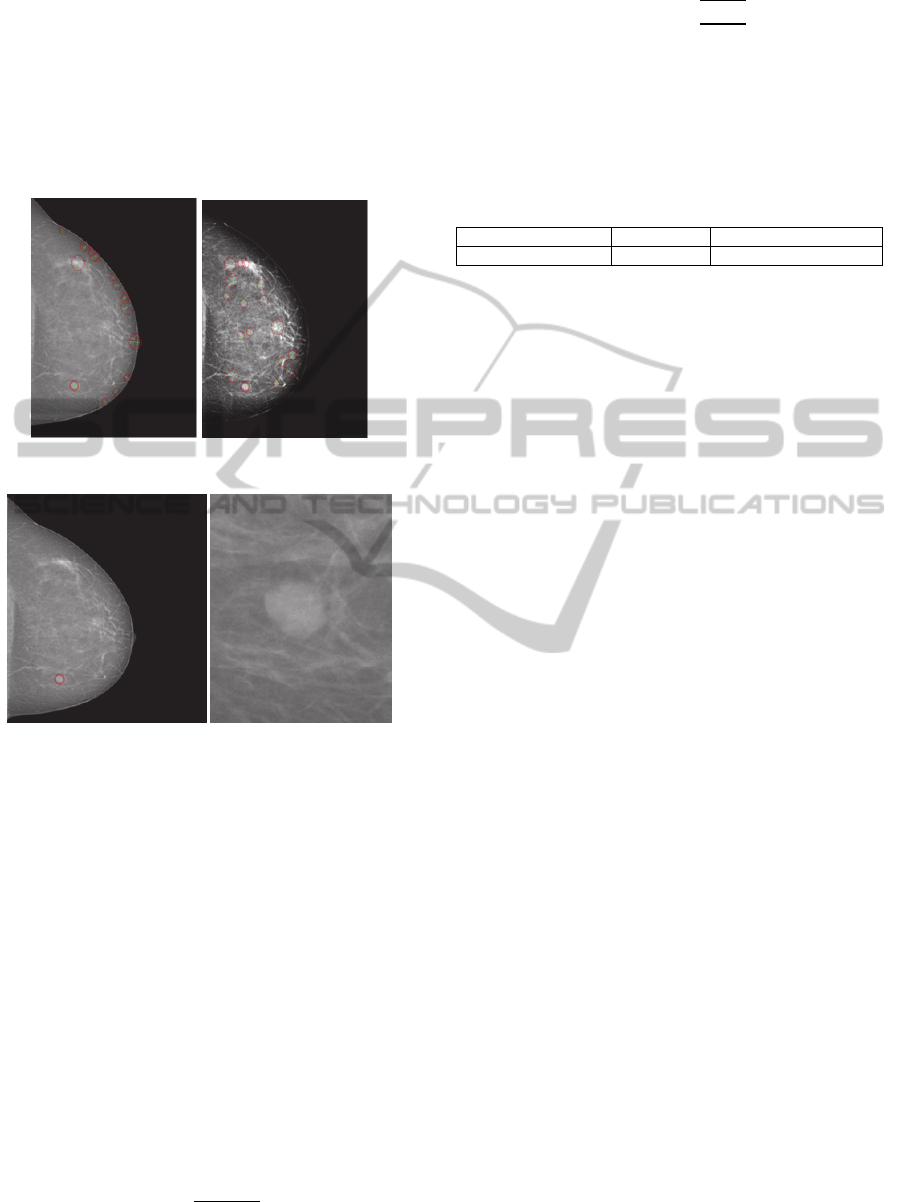
"suspiciousness" of the regions detected. For this
purpose, we used the Euclidean distance between the
coordinates of the points (belonging to the two
images). If the euclidean distance is lower than a
certain threshold, local keypoints will be considered
as points of interest, otherwise the keypoints are
discarded (Figure 7), then the suspicious region
detected can be cropped (Figure 8).
Figure 7: Feature extraction with threshold on radius.
Figure 8: The identification of suspicious region after the
proposed method is applied (left) and the crop of
suspicious region detected (right).
4 EXPERIMENTAL RESULTS
The proposed method has been implemented in
Matlab. The used dataset is composed of
mammograms belong to sixty female pathological
patients. The format of the mammograms is
DICOM, the spatial resolution is 3484x2816 with
14-bit depth. We compute the percentage of True
Positives (TP), False Negatives (FN) with respect to
the total number of lesions. The results also have
been analyzed by radiologist, to validate the
performance of the method. For a more detailed
measure of the method accuracy, Sensitivity and
Confidence Interval have been computed (eq 4-5).
Sensitivity =
(4)
CI = TP ± 1.96 x
(5)
In equation 5 CI represents the Confidence Interval,
S represents the Sensitivity (equation 4), N is the
number of cases, 1.96 is a costant value used for
95% confidence interval. The results are shown in
tab.1.
Table 1: Statistical accuracy results.
Number of cases Sensitivity Confidence Interval
60 0.89 0.81 -- 0.97
The Sensitivity is almost 90%, this is very
encouraging because indicating a very low number
of false negatives. On the other hand some false
positives are detected by the method and this is
measured by precision index. In terms of Computer
Aided Diagnostic, high values of Sensitivity are very
promising and suggest to continue the tests of our
method on a larger number of images.
5 CONCLUSIONS & FUTURE
WORKS
In this paper we proposed a new method for
computer aided diagnostic to detect suspicious
regions in mammograms. This method is
unsupervised and consists of two main steps:
preprocessing; features extraction and selection. By
using appropriate gray levels mapping and
histogram specifications we achieved a dynamic
range of grayscale representations. Then we used
SURF keypoints and descriptors to detect and
analyze suspicious regions of the mammogram
images. The results, in terms of sensitivity are very
encouraging. Moreover, the results revealed a not
negligible number of false positives. Future works
will be aimed to use some adaptive histogram
transforms instead of fixed thresholds with respect to
maximum value of the histogram.
Furthermore we want to extend the experiments
by using a larger testset and some others local
keypoints descriptors based on mathematical
operators, different from Hessian (on which is based
SURF).
REFERENCES
Doi, K., 2007. Computer-aided diagnosis in medical
imaging: historical review, current status and future
potential. Computerized medical imaging and
AnUnsupervisedMethodforSuspiciousRegionsDetectioninMammogramImages
307

graphics.
Wolfe, N., 1976. Risk for breast cancer development
determined by mammographic parenchimal pattern.
Cancer.
Cheng, H. D., Shi, X. J., Min, R., Hu, L. M., Cai, X. P.,
Du, H. N., 2005. Approaches for automated detection
and classification of masses in mammograms. Pattern
Recognition, Elsevier.
Kom, G., Tiedeu, A., Kom, M., 2005. Automated
detection of masses in mammograms by local adaptive
thresholding. Computers in Biology and Medicine.
Elsevier.
te Brake, G. M., Karssemeijer, N., Hendriks, J. H., 1998.
Automated detection of breast carcinomas not detected
in a screening program. Radiology. Elsevier.
Petrick, N., Chan, H. P., Sahiner, B., Wei, D., 1996. An
adaptive density-weighted contrast enhancement filter
for mammographic breast mass detection. IEEE
Transaction Medical Imaging. IEEE.
Gupta, R., Undrill, P. E., 1995. The use of texture analysis
to identify suspicious masses in mammography. Phys.
Med. Bio.
Viton, J. L., Rasigni, M. R. G., Llebaria, A., 1996. Method
for characterizing masses in digital mammograms.
Opt. Eng.
Li, H., Wang, Y., Ray Liu, K. J., Shih-Chung, B. L.,
Freedman, M. T., 2001. Computerized radiographic
mass detection. Part I-II: lesion site selection by
morphological enhancement and contextual
segmentation. IEEE Transaction Image Processing.
IEEE.
Highnam, R., Brady, M. 1999. Mammographic Image
Analysis. Kluwer Academic Publishers.
Tourassi, G. D., Vargas-Voracek, R.. 2003. Computer-
assisted detection of mammographic masses: a
template matching scheme based on mutual
information. Med. Phys.
Rogova, G. L., Ke, C., Acharya, R., Stomper, P., 1999.
Feature Choice for detection of cancerous masses by
constrained optimization. In SPIE Conference on
Image Processing.
Sameti, M., Ward, R. K., 1996 A fuzzy segmentation
algorithm for mammogram partitioning. Digital
Mammography. Elsevier.
Zheng, B., Chang, Y. H., Wang, X. H., Good, W. F., 1999.
Comparison of artificial neural network and Bayesian
belief network in a computer assisted diagnosis
scheme for mammography. In IEEE International
conference on Neural Network.
Sahiner, B., Chan, H. P., Petrick, N., Helvie, M. A.,
Goodsitt, M. M., 1998. Desing of high-sensitivity
classifier based on a genetic algorithm: application to
computer aided diagnosis. Phys. Med. Bio.
Constantinidis, A. S., Fairhust, M. C., Rahman, A. F. R.,
2001. A new multi-expert decision combination
algorithm and its application to the detection of
circumscribed masses in digital mammograms.
Pattern Recognition.
Cascio, D., Fauci, F., Magro, R., Raso, G., Bellotti, R., De
Carlo, F., Tangaro, S., De Nunzio, G,. Quarta, M.,
Forni, G., others. 2006. Mammogram Segmentation by
Contour Searching and Mass Lesions Classification
With Neural Network. IEEE Transaction on Nuclear
Science. IEEE.
Domìnguez, A. R., Nandi, A. K., 2008. Detection of
masses in mammograms via statistically based
enhancement, multilevel-thresholding segmentation,
and region selection. Computerized Medical Imaging
and Graphics. Elsevier.
Choi, J. Y., Ro, Y. M.. 2012. Multiresolution local binary
pattern texture analysis combined with variable
selection for application to false-positive reduction in
computer-aided detection of breast masses on
mammograms. Physics in Medicine and Biology. Iop
Publishing.
Oliver, A., Freixenet, J., Perez, E., Pont, J., Denton, E. R.
E., Zwiggelar, R.. 2010. A review of automatic mass
detection and segmentation in mammographic masses.
Med. Image Analysis.
Muramatsu, C., Nishimura, K., Endo, T., Oiwa, M.,
Shiraiwa, M., Doi, K., Fujita, H., 2013. Representation
of lesions similarity by use of Multidimensional
Scaling for Breast Masses on Mammograms. Digit
Imaging. Springer.
Natarajan, P., Ghosh, D., Sandeep, K. N., Jilani, S., 2013.
Detection of Tumor in Mammogram Images using
Extended Local Minima Threshold. IJET International
Journal of Engineering and Technology.
Alias, A., Paulchamy, B.. 2014. Detection of Breast
Cancer using artifical neural network. International
Journal of Innovative Research in Science.
Bay, H., Tuytelaars, T., Van Gool, L., 2008. Surf: Speeded
up robust features. Computer vision and image
understanding. Elsevier.
Farruggia, A., Magro, R., Vitabile, S., 2014. A text based
indexing system for mammographic image retrieval
and classification. Future Generation Computer
Systems. Elsevier.
Kekre, H. B., Sarode, Tanuja, K., Gharge, Saylee M.,
2009. Tumor Detection in mammography images
using vector quantization technique. International
Journal of Intellingent Information Technology
Application.
Lau, T. K., Bischof, W. F., 1991. Automated detection of
breast tumors using the asymmetry approach.
Computers and biomedical research. Elsevier.
ICPRAM2015-InternationalConferenceonPatternRecognitionApplicationsandMethods
308
